Melbourne TIRTL Truck Movement & Freight Intelligence:
Truck Share, Freight Corridors, Interactive Maps and Heavy-Vehicle Exposure Analysis
A Melbourne TIRTL traffic intelligence layer covering
3.13+ billion classified vehicle movement records,
159.6+ million classified truck movement records,
truck-share analytics,
monitored freight corridor rankings, suburb/locality truck pressure,
interactive truck and freight maps, colour-coded charts,
data-quality caveats and reproducible analytical outputs.
Melbourne Truck Movement Data, Freight Corridor Rankings and Heavy-Vehicle Exposure Intelligence
This Melbourne TIRTL Truck Movement & Freight Intelligence page analyses classified traffic movement records,
truck movement records, truck share, freight corridor exposure, heavy-vehicle pressure, suburb truck intensity,
interactive truck maps and SCATS + TIRTL transport pressure indicators across Melbourne.
The page is designed for journalists, freight operators, transport planners, councils, road authorities,
OOH media analysts, logistics businesses, researchers and members of the public who want to understand
where Melbourne truck movement, freight pressure and general traffic pressure overlap.
TIRTL adds the truck-specific and freight-specific layer to Melbourne traffic intelligence.
SCATS reveals long-term traffic volume and signalised road pressure, while TIRTL helps identify
truck-heavy monitored roads, freight corridors and heavy-vehicle exposure hotspots.
Melbourne TIRTL dataTruck movement recordsMelbourne truck trafficFreight corridor intelligenceTruck share analysisHeavy vehicle exposureSCATS + TIRTL pressure analysisWest Gate Bridge truck movementsDohertys Road freight corridorSuburb truck pressureInteractive freight mapsMelbourne transport data
3.13+ billion classified vehicle movement records ·
159.6+ million classified truck movement records ·
5.09% network truck share ·
562 monitored site-heading records ·
303 unique TIRTL sites ·
47 suburbs/localities ·
Interactive truck and freight corridor maps
The Melbourne TIRTL Truck Movement & Freight Intelligence layer is designed
as a reproducible public-interest traffic intelligence product, with methodology,
caveats, analytical outputs, charts and map layers prepared for public review,
media use, transport analysis and future open-source extension.
Important interpretation notice
Vehicle movements and truck movements are classified TIRTL sensor movement records / passings.
They are not counts of unique vehicles or unique trucks.
A real-world vehicle may appear in multiple movement records if it passes multiple monitored
points or returns later. These figures should be read as movement intensity and freight exposure,
not as a count of individual trucks or cars in Melbourne.
Found this platform useful?
Please consider sharing the Melbourne TIRTL Truck Movement & Freight Intelligence page with
journalists, transport planners, engineers, developers,
freight and logistics operators, OOH media professionals,
researchers or anyone interested in Melbourne truck movement and freight corridor intelligence.
Quick Access
Popular Melbourne TIRTL Truck and Freight Intelligence
Jump straight to the main TIRTL truck movement, truck-share, freight corridor,
suburb/locality, map, chart, methodology and download sections.
3.13B+ vehicle movement records159.6M+ truck movement records562 site-headings303 TIRTL sites47 suburbs/localities21 freight corridors
This page is configured to display live audience reach for journalists, researchers,
councils, freight/logistics observers, OOH media, community groups and organisations
assessing the public value of the Melbourne TIRTL truck and freight intelligence project.
Loading...
Total TIRTL Page Views
Live count from the server-side TIRTL page counter.
May 2026
Page First Published
Public TIRTL truck and freight intelligence page release period.
2025-11 → 2026-05
Detected TIRTL Coverage Window
Based on imported TIRTL site-heading and movement records.
3.13B+
Classified Vehicle Records
Melbourne TIRTL classified movement records analysed.
159.6M+
Truck Movement Records
Truck-classified records used for heavy-vehicle and freight intelligence.
SCATS + TIRTL
Integrated Evidence Layer
Combines signal-volume, truck-share, speed-flow and corridor intelligence.
Page view statistics are generated from the live server counter at
get_tirtl_views.php.
Headline Metrics
Melbourne TIRTL Truck Movement Intelligence — headline metrics
This section summarises the current Melbourne TIRTL truck movement intelligence layer:
truck movement records, total vehicle movement records, network truck share,
monitored site-headings, suburbs/localities, and the highest-ranking truck movement records.
Important terminology:
Vehicle movements and truck movements are classified TIRTL sensor movement records / passings. They are not counts of unique vehicles or unique trucks.
3,134,471,167
Vehicle movement records
Classified TIRTL sensor passings, not unique vehicles.
159,620,033
Truck movement records
Classified truck passings, not unique trucks.
5.09%
Network truck share
Truck movement records as a share of all vehicle movement records.
562
Site-heading records
Directional TIRTL monitoring records in the enriched map layer.
303
Unique TIRTL sites
Base monitoring locations represented in the current output.
47
Suburbs / localities
Vicmap locality names joined to TIRTL site-heading coordinates.
7
Monthly periods
Monthly network summary periods currently represented.
2025-11 → 2026-05
Current coverage window
Based on available monthly and site-heading records.
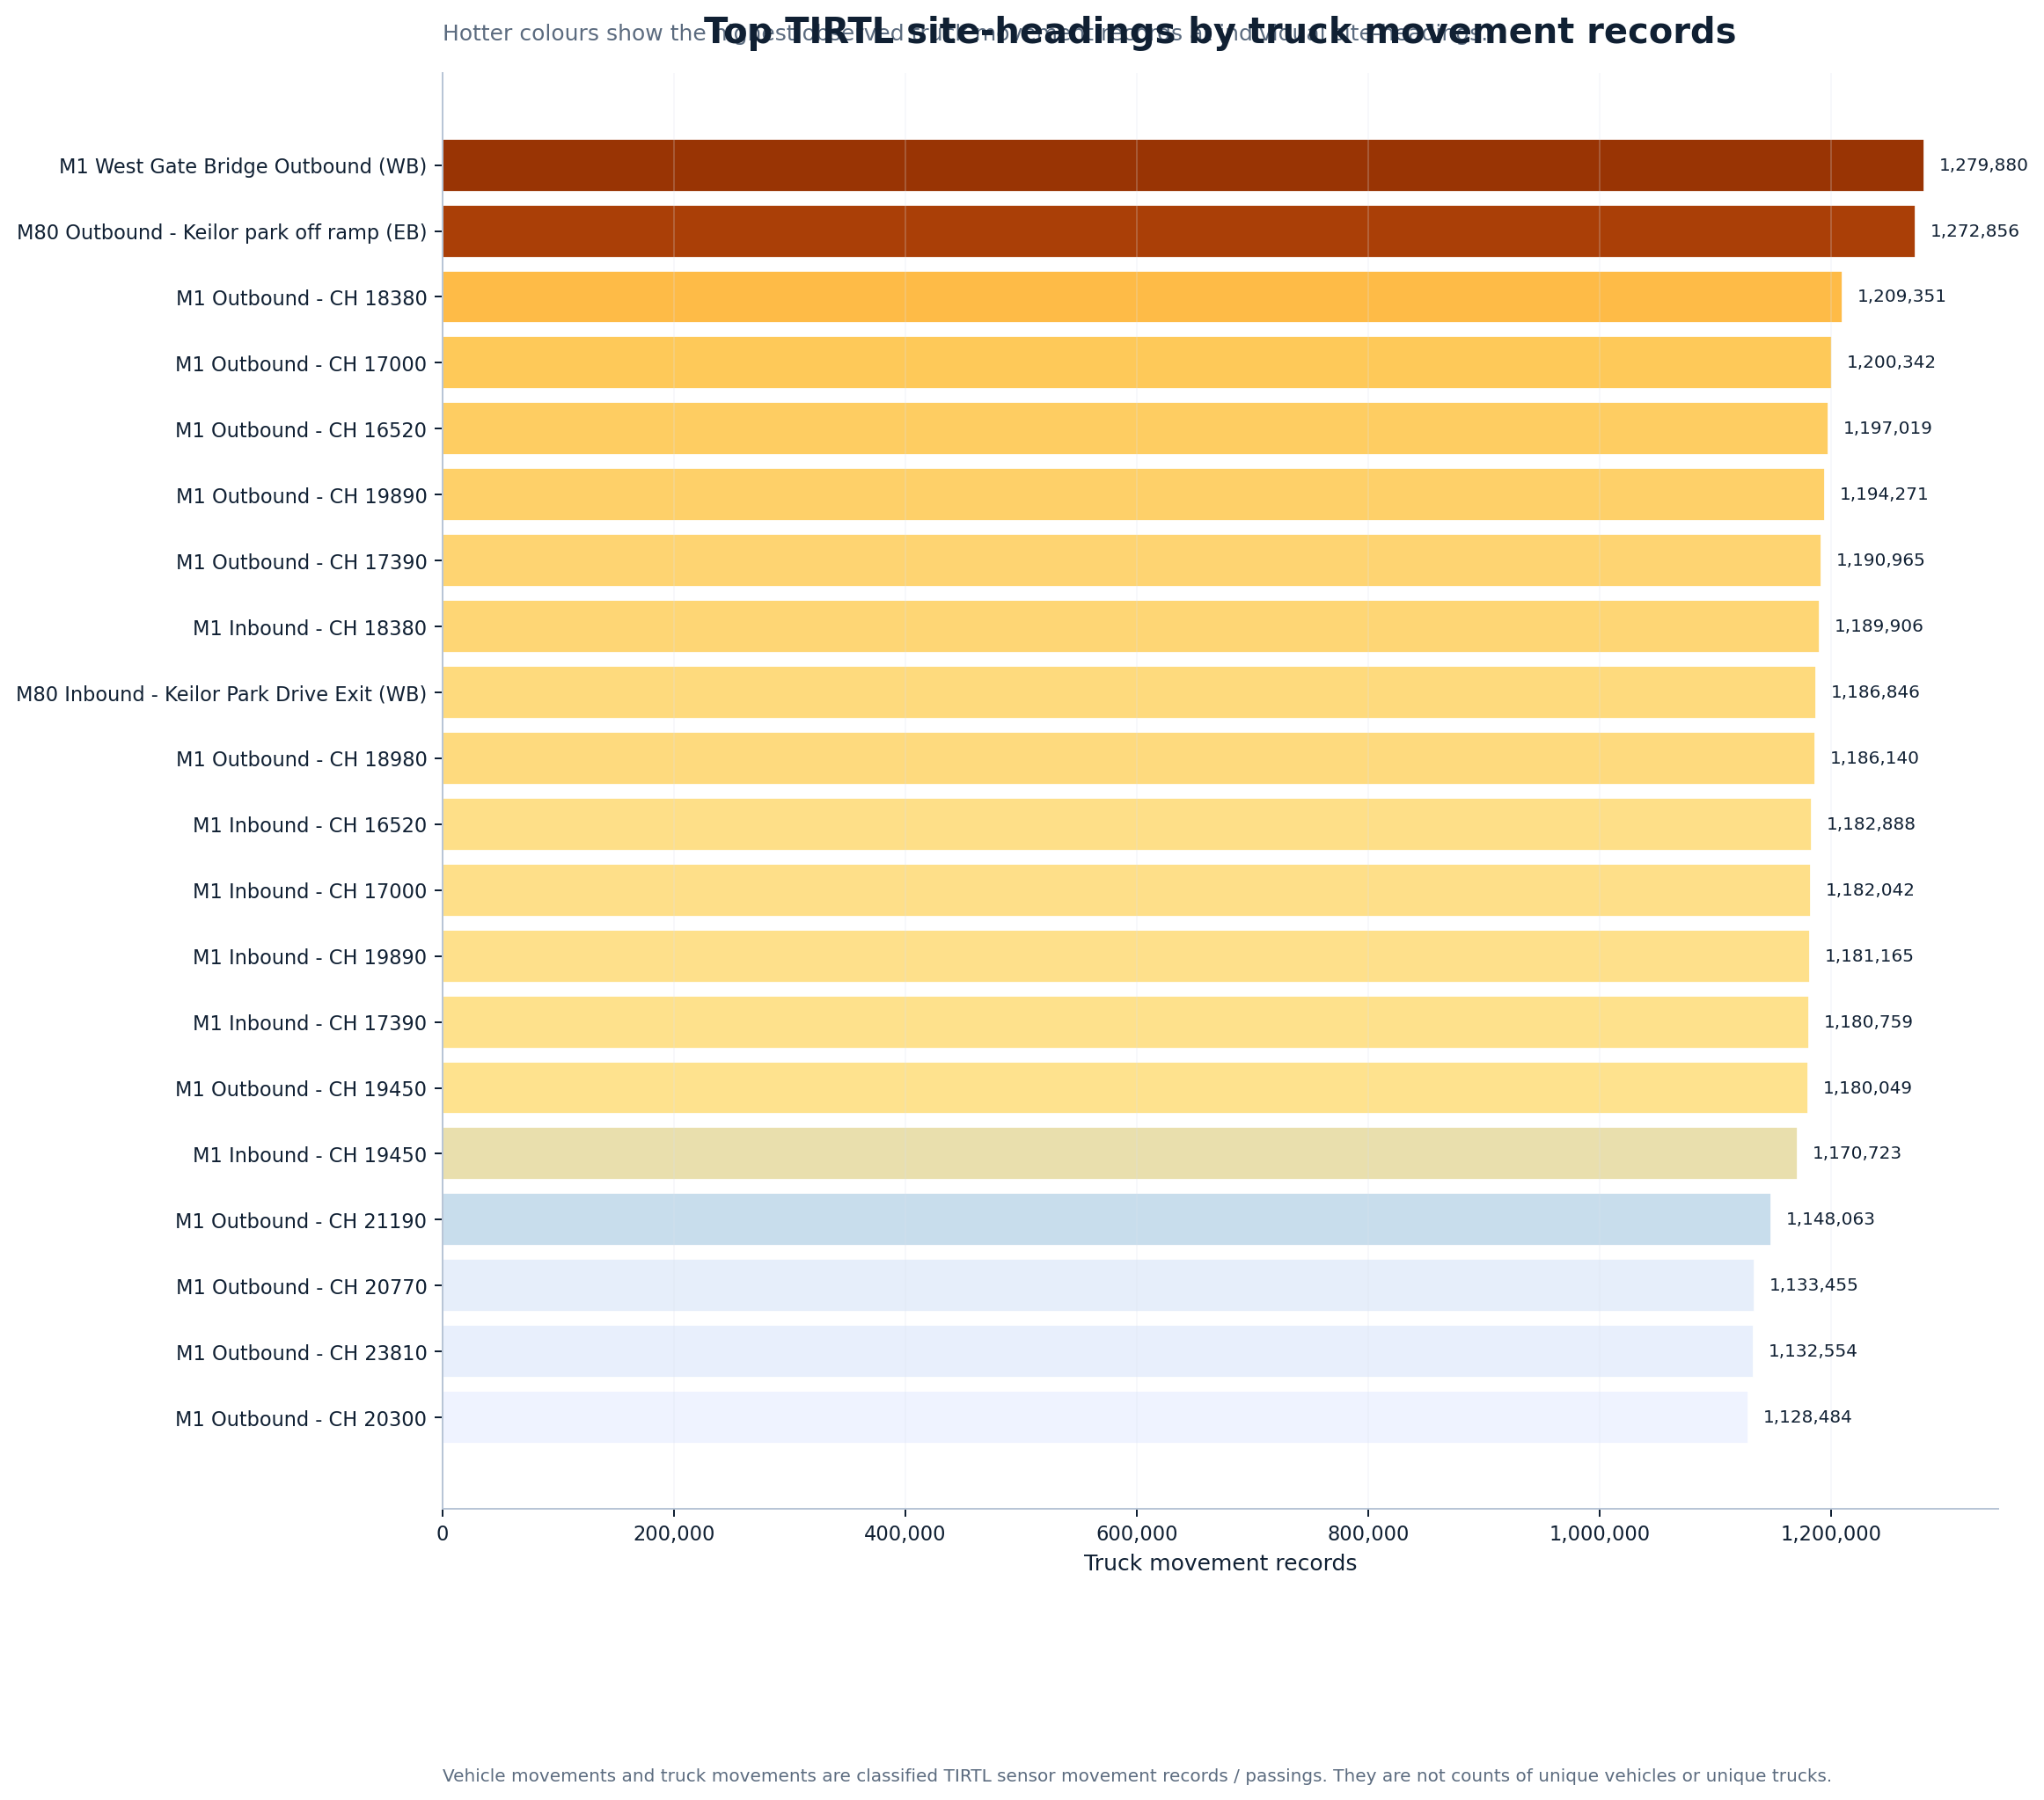
Top truck movement site
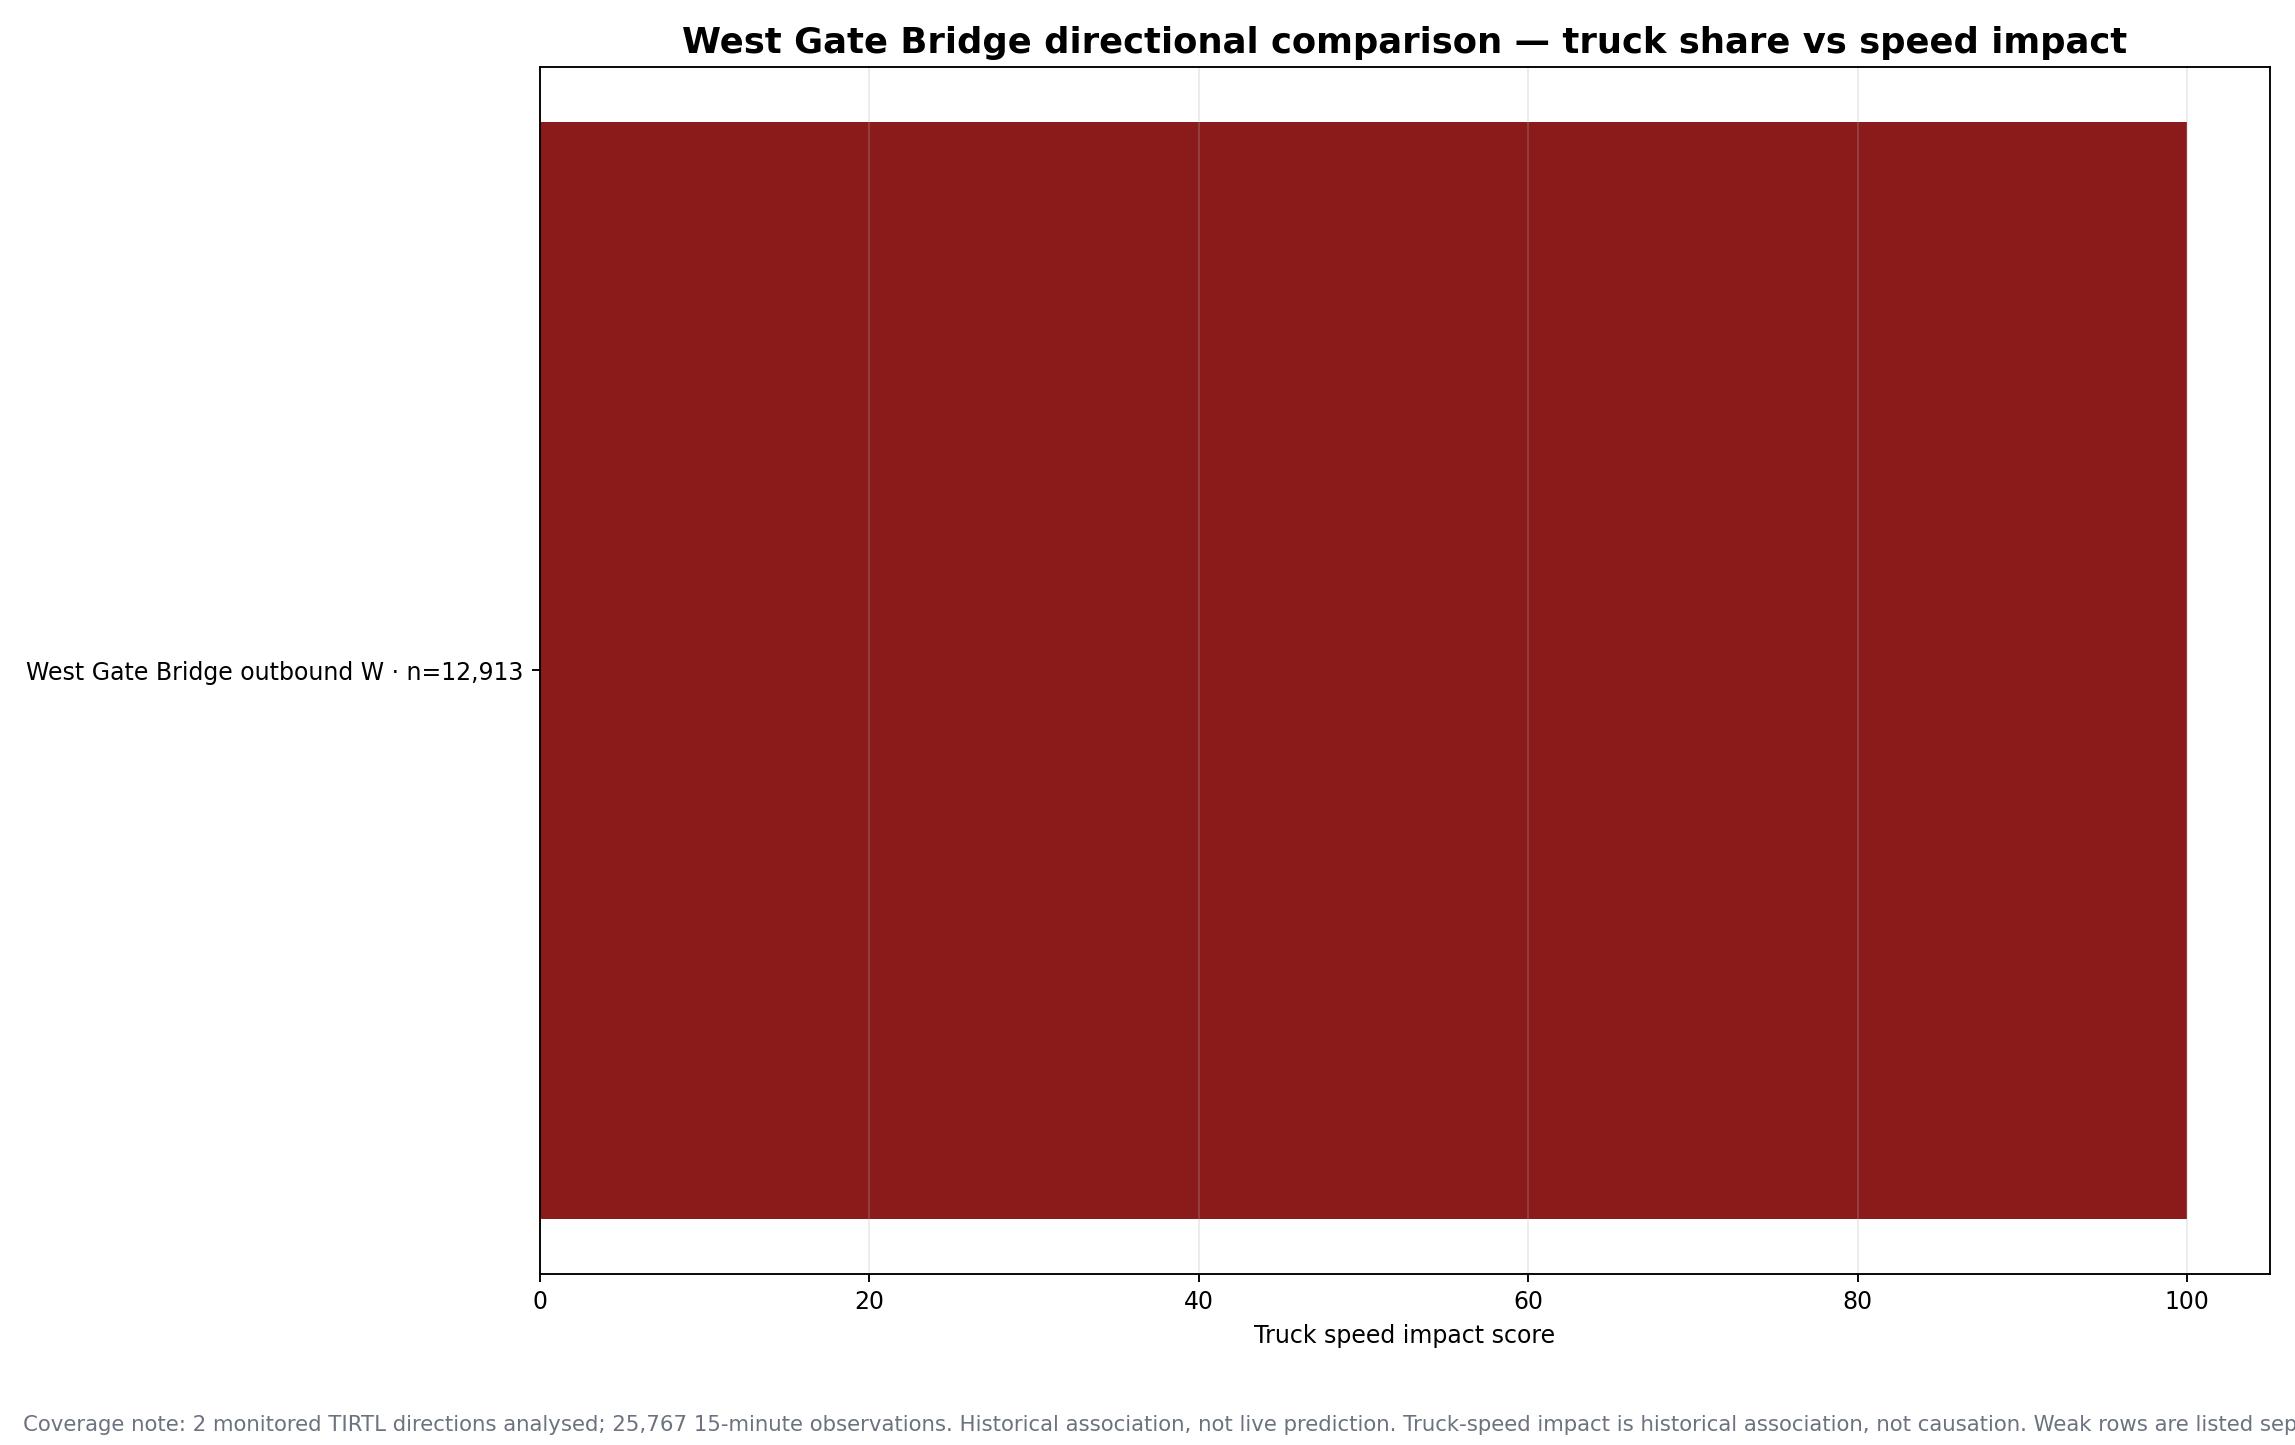
M1 West Gate Bridge Outbound (WB) in PORT MELBOURNE records the highest truck movement volume in the current enriched ranking, with 1,279,880 truck movement records from 17,066,572 total vehicle movement records (7.50% truck share). Source site 505 W.
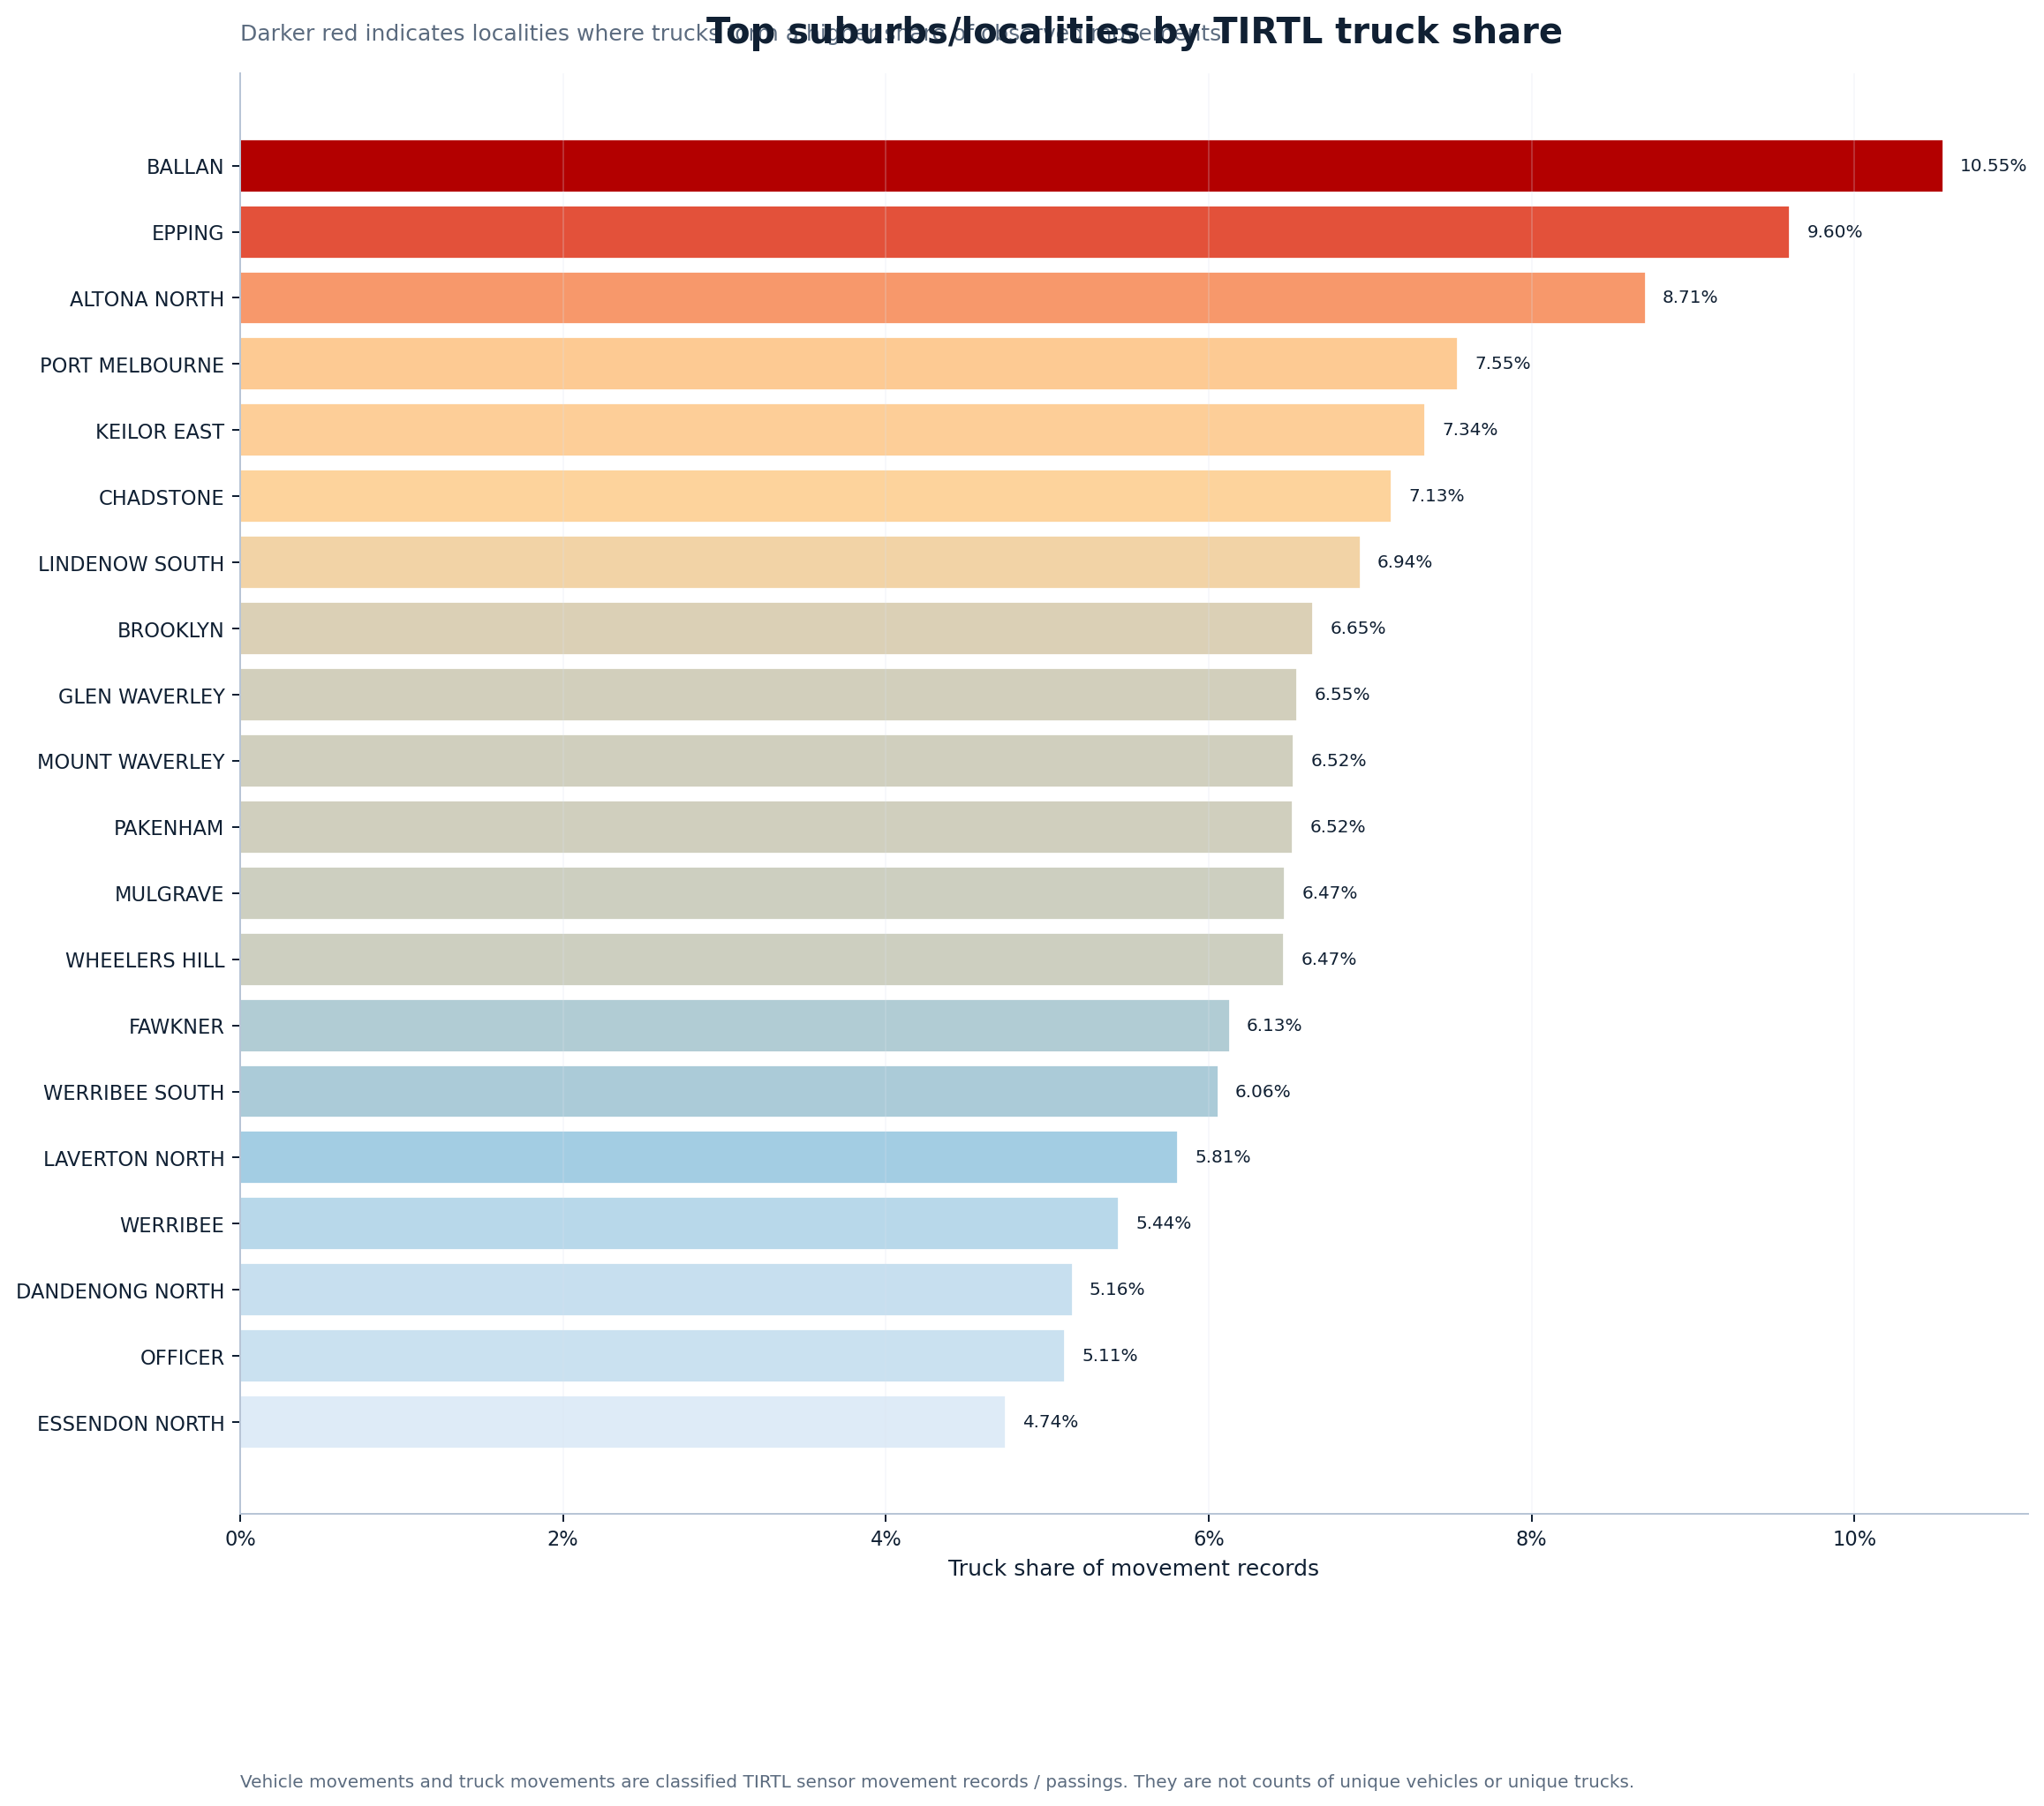
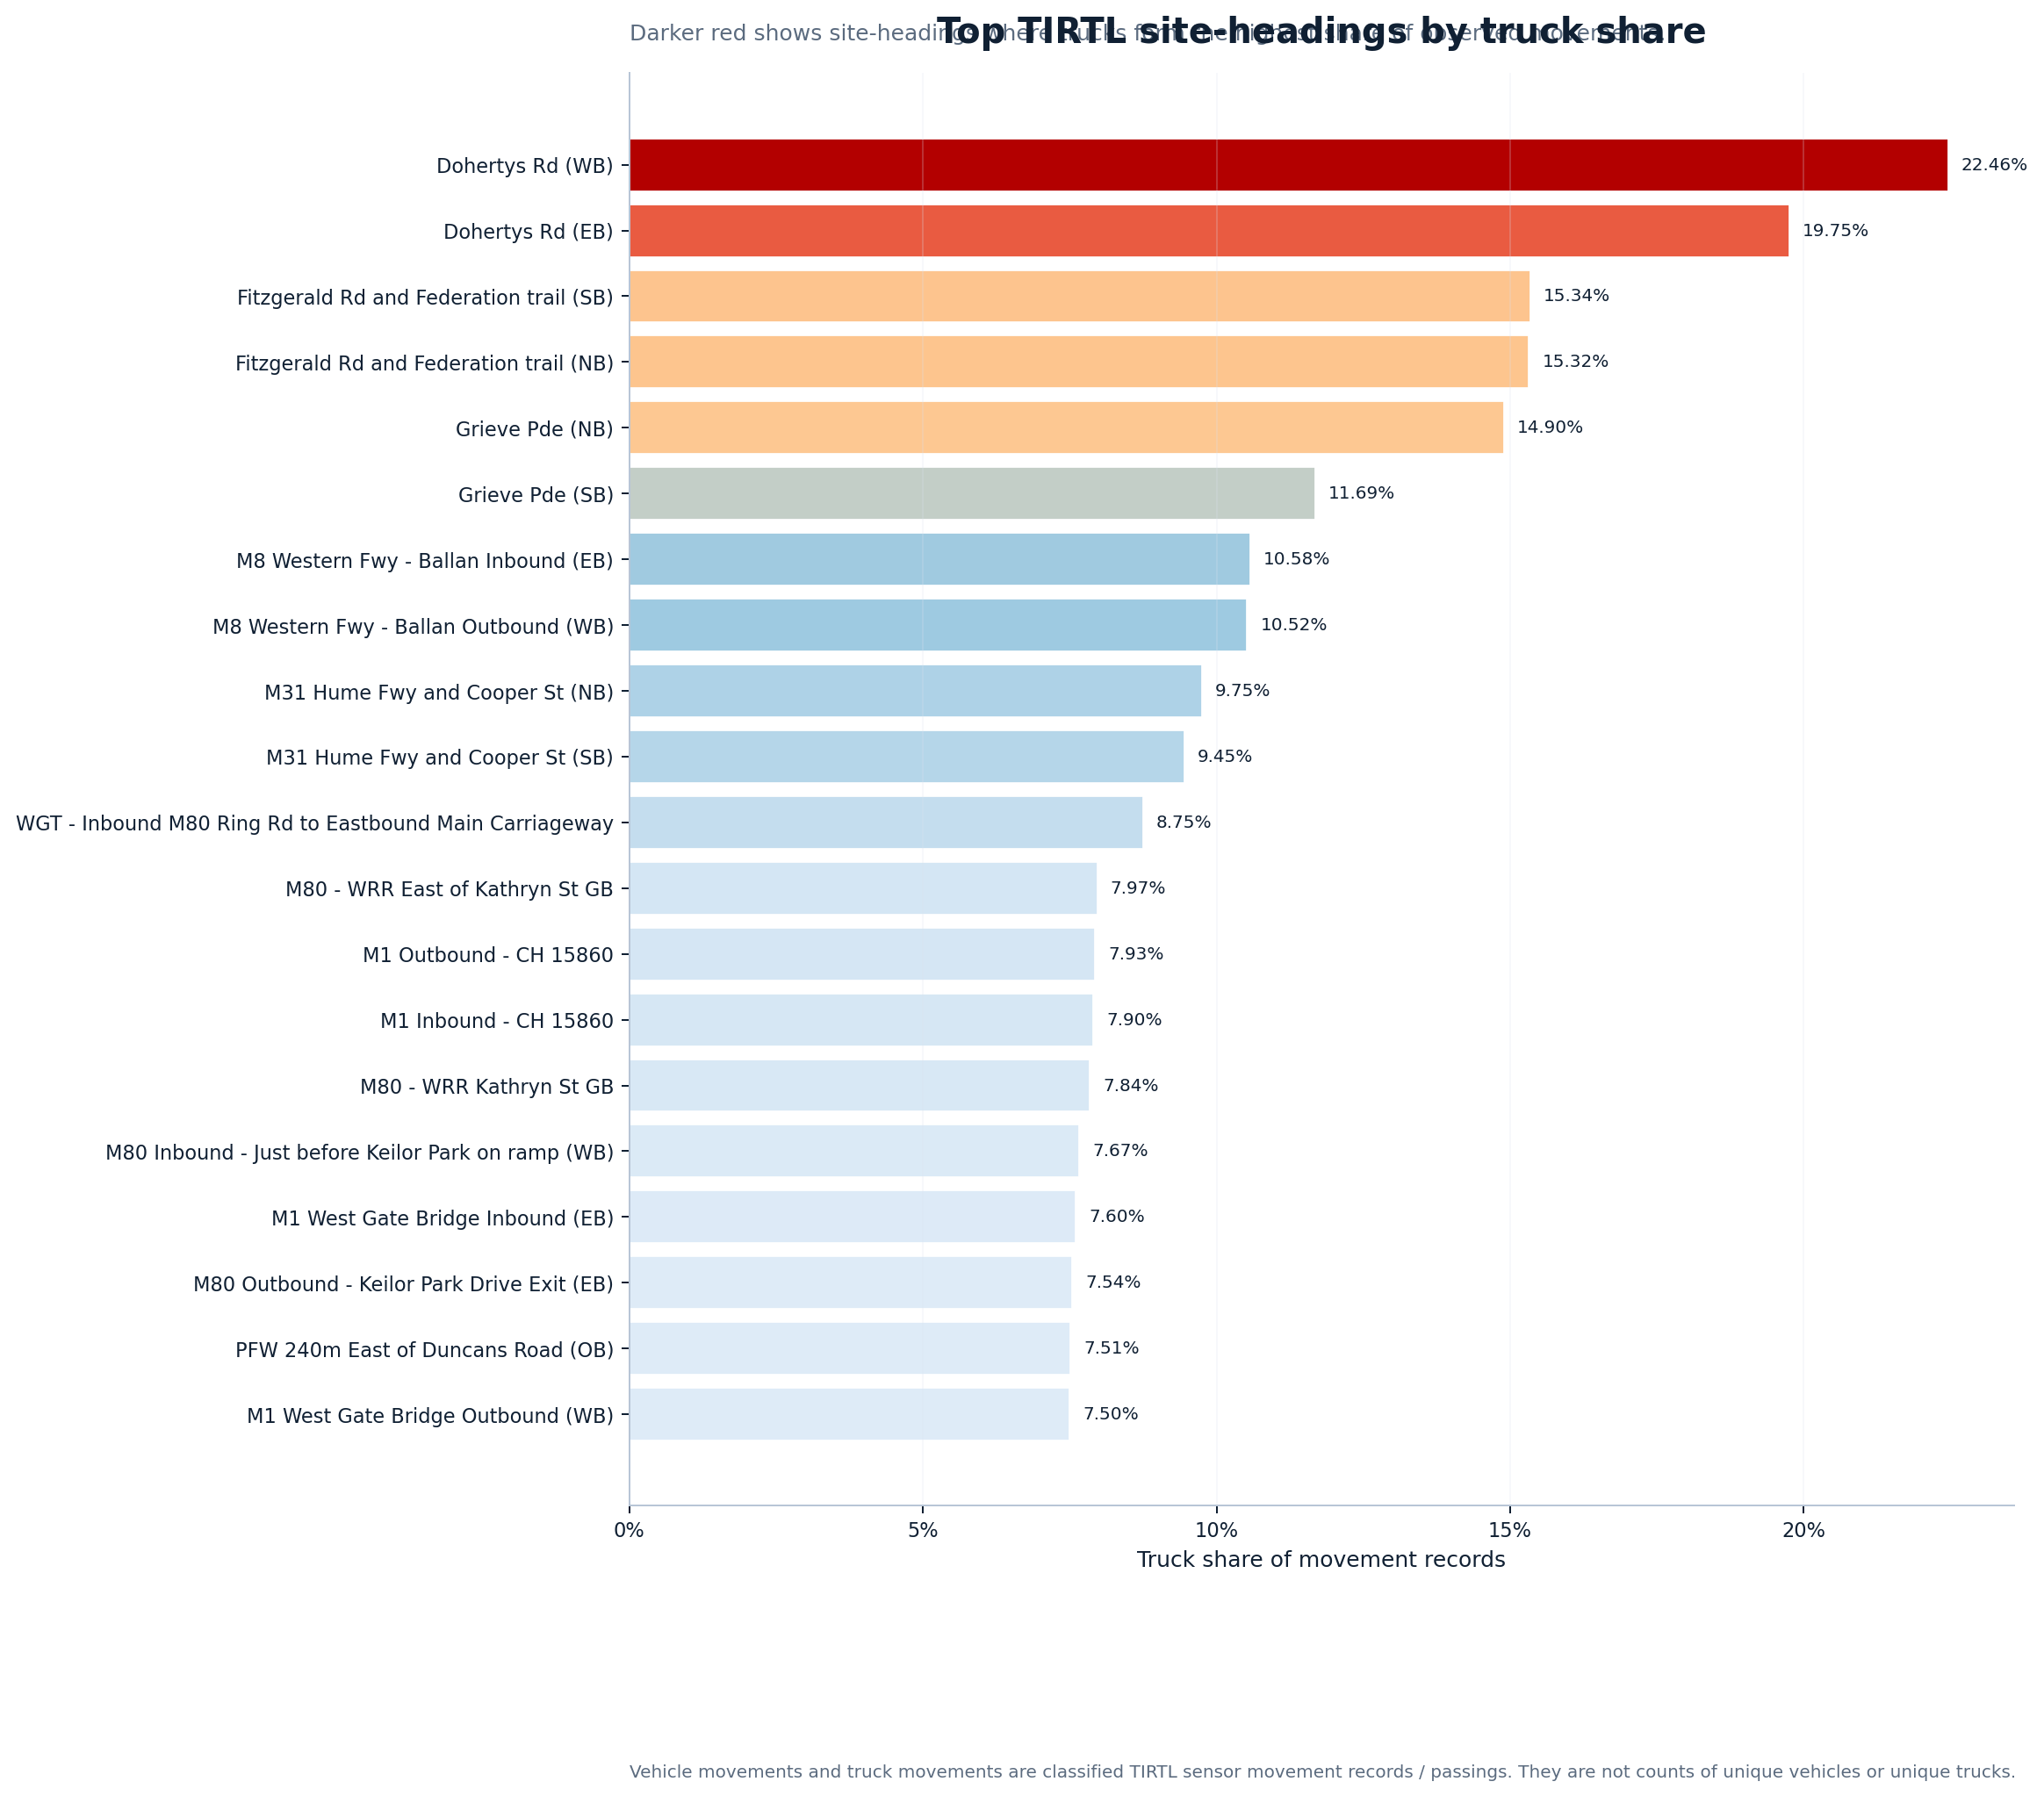
Top truck-share site
Dohertys Rd (WB) in ALTONA NORTH records the highest truck share in the current enriched ranking, with 22.46% truck share, 354,021 truck movement records and 1,576,084 total vehicle movement records. Source site 264 W.
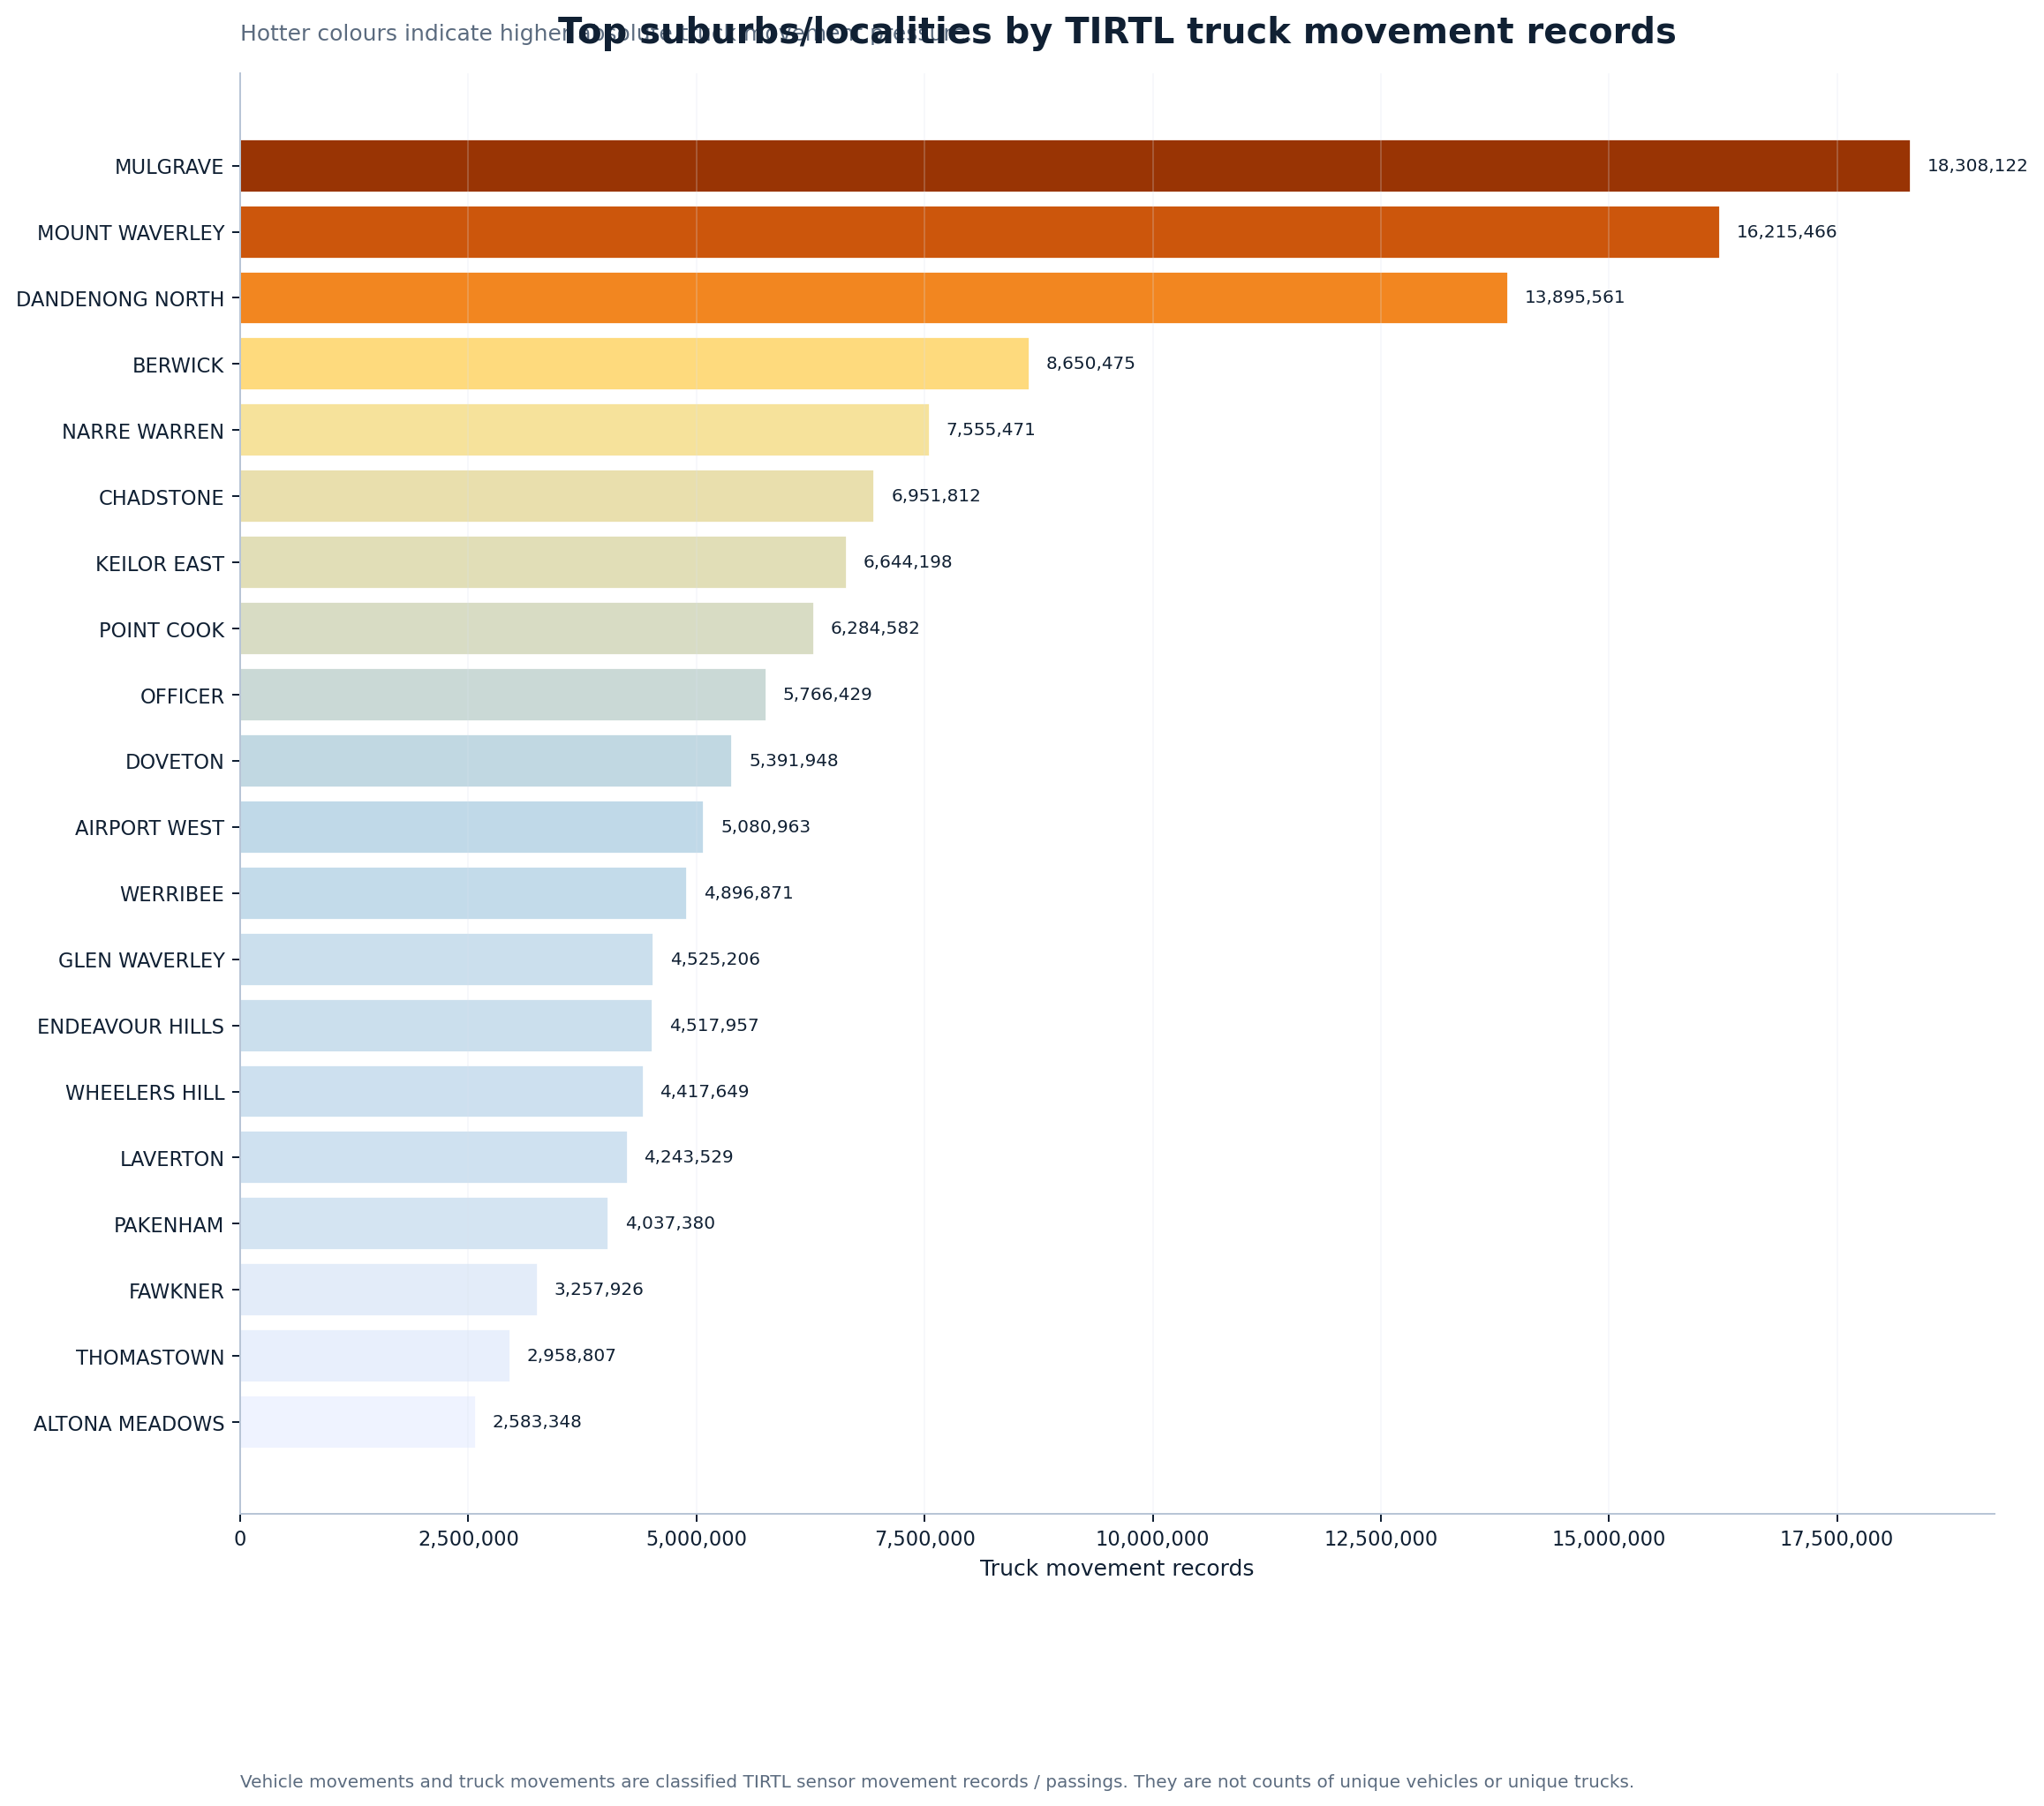
Top suburb/locality by truck movements
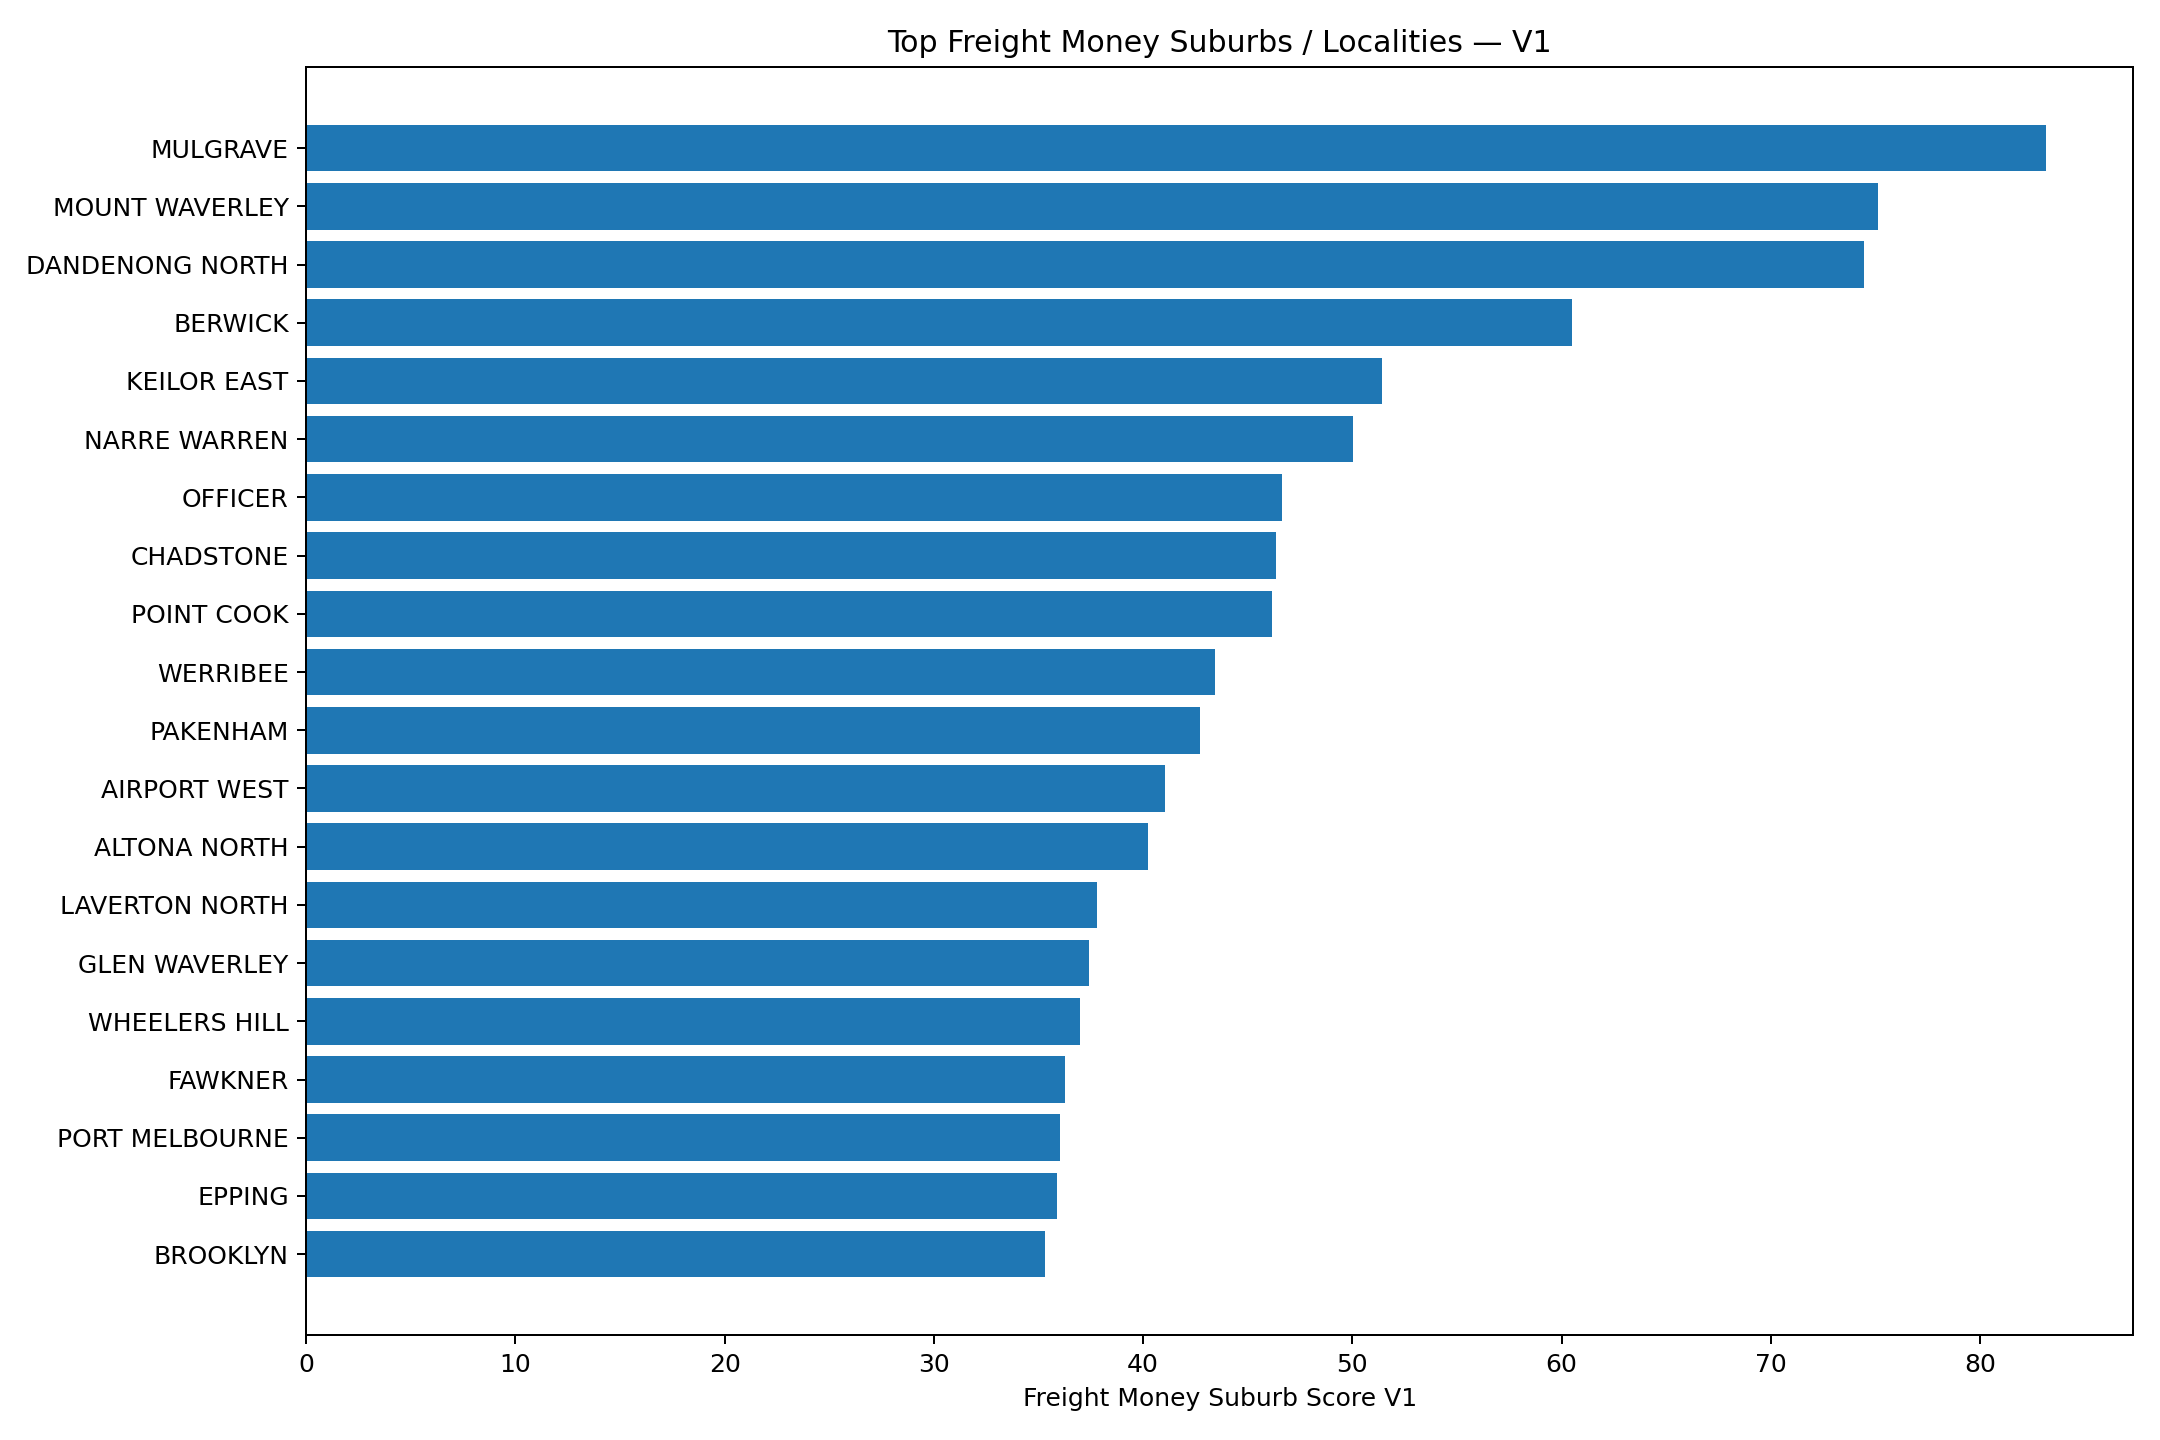
MULGRAVE
ranks highest in the current suburb/locality summary with 18,308,122 truck movement records and 6.47% truck share.
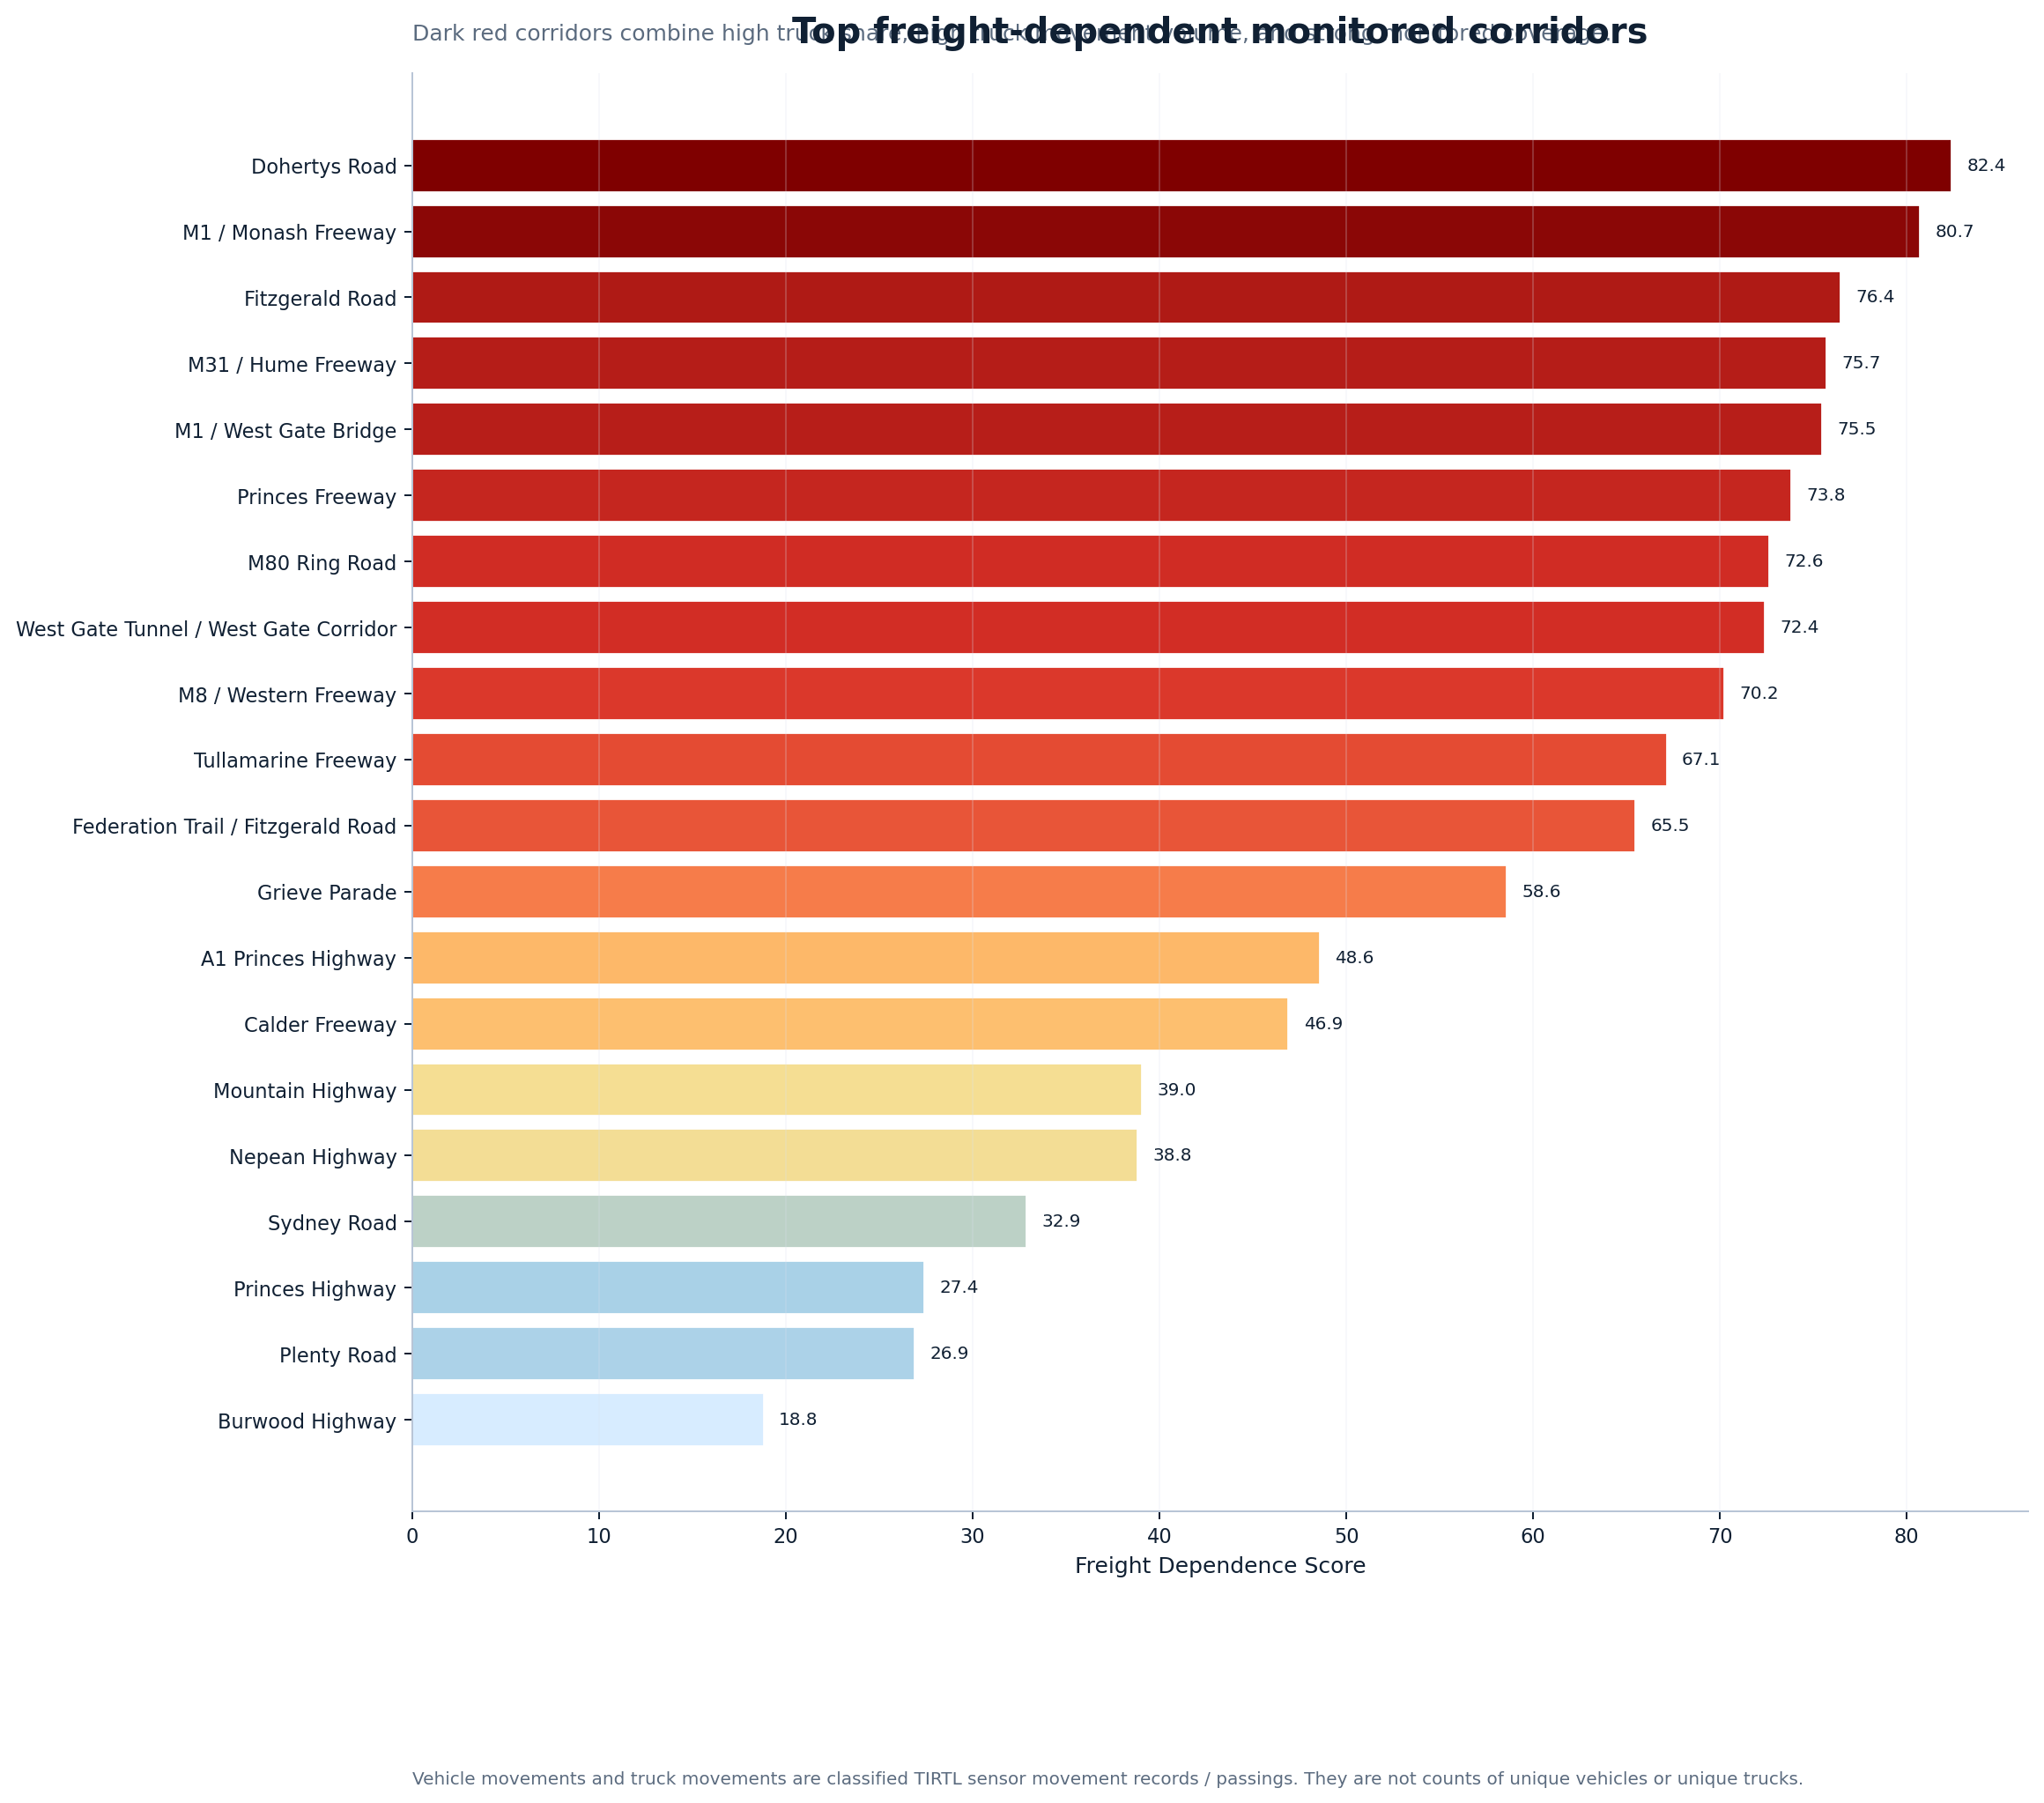
Top freight-dependence corridor
Dohertys Road
ranks highest in the Version 1 freight corridor model with a score of 82.38, classified as High freight dependence, with 21.05% truck share and 691,967 truck movement records.
Key Findings
Top TIRTL truck movement and freight intelligence findings
These findings translate the current TIRTL outputs into a journalist-friendly summary:
network-scale truck movement records, freight-dependent corridors, truck-share hot spots,
suburb/locality summaries, and the future value of combining TIRTL with SCATS.
Important terminology:
Vehicle movements and truck movements are classified TIRTL sensor movement records / passings. They are not counts of unique vehicles or unique trucks.
#1Network overviewMajor finding
The TIRTL layer now gives Melbourne a truck-specific movement view
The current enriched TIRTL layer contains 3,134,471,167 vehicle movement records and 159,620,033 truck movement records, with a network-wide truck share of 5.09%.
Why it matters:SCATS shows total movement pressure, but TIRTL adds a heavy-vehicle and freight dimension. That makes it possible to separate ordinary traffic pressure from freight-heavy road function.
Evidence:562 site-heading records across 303 unique sites and 47 suburbs/localities.
#2Freight corridorMajor finding
Dohertys Road ranks as the strongest freight-dependence corridor in the V1 model
Dohertys Road ranks first in the Version 1 freight corridor model, with a Freight Dependence Score of 82.38, a truck share of 21.05%, and 691,967 truck movement records from 3,286,814 vehicle movement records.
Why it matters:This shows the value of combining relative truck share with absolute truck volume. A road can be freight-important because trucks form a large share of traffic, because it carries a huge number of trucks, or both.
Evidence:Freight-dependence band: High freight dependence.
#3Truck movement rankingMajor finding
The top truck movement site is a high-volume freight exposure point
M1 West Gate Bridge Outbound (WB) in PORT MELBOURNE records the highest truck movement volume in the enriched top-site ranking, with 1,279,880 truck movement records and 7.50% truck share.
Why it matters:Absolute truck movement volume identifies where the largest heavy-vehicle loads are being observed, even when truck share is not the highest percentage in the network.
Evidence:Source site 505 W; total vehicle movement records: 17,066,572.
#4Truck-share rankingMajor finding
The highest truck-share sites reveal freight-dominant road segments
Dohertys Rd (WB) in ALTONA NORTH has the highest truck share in the enriched ranking, with trucks representing 22.46% of movement records.
Why it matters:Truck-share rankings expose roads where heavy vehicles make up a large proportion of observed traffic. These are different from simple high-volume roads.
Evidence:Source site 264 W; truck movement records: 354,021; total vehicle movement records: 1,576,084.
#5Suburb/locality intelligenceSupporting finding
MULGRAVE ranks highest by suburb/locality truck movement records
MULGRAVE ranks first in the suburb/locality truck summary, with 18,308,122 truck movement records from 282,977,913 total vehicle movement records and a truck share of 6.47%.
Why it matters:Suburb/locality aggregation makes the TIRTL output easier for journalists, councils, residents, and businesses to understand without needing to interpret individual sensor records.
Evidence:32 site-heading records and 18 unique sites are represented for this locality in the current summary.
#6Spatial enrichmentSupporting finding
The TIRTL layer now supports suburb/locality-level freight summaries
The current enriched TIRTL output covers 47 Vicmap suburbs/localities, allowing truck movement pressure to be summarised geographically.
Why it matters:This converts technical sensor data into geography that the public can understand. It also makes future council, suburb, corridor, and media story pages possible.
Evidence:Suburb/locality names were added using spatial joins from TIRTL site-heading coordinates to Vicmap locality polygons.
#7Freight corridorSupporting finding
The freight corridor model starts classifying what roads are doing economically
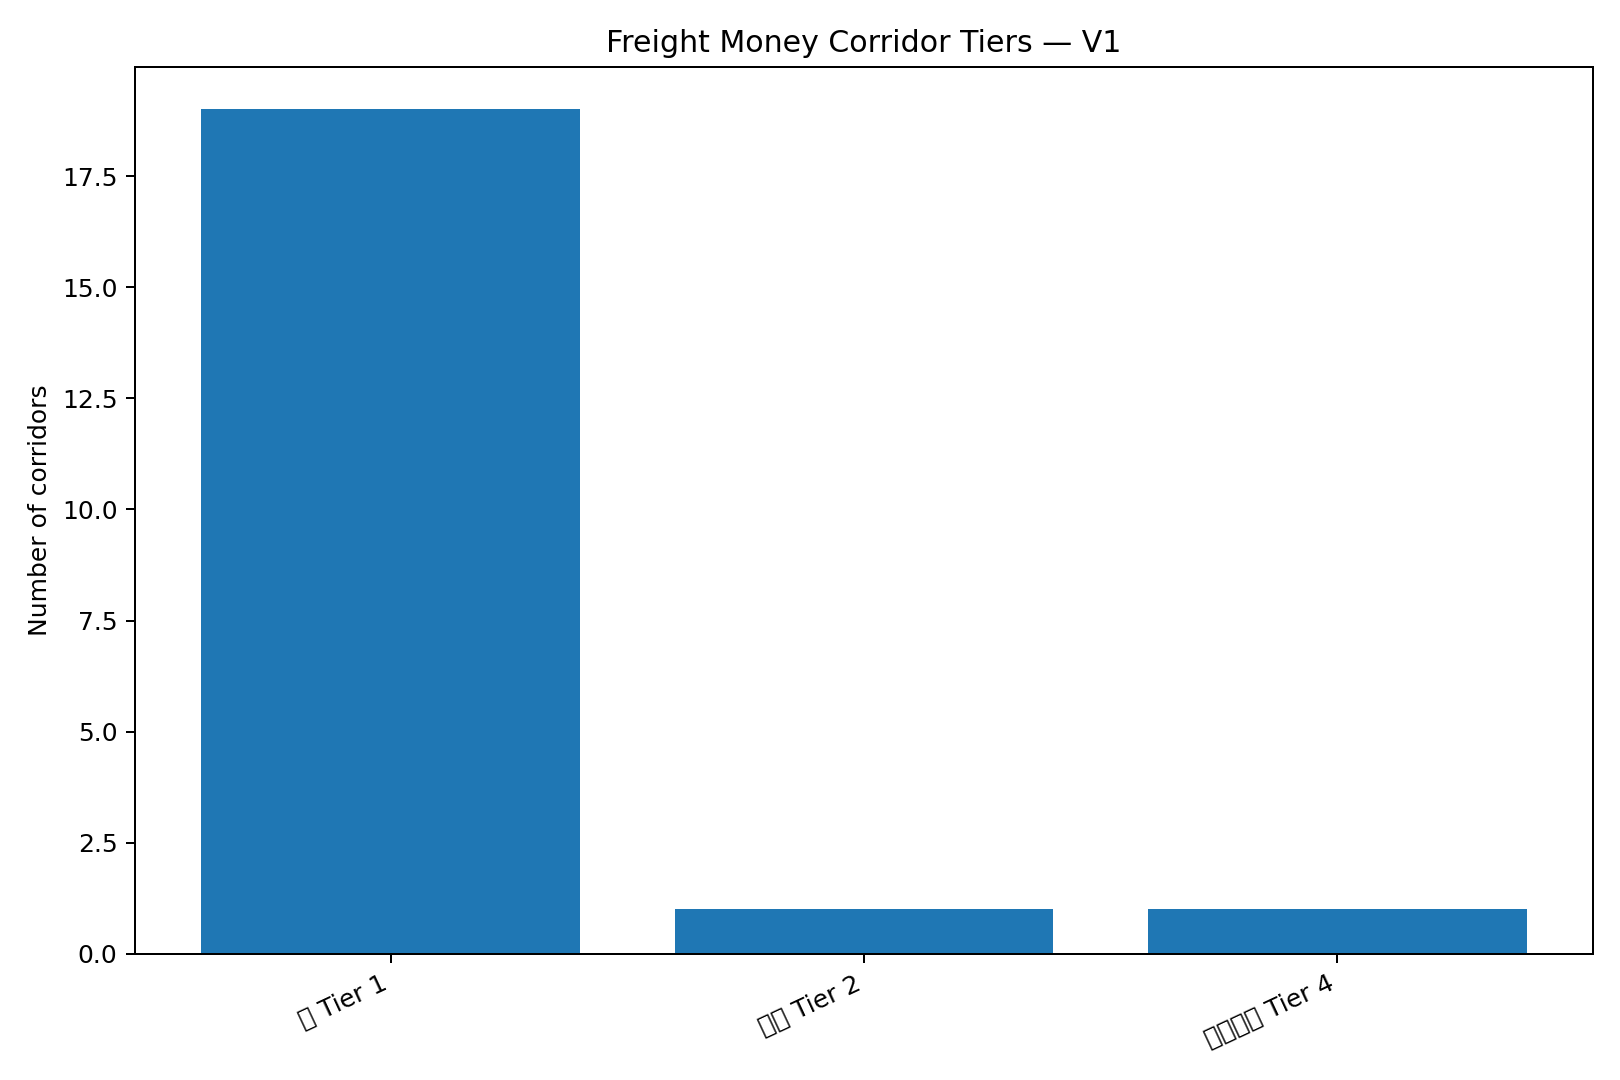
The Version 1 freight corridor output identifies 21 inferred monitored corridors. 0 are classified as extreme freight dependence and 9 as high freight dependence.
Why it matters:This moves the analysis from raw traffic counts into road-function intelligence: which roads behave like freight spines, mixed commuter/freight corridors, or lower freight-dependence roads.
The biggest future value comes from combining SCATS total traffic with TIRTL truck pressure
SCATS can identify total traffic pressure, while TIRTL can identify truck pressure and freight dependence. Together they can support a Melbourne Freight Exposure Index.
Why it matters:This enables insights that neither dataset can provide alone: high-traffic but truck-light places, moderate-traffic but truck-heavy places, freight corridors, commuter corridors, and mixed-use pressure zones.
Evidence:The current TIRTL outputs already include truck movement volume, truck share, site-heading coordinates, suburb/locality joins, monthly summaries, and corridor scores.
The public-facing wording must keep distinguishing movements from unique vehicles
Every major TIRTL page should state that vehicle movements and truck movements are sensor passings, not unique vehicle counts.
Why it matters:This prevents overclaiming, protects the credibility of the work, and makes the outputs easier for journalists and officials to use responsibly.
Evidence:Vehicle movements and truck movements are classified TIRTL sensor movement records / passings. They are not counts of unique vehicles or unique trucks.
For Journalists & Media
Top 10 Melbourne Freight and Truck Movement Story Angles
These story angles translate the Melbourne TIRTL Truck Movement & Freight Intelligence page into
journalist-ready ideas: freight corridors, truck-heavy suburbs, bridge dependency, industrial road function,
commercial cost pressure, and the public value of turning technical sensor records into readable intelligence.
The goal is to help journalists, editors, producers and researchers quickly identify where the story is,
what the evidence hook is, and how to avoid overstating the data.
Important terminology: vehicle movements and truck movements are classified TIRTL sensor movement records / passings.
They are not counts of unique vehicles or unique trucks.
#1Freight corridorTransport / business
Dohertys Road emerges as Melbourne’s strongest freight-dependence corridor
Possible headline: “The Melbourne industrial road where trucks dominate the traffic mix.”
Why it matters: This is a strong story because it separates freight dependence from ordinary traffic volume. A road can matter commercially because trucks form a very high share of its observed movement records, even if it is not the biggest road by total movement.
Evidence / page hook: Dohertys Road ranks first in the Version 1 freight corridor model, with a Freight Dependence Score of 82.38, 21.05% truck share and 691,967 truck movement records.
#2Truck volumeMainstream / transport
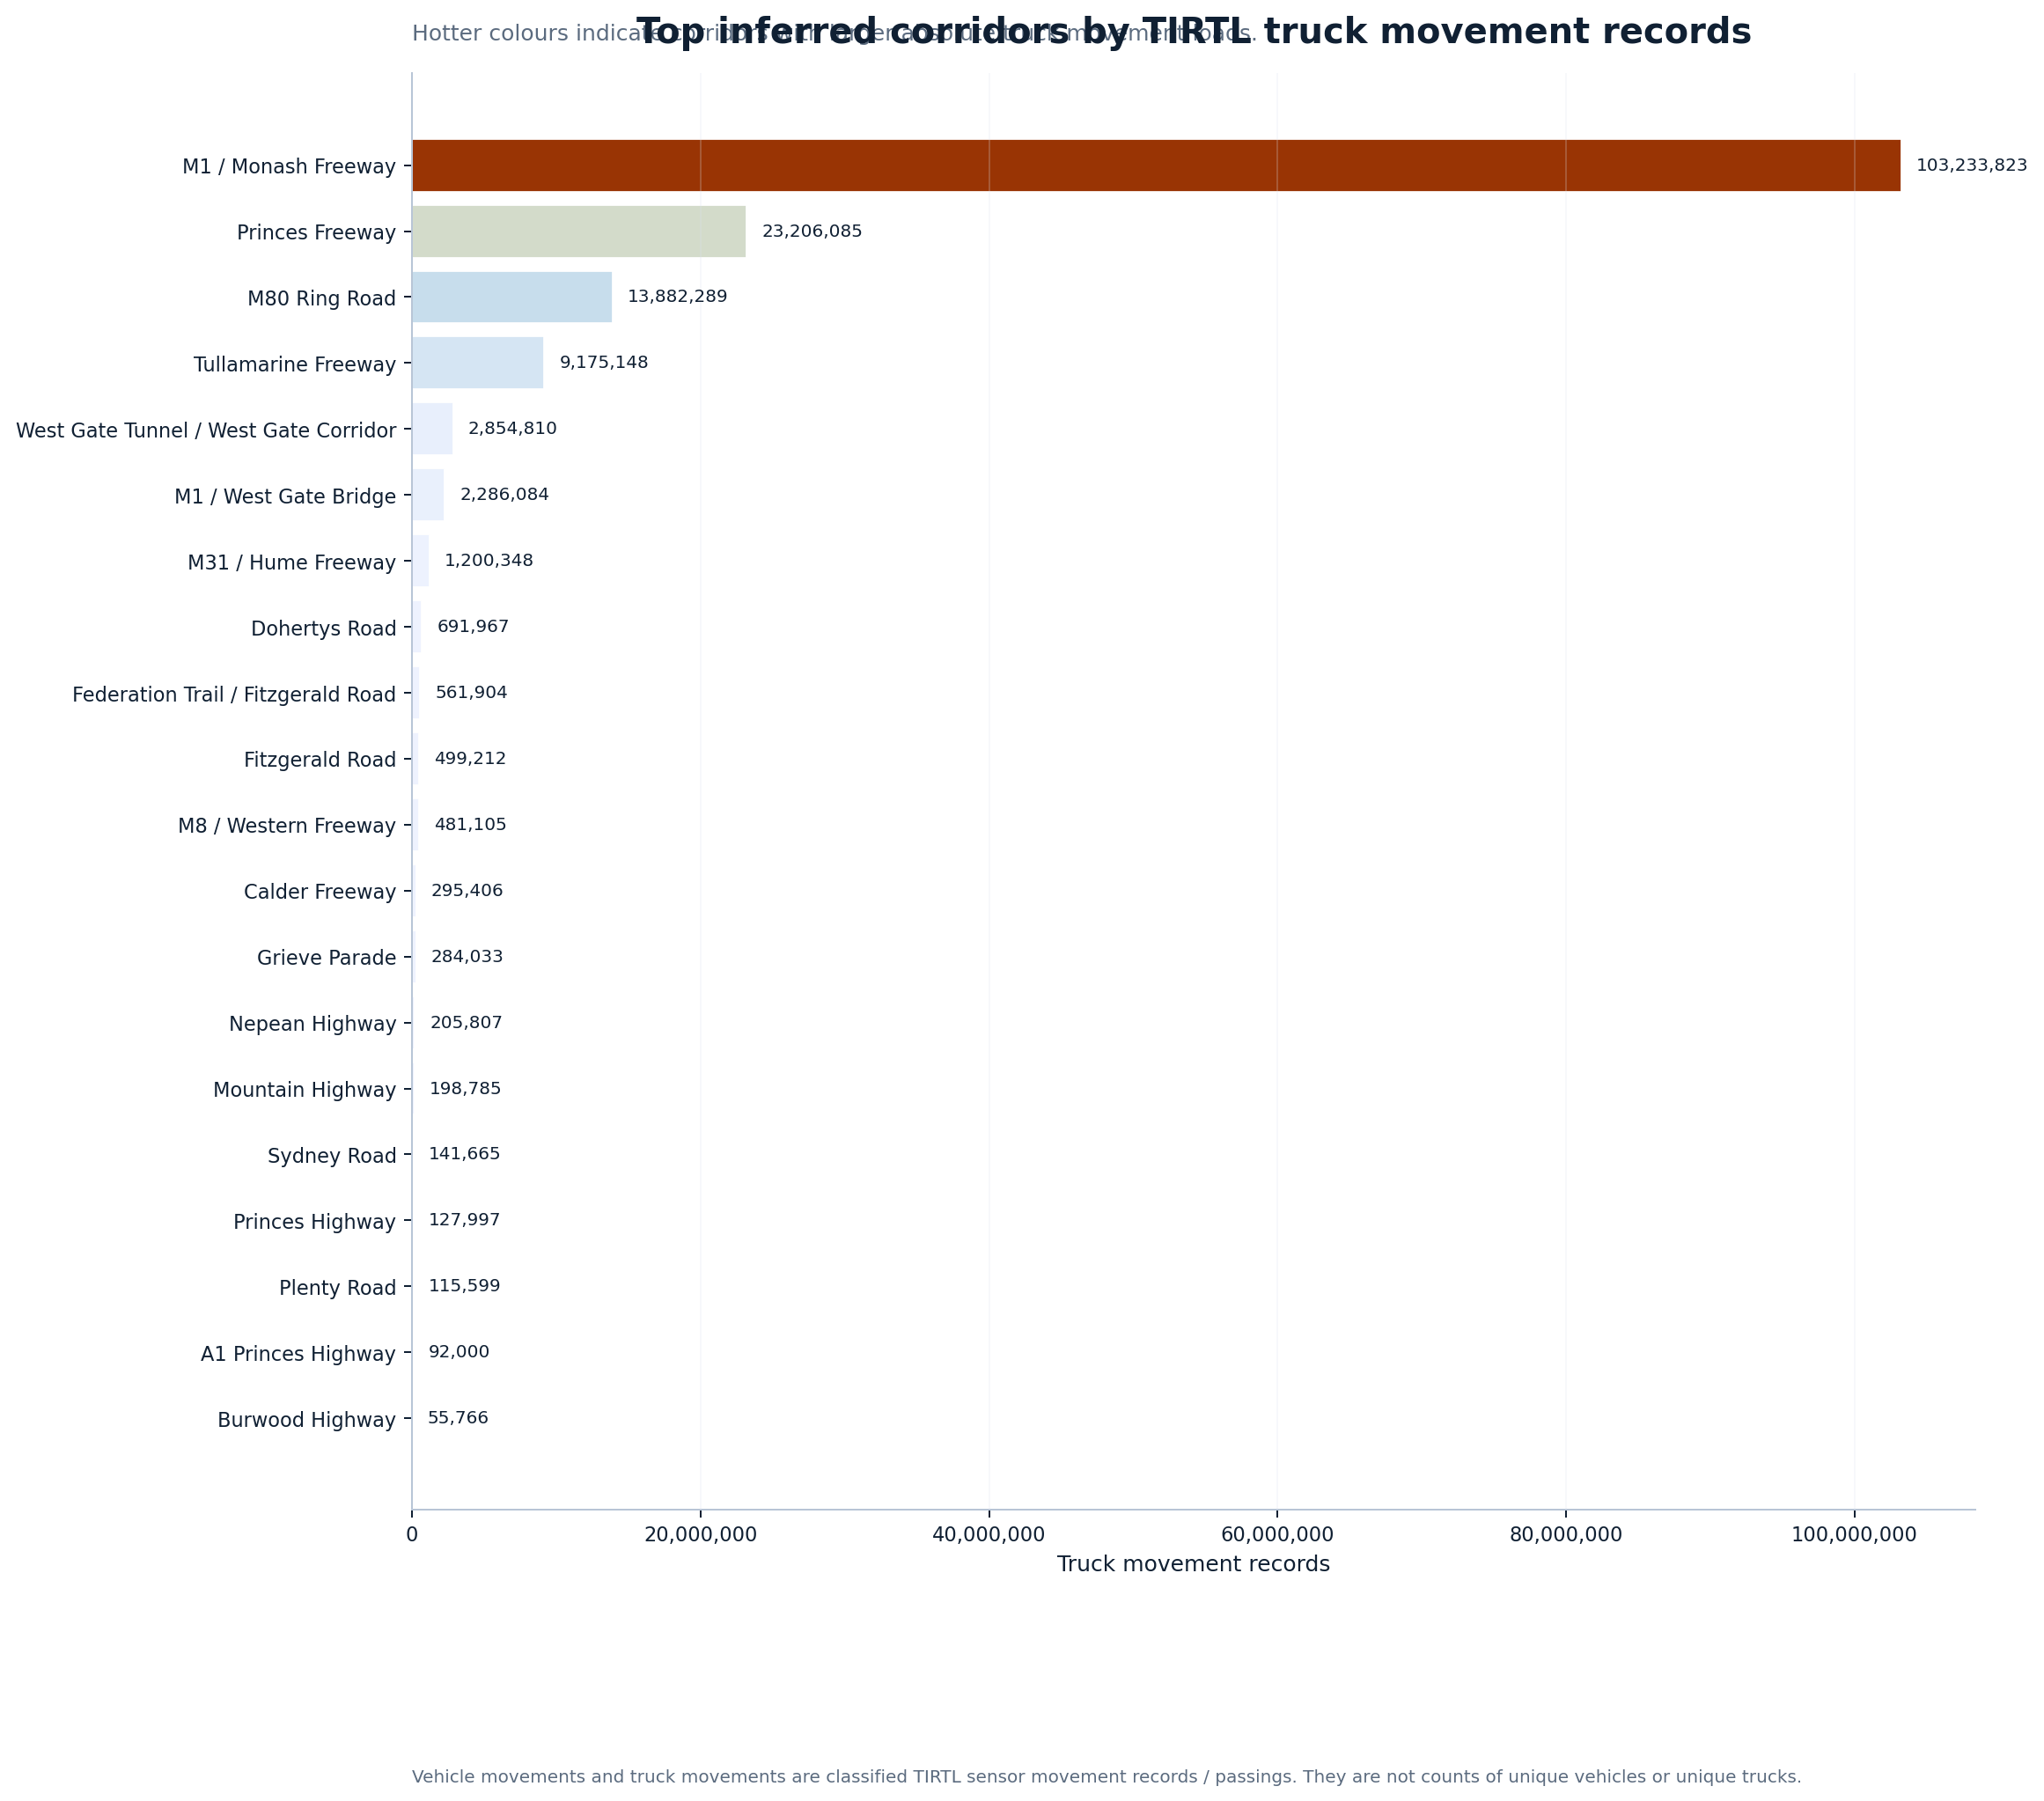
M1 / Monash Freeway carries enormous absolute truck movement volume
Possible headline: “Melbourne’s freeway freight spine hidden in plain sight.”
Why it matters: This story explains why absolute truck movement matters. A road can have a moderate truck percentage but still carry a huge number of truck movement records because total traffic volume is so large.
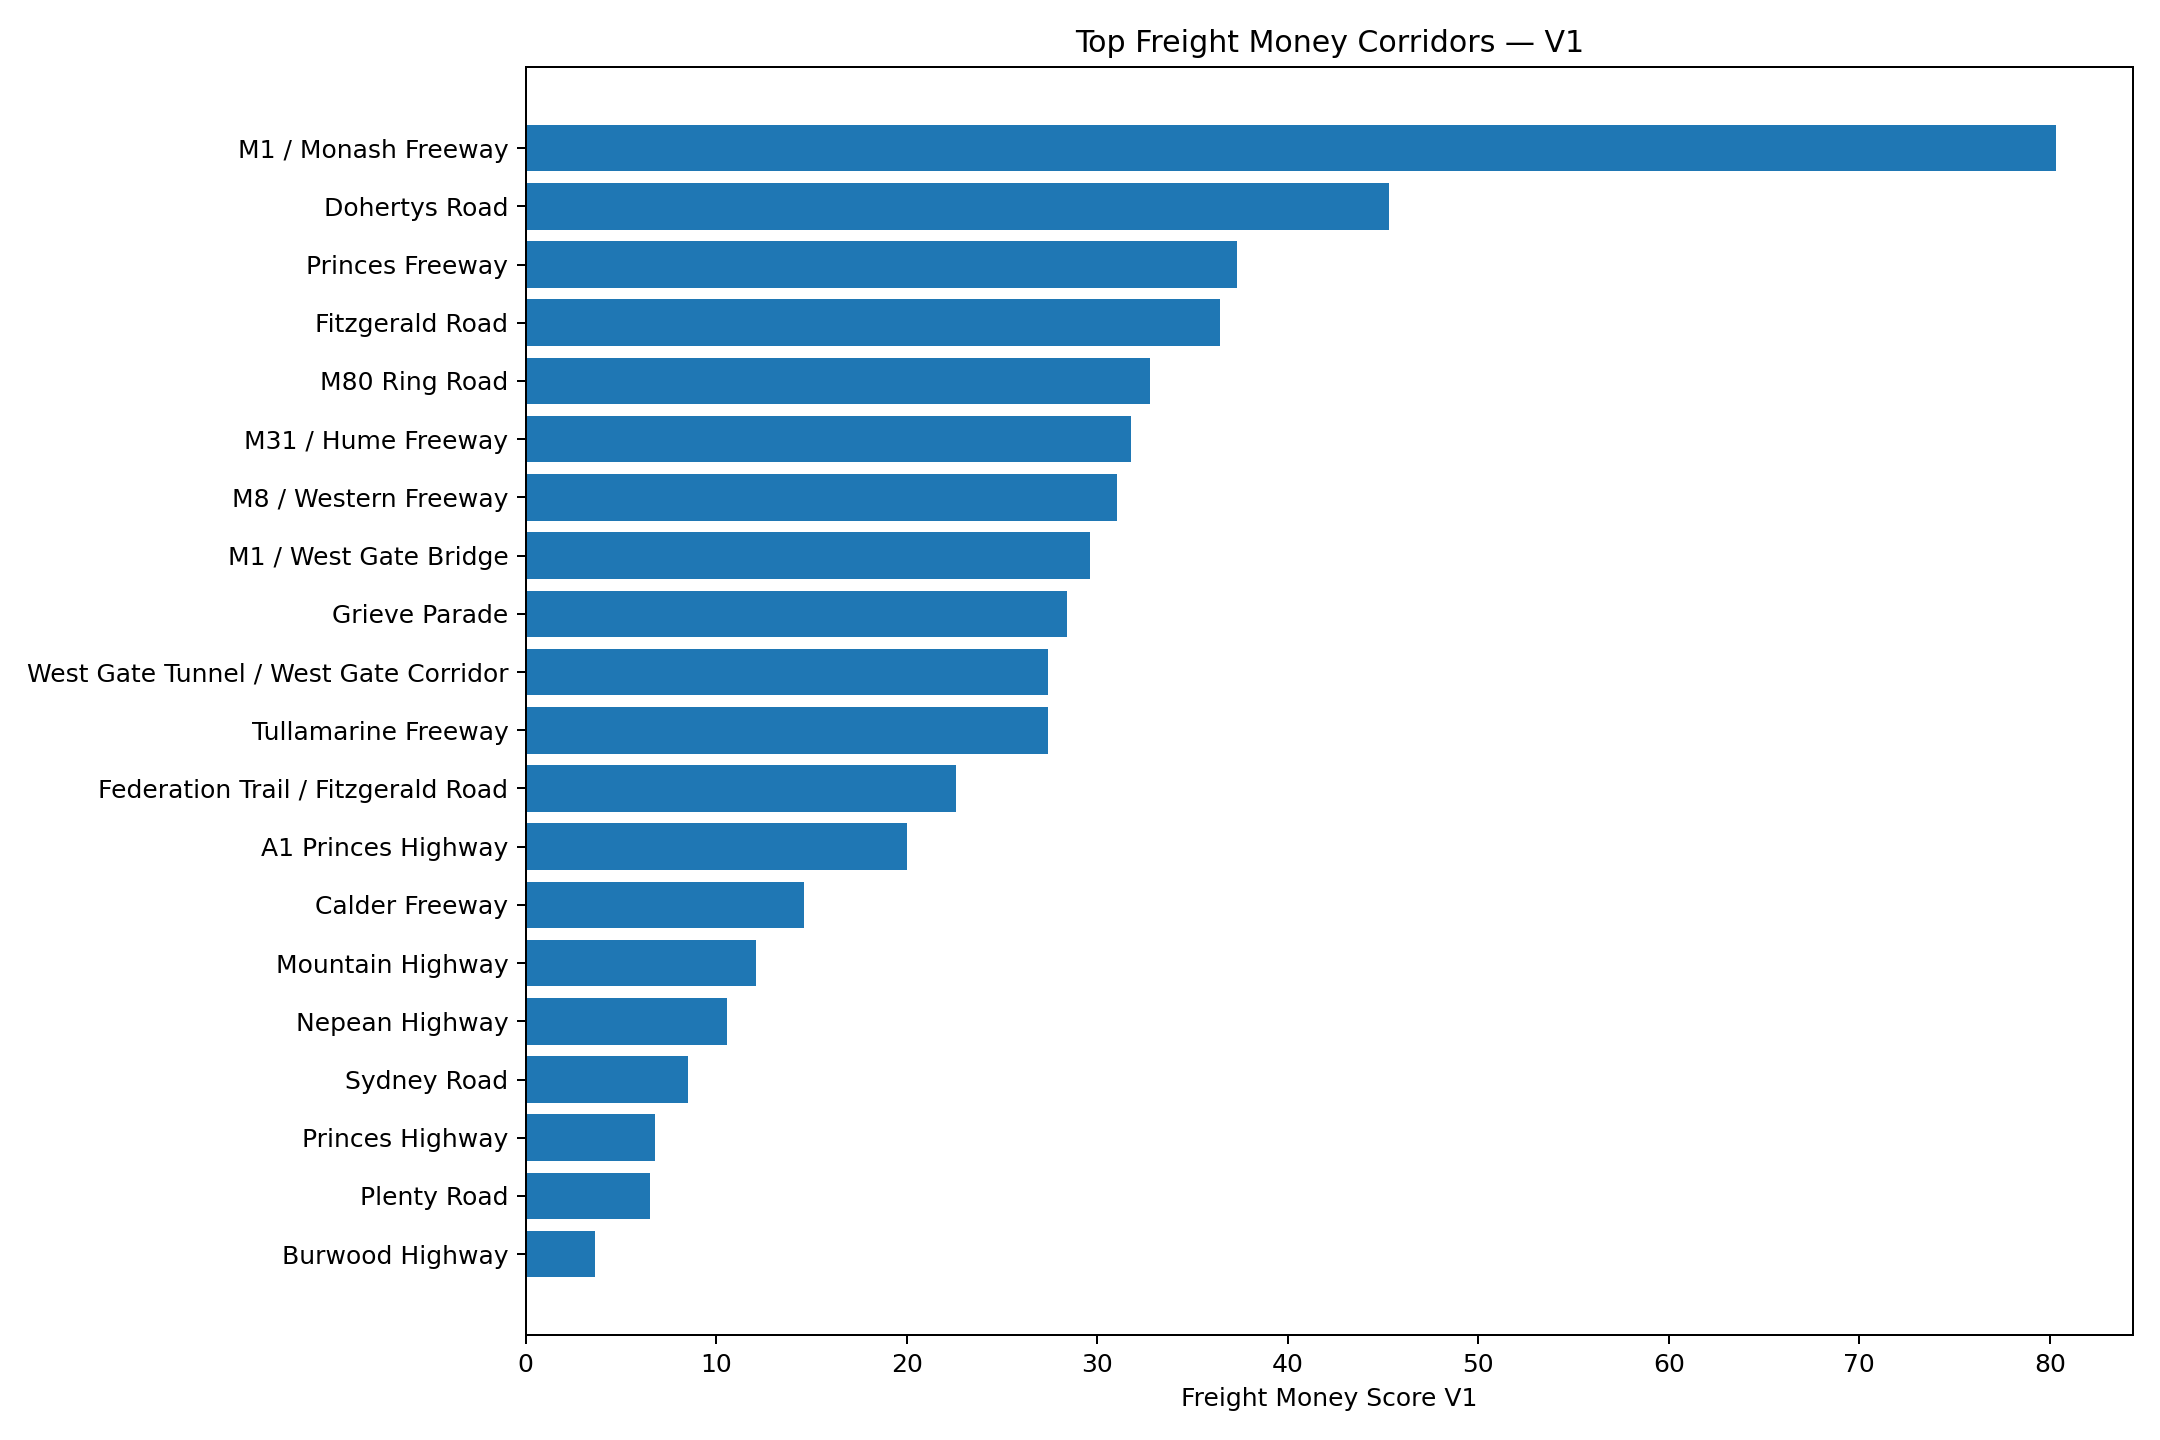
Evidence / page hook: The M1 / Monash Freeway appears as a major high-volume truck corridor in the TIRTL freight corridor outputs and ranks highly in the Freight Money Map V1.
#3Bridge dependencyTV / radio / commuters
West Gate Bridge remains a key truck and freight exposure point
Possible headline: “The bridge where commuter pressure and freight pressure collide.”
Why it matters: The West Gate Bridge is instantly understandable to the public. Truck movement here is not just a freight story; it is a commuter, port, western suburbs and economic resilience story.
Evidence / page hook: M1 West Gate Bridge Outbound is identified in the TIRTL page as the top truck movement site, with 1,279,880 truck movement records and 7.50% truck share.
#4Suburb freight pressureLocal / council
Mulgrave ranks as a leading suburb/locality for truck movement records
Possible headline: “The Melbourne suburb carrying one of the city’s biggest truck movement loads.”
Why it matters: Suburb-level freight intelligence makes the data local and usable. It lets journalists, councils and businesses move from abstract truck counts to place-based stories.
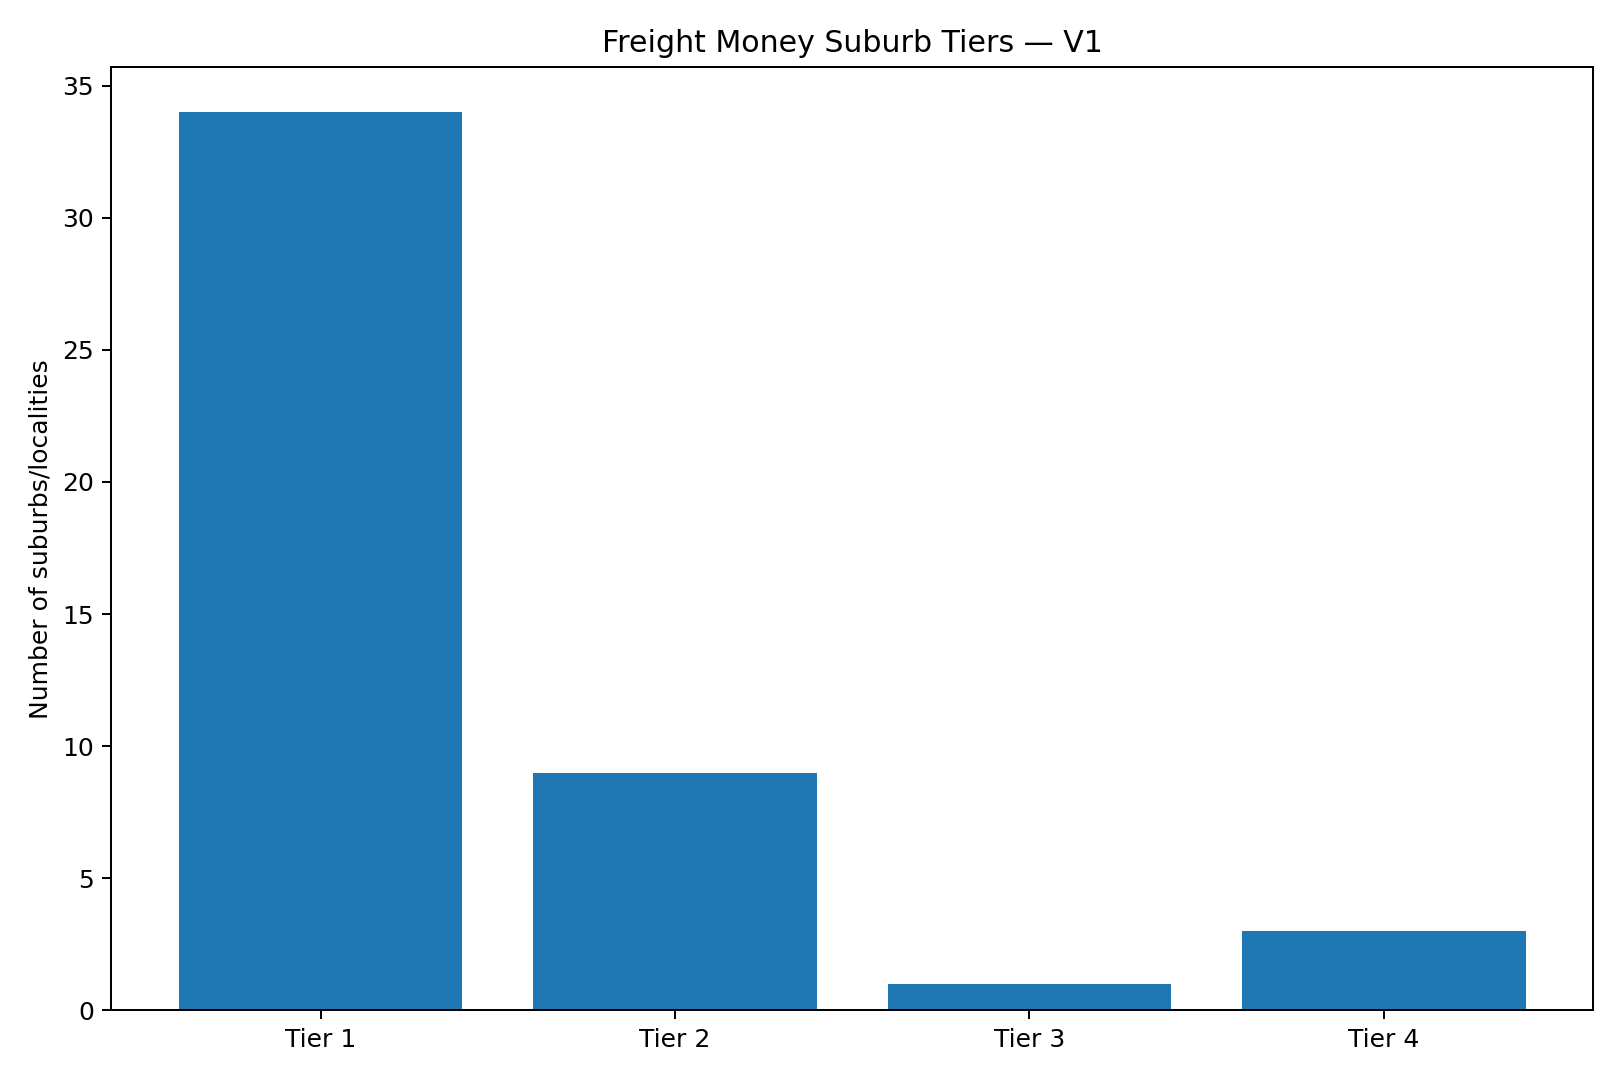
Evidence / page hook: The TIRTL page identifies Mulgrave as the top suburb/locality by truck movement records, and the Freight Money Suburb Index V1 ranks Mulgrave first.
#5Industrial roadsBusiness / local
Altona North and Laverton North show the commercial value of truck-share intelligence
Possible headline: “The west’s industrial freight roads show why truck share matters.”
Why it matters: This angle helps explain that freight roads are not always the roads with the most total traffic. High truck share can reveal industrial road function and support-service demand.
Evidence / page hook: Dohertys Road and Fitzgerald Road appear as high freight-dependence industrial corridor examples in the TIRTL freight corridor ranking.
#6Data transparencyGovernment accountability
Public TIRTL data can become a freight intelligence product
Possible headline: “From sensor records to freight intelligence: what public data can reveal.”
Why it matters: This is a meta-story about open data. The value is not just the dataset; it is turning hard-to-read technical records into maps, rankings, suburbs, caveats and commercial interpretation.
Evidence / page hook: The page converts TIRTL movement records into headline metrics, maps, suburb summaries, freight corridor rankings, charts, downloads and interpretation notes.
#7Commercial freightTransport companies
Freight Money Map links truck movement to fuel, time and dead-kilometre decisions
Possible headline: “The map showing where freight operators may lose time and money.”
Why it matters: This angle is highly practical for industry. Transport operators care about fuel, driver hours, pricing risk, depot location and dead kilometres, not just road volumes.
Evidence / page hook: The Freight Money Map V1 ranks corridors and suburbs using truck movement, truck share, freight score, coverage and SCATS-style pressure proxy signals.
#8SCATS + TIRTLData / transport
SCATS and TIRTL together can separate commuter traffic from freight pressure
Possible headline: “Why Melbourne needs both traffic volume and truck movement intelligence.”
Why it matters: This is one of the most important explanatory angles. SCATS shows total traffic pressure. TIRTL shows truck/freight pressure. Together they can distinguish busy commuter corridors from freight-dependent roads.
Evidence / page hook: The current page explicitly frames TIRTL as the truck/freight counterpart to the SCATS traffic intelligence platform.
#9Suburb business opportunitySmall business / property
Truck-heavy suburbs may reveal depot, trailer hire and service-business opportunities
Possible headline: “Where Melbourne’s truck movement could point to new business opportunities.”
Why it matters: This turns freight data into opportunity intelligence for mechanics, tyre shops, trailer hire, parking, wash bays, yard operators and industrial property observers.
Evidence / page hook: The Freight Money Suburb Index V1 ranks 47 suburbs/localities for commercial freight signal, including depot, yard, service and dead-kilometre opportunity framing.
#10Responsible interpretationEditors / officials
The key caveat: movement records are not unique trucks
Possible headline: “How to read truck movement data without overstating it.”
Why it matters: This protects credibility. A responsible page should repeatedly explain that TIRTL records are sensor passings or movement records, not unique vehicles.
Evidence / page hook: The TIRTL page states that vehicle movements and truck movements are classified TIRTL sensor movement records / passings, not counts of unique vehicles or unique trucks.
How a journalist could use this section
This section is designed as a story-discovery index. A journalist can start with one angle,
jump to the relevant table/map/chart, then use the methodology and caveat sections to explain the data responsibly.
Transport reporters: freight corridors, bridge dependency and truck-pressure hotspots.
Local reporters: suburb-level truck pressure and industrial road impacts.
Business reporters: freight cost pressure, depot opportunity and truck-service demand.
Data journalists: SCATS + TIRTL integration, public data reuse and reproducibility.
Maps
TIRTL truck movement and freight corridor maps
These map products turn the TIRTL truck movement layer into public-facing spatial intelligence:
a site-heading truck movement dashboard and a Version 1 freight corridor line map.
Important terminology:
Vehicle movements and truck movements are classified TIRTL sensor movement records / passings. They are not counts of unique vehicles or unique trucks.
Freight corridor map note:
The freight corridor map is a Version 1 monitored-corridor approximation. It connects measured TIRTL site-heading locations into inferred corridor lines. It is not yet a road-centreline-snapped engineering map.
562
Truck map records
Site-heading records in the TIRTL map layer.
47
Suburbs / localities
Vicmap locality names represented in the TIRTL map layer.
21
Inferred freight corridors
Version 1 monitored-corridor groupings.
21
Corridor line features
GeoJSON line features generated from measured TIRTL points.
Open the interactive maps
These are best opened as full-page maps rather than embedded directly, to keep the main intelligence page fast and stable.
The next major improvement is road-centreline snapping: matching TIRTL site-heading records to a proper road centreline layer,
then styling actual road segments rather than inferred point-to-point corridor lines.
Interactive Freight Corridor Map
Embedded Melbourne freight corridor map
This embedded map shows the Version 1 TIRTL-based freight corridor layer directly inside the main TIRTL intelligence page.
It is isolated in its own iframe so the Leaflet freight map cannot collide with the Google Maps truck dashboard.
Important terminology:
Vehicle movements and truck movements are classified TIRTL sensor movement records / passings. They are not counts of unique vehicles or unique trucks.
Self-contained map note:
This freight corridor map is embedded using iframe srcdoc, so it does not require
freight_corridors/melbourne-freight-corridor-map.html to exist beside this page.
The separate full-screen link below will only work on the live site if that companion file also exists.
This embedded dashboard shows the Melbourne-wide TIRTL truck movement map,
truck-share legend, top truck movement sites, suburb/locality context,
direct Google Maps links and Street View links.
Important terminology:
Vehicle movements and truck movements are classified TIRTL sensor movement records / passings. They are not counts of unique vehicles or unique trucks.
Map loading note:
The interactive truck dashboard is loaded as a separate HTML file so the Google Maps API runs in a normal page context.
For this iframe to work, melbourne-tirtl-truck-intelligence.html must sit in the same folder as this main page on the live site.
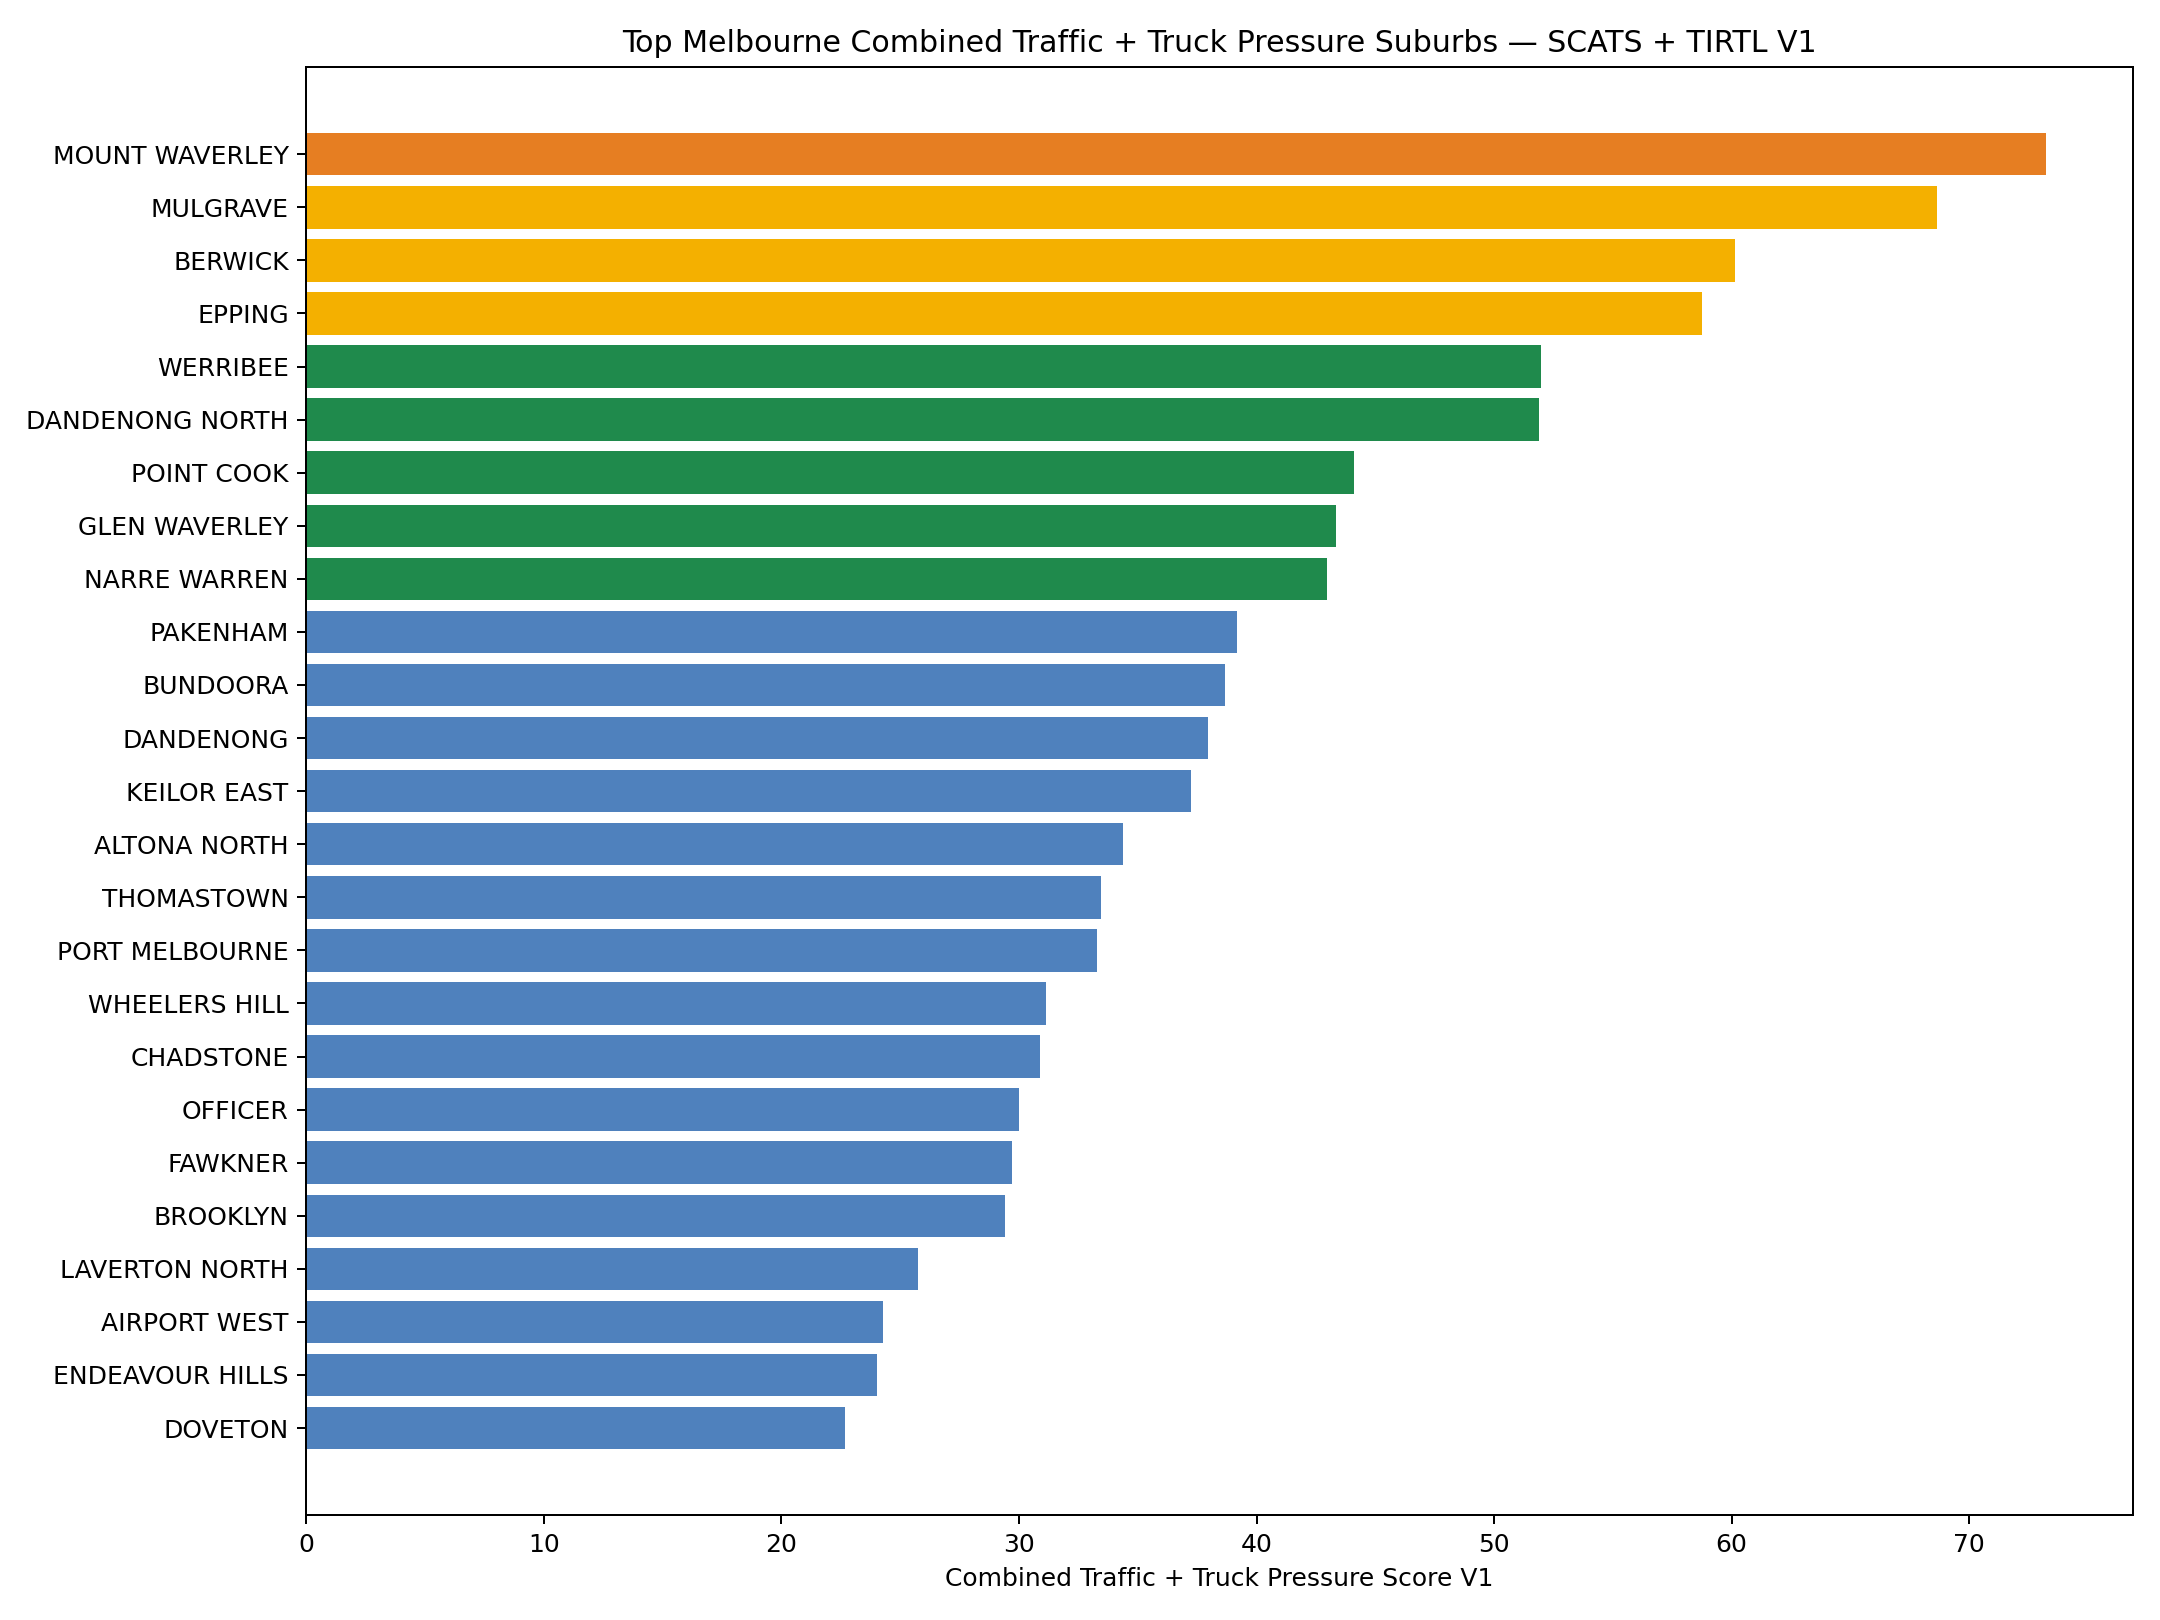
This index combines SCATS suburb-level traffic pressure with TIRTL truck/heavy-vehicle movement records
to identify where general traffic pressure and freight exposure overlap across Melbourne suburbs/localities.
SCATS helps show total traffic pressure. TIRTL helps show truck and freight pressure.
Together, they reveal suburbs where commuter movement, commercial road use and heavy-vehicle exposure may collide.
🚦 SCATS total traffic pressure🚚 TIRTL truck/heavy-vehicle pressure🏙️ suburb/locality intelligence📰 journalist-ready story angles💲 commercial freight context
How to read this index
The Freight Pressure Score is a relative V1 index, not an official government ranking.
It combines available SCATS traffic pressure with TIRTL truck movement volume, truck share and monitored coverage.
TIRTL records are movement records/passings, not unique vehicles.
Red: extreme combined pressureOrange: very high pressureGold: high pressureGreen: moderate pressureBlue: lower pressure
Important SCATS + TIRTL Interpretation Caveat
This combined Freight Pressure Index joins datasets with different time windows and measurement methods.
The SCATS component reflects long-term signalised traffic-volume history across the broader Melbourne SCATS dataset,
while the TIRTL component reflects a much shorter recent truck/heavy-vehicle movement window, currently approximately
November 2025 to May 2026.
This means the index should be read as a hybrid measure of long-term traffic pressure and recent
truck/heavy-vehicle pressure, not as a like-for-like 12-year truck movement history.
SCATS time window:
Long-term traffic context, based on the broader SCATS signalised traffic dataset.
TIRTL time window:
Recent truck/heavy-vehicle movement snapshot, currently approximately November 2025 to May 2026.
SCATS coverage:
Best interpreted as signalised-road-network traffic pressure, not every freeway, private road or unsignalised freight movement.
TIRTL classification:
Truck/heavy-vehicle figures are classified movement records or sensor passings, not unique trucks.
Some buses, coaches or other non-freight heavy vehicles may be included depending on vehicle-class grouping,
location and classification conditions. The Freight Pressure Score is a relative analytical index for story discovery,
commercial context and suburb comparison. It is not an official road authority ranking, not a precise congestion-cost
estimate and not a perfect measure of freight-only activity.
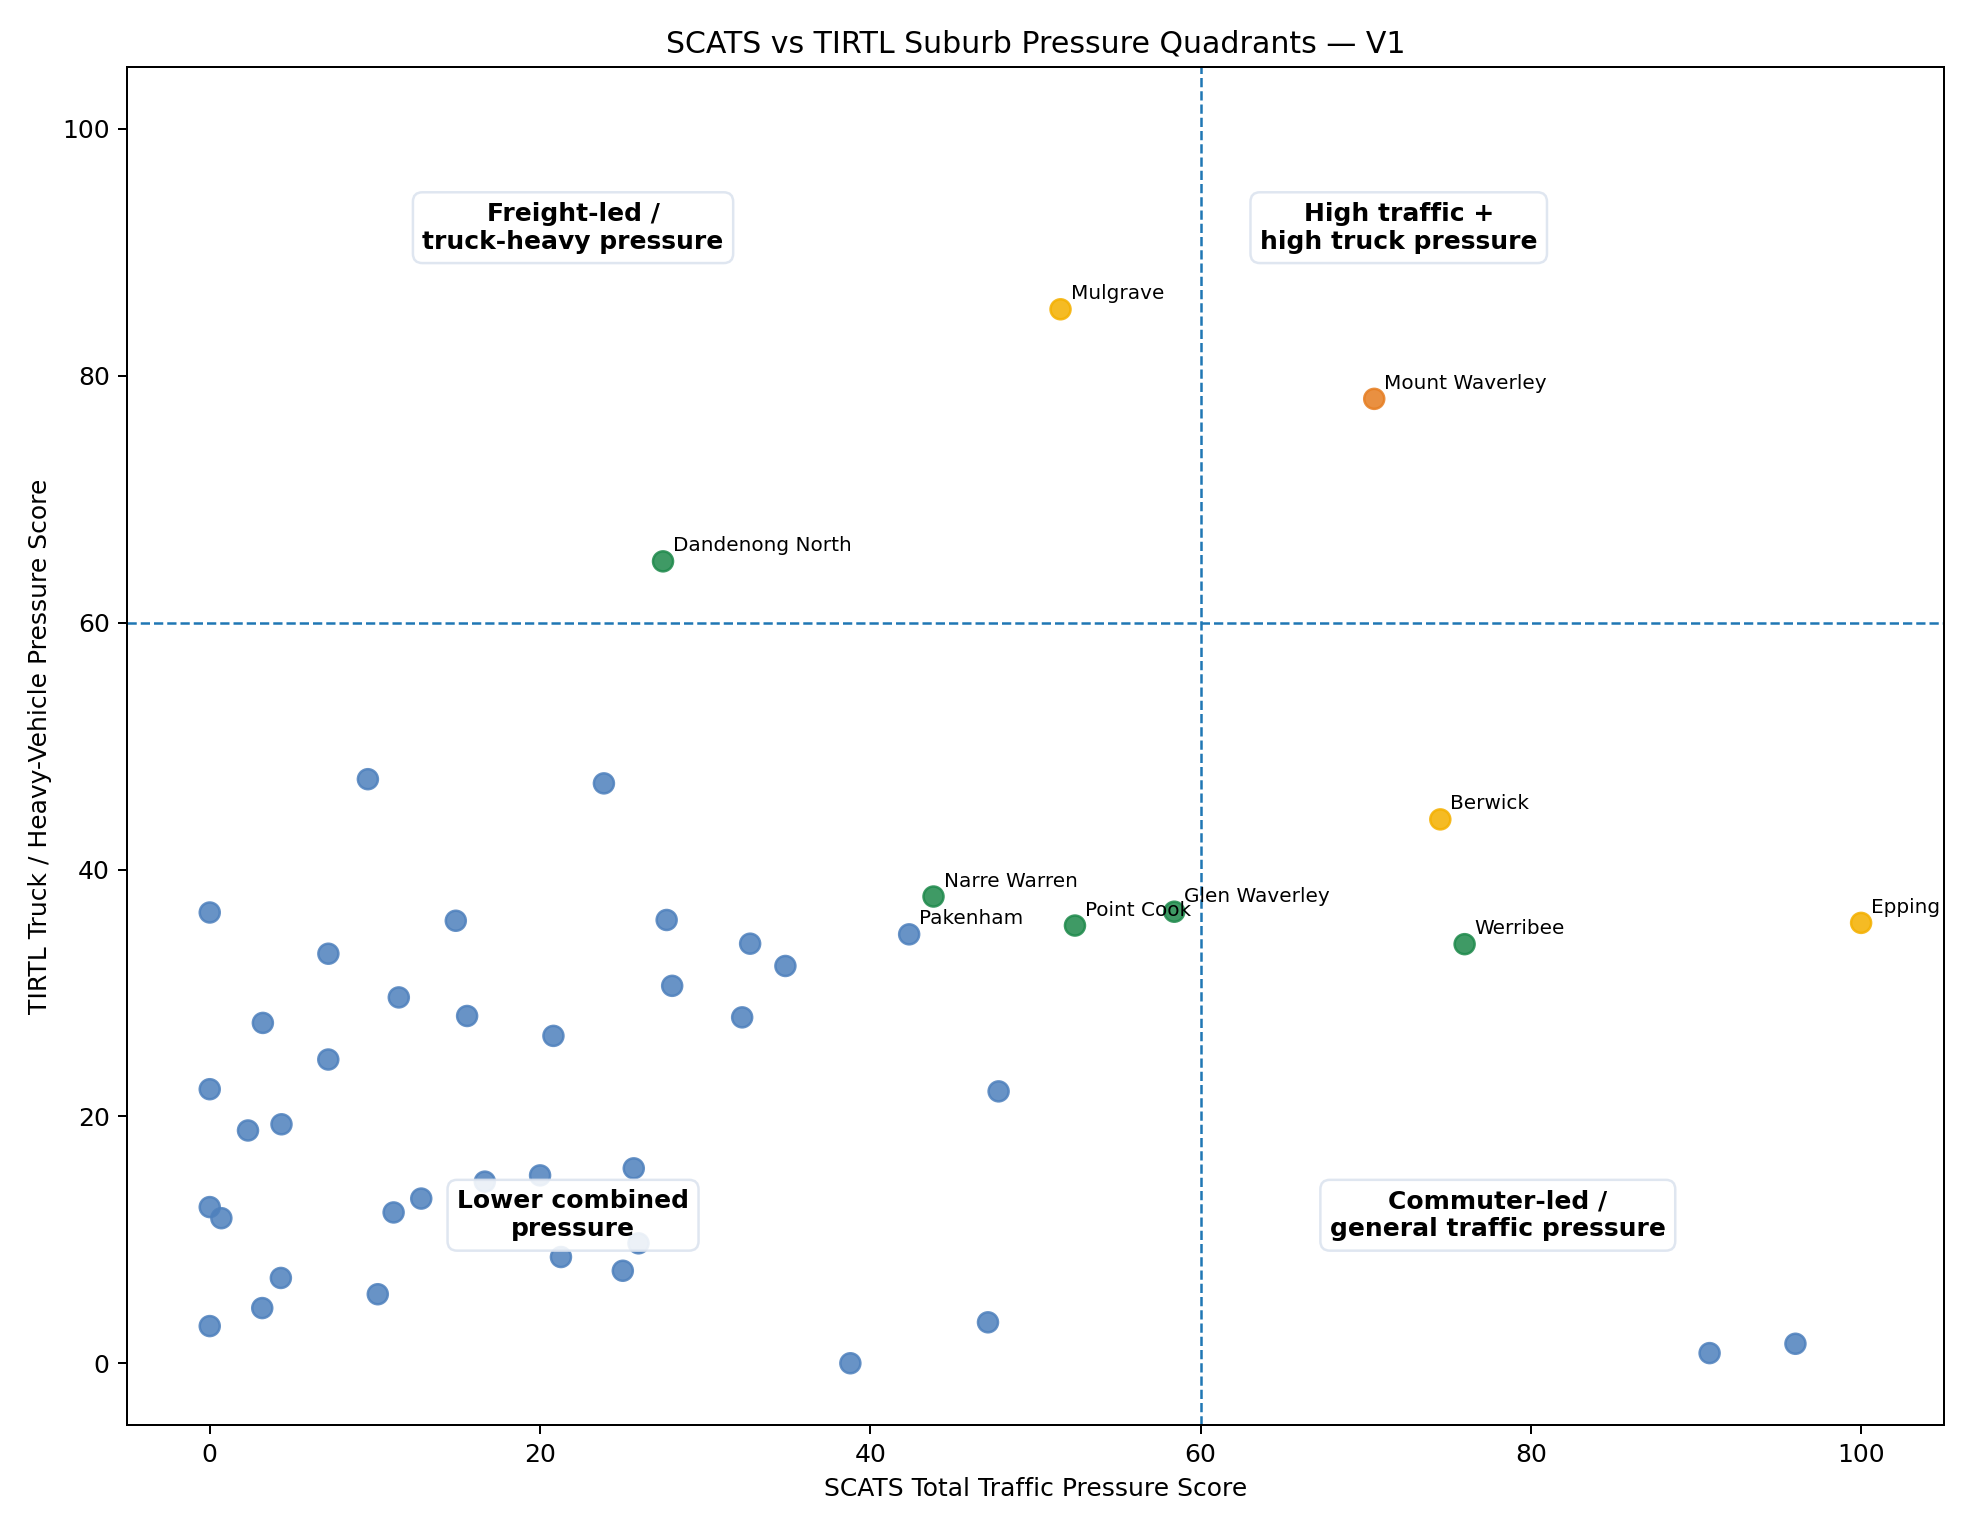
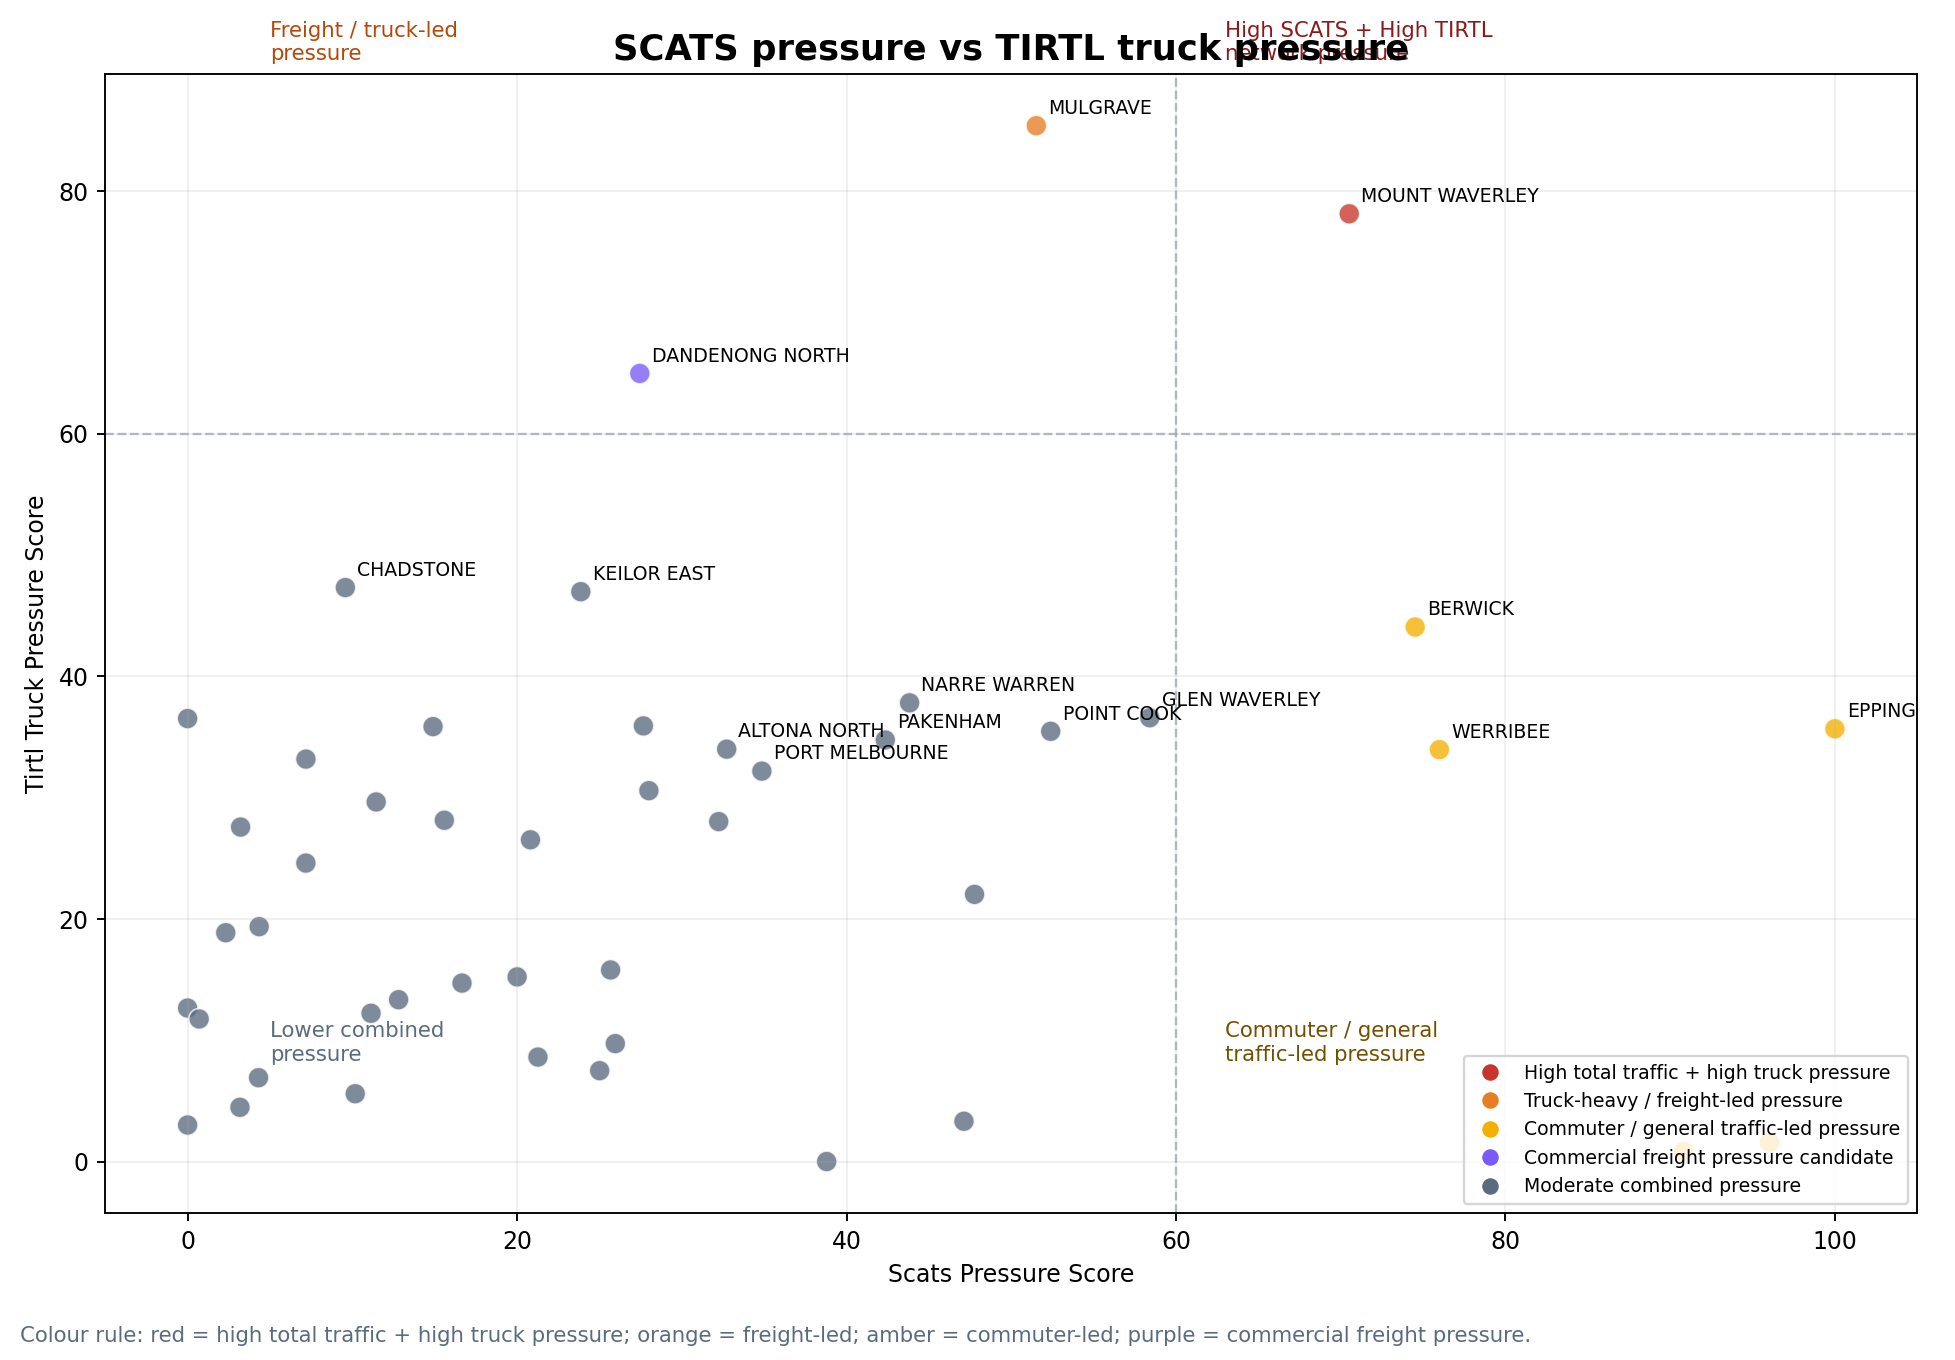
High traffic + high truck pressure
Suburbs where general traffic pressure and truck/heavy-vehicle movement both stand out.
Truck-heavy / freight-led pressure
Suburbs where the freight/heavy-vehicle signal is stronger than the general traffic signal.
Commuter-led pressure
Suburbs where SCATS-style total traffic pressure stands out more than TIRTL truck pressure.
Media and commercial use
Use this as a lead-generation file for local stories, route questions, depot planning and freight exposure analysis.
Top Melbourne Freight Pressure Suburbs — V1
Rank
Suburb / Locality
Freight Pressure Score
Pressure Label
Traffic vs Freight Balance
SCATS Movements
TIRTL Truck Movements
TIRTL Truck %
Story Hook
1
MOUNT WAVERLEY
73.23
Very high combined pressure
High total traffic + high truck pressure
382,225,168
16,215,466
6.52%
MOUNT WAVERLEY appears as a combined pressure suburb where general traffic and truck/heavy-vehicle exposure overlap.
2
MULGRAVE
68.64
High combined pressure
Truck-heavy / freight-led pressure
279,258,019
18,308,122
6.47%
MULGRAVE appears more freight-led than commuter-led, with truck/heavy-vehicle pressure standing out against total traffic context.
3
BERWICK
60.15
High combined pressure
General traffic / commuter-led pressure
403,914,281
8,650,475
4.53%
BERWICK appears more commuter/general-traffic pressured than freight-led in the current combined index.
4
EPPING
58.76
High combined pressure
High total traffic + high truck pressure
542,036,106
1,200,348
9.60%
EPPING appears as a combined pressure suburb where general traffic and truck/heavy-vehicle exposure overlap.
5
WERRIBEE
51.97
Moderate combined pressure
General traffic / commuter-led pressure
411,893,530
4,896,871
5.44%
WERRIBEE appears more commuter/general-traffic pressured than freight-led in the current combined index.
6
DANDENONG NORTH
51.89
Moderate combined pressure
Truck-heavy / freight-led pressure
148,784,621
13,895,561
5.16%
DANDENONG NORTH appears more freight-led than commuter-led, with truck/heavy-vehicle pressure standing out against total traffic context.
7
POINT COOK
44.09
Moderate combined pressure
Lower combined traffic and freight pressure
283,994,910
6,284,582
4.48%
POINT COOK is lower priority in the current combined freight pressure index.
8
GLEN WAVERLEY
43.35
Moderate combined pressure
Lower combined traffic and freight pressure
316,595,328
4,525,206
6.55%
GLEN WAVERLEY is lower priority in the current combined freight pressure index.
9
NARRE WARREN
42.97
Moderate combined pressure
Lower combined traffic and freight pressure
237,567,205
7,555,471
3.88%
NARRE WARREN is lower priority in the current combined freight pressure index.
10
PAKENHAM
39.17
Lower combined pressure
Lower combined traffic and freight pressure
229,570,575
4,037,380
6.52%
PAKENHAM is lower priority in the current combined freight pressure index.
11
BUNDOORA
38.69
Lower combined pressure
General traffic / commuter-led pressure
520,482,695
115,599
1.16%
BUNDOORA appears more commuter/general-traffic pressured than freight-led in the current combined index.
12
DANDENONG
37.96
Lower combined pressure
General traffic / commuter-led pressure
492,308,877
52,905
1.01%
DANDENONG appears more commuter/general-traffic pressured than freight-led in the current combined index.
V1 methodology note:
This is a relative analytical index designed for story discovery and commercial context.
It should not be read as an official road authority ranking or exact congestion/freight cost estimate.
SCATS counts total signalised traffic movement. TIRTL contributes truck/heavy-vehicle movement records.
TIRTL movement records are sensor passings, not unique trucks.
Where Melbourne Traffic and Truck Pressure Collide — SCATS + TIRTL Map
This interactive Google Map turns the SCATS vs TIRTL pressure quadrant into geography.
Each suburb/locality marker is coloured by whether it is high traffic + high truck pressure,
freight-led, commuter-led, or lower combined pressure.
The map lets journalists, transport managers, commuters and planners see where Melbourne’s
general traffic pressure and truck/heavy-vehicle exposure overlap.
Map caveat:
This is a suburb/locality marker map, not an official road authority map.
Marker colour comes from the SCATS + TIRTL pressure quadrant classification.
Marker size is log-scaled by TIRTL truck/heavy-vehicle movement records.
SCATS provides long-term signalised traffic pressure, while TIRTL provides a recent truck/heavy-vehicle movement snapshot.
TIRTL records are sensor passings/movement records, not unique trucks.
Missing coordinate rows: 1.
SCATS + TIRTL Operational Freight Intelligence
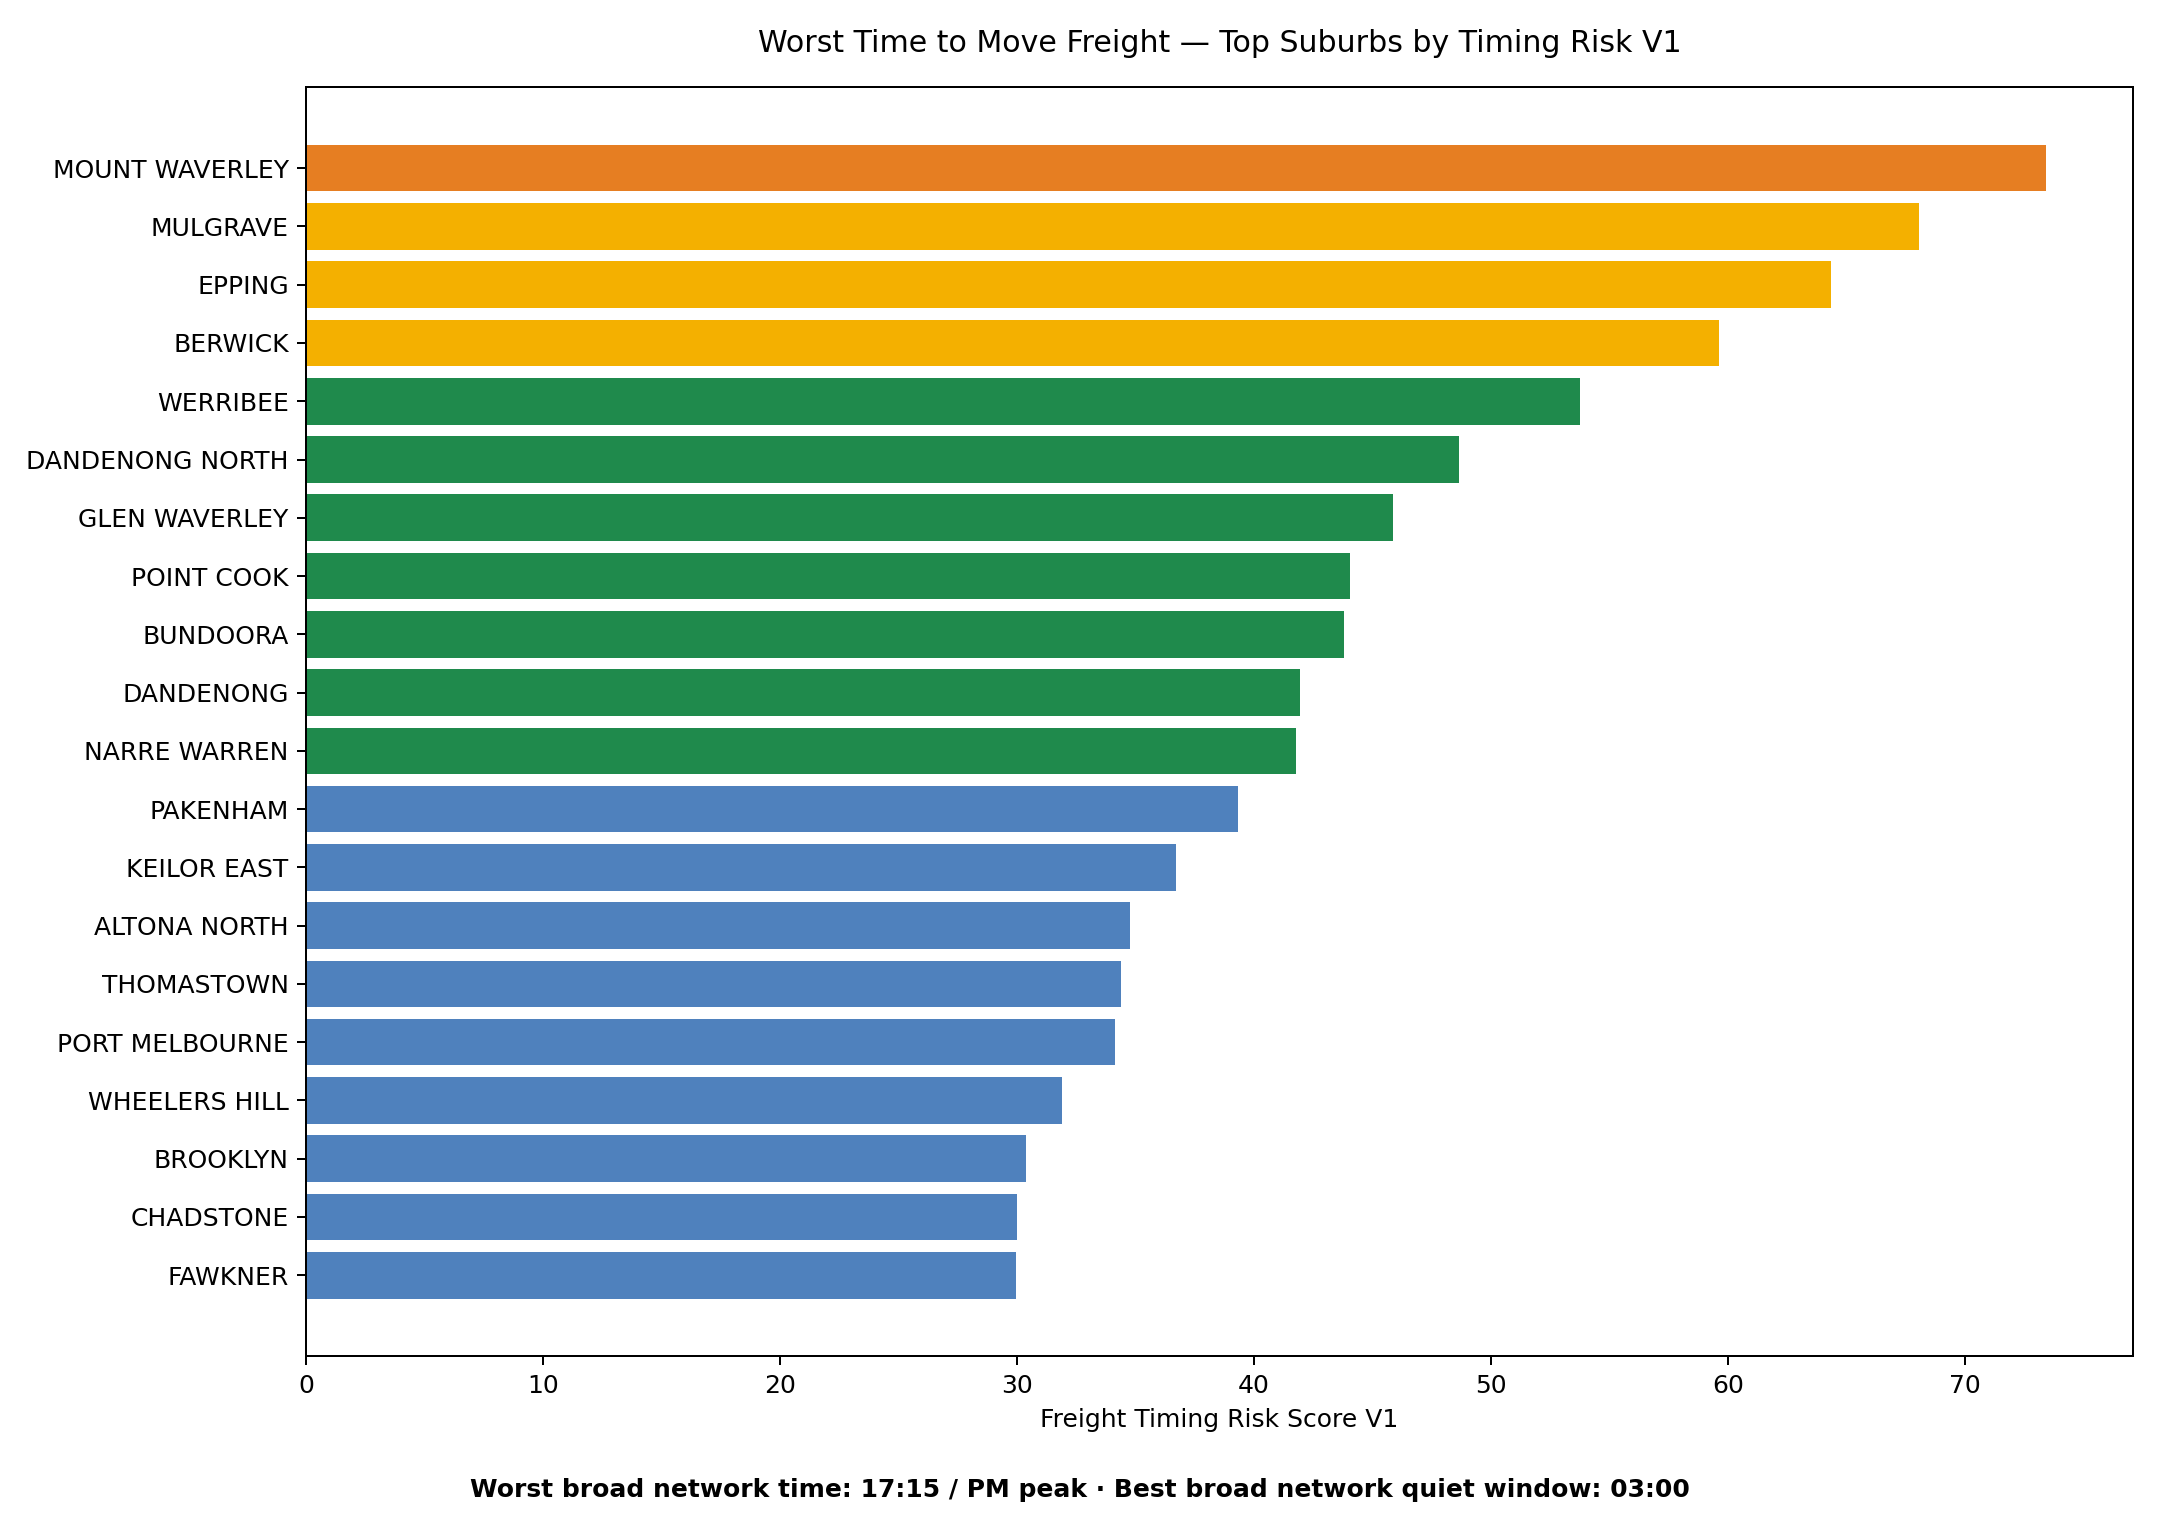
Worst Time to Move Freight by Suburb / Corridor
This section combines SCATS time-of-day traffic pressure with TIRTL truck/heavy-vehicle and freight exposure
to estimate where and when moving freight is likely to be most operationally expensive.
It is designed for transport operators, dispatchers, depot planners, journalists, commuters and freight-adjacent businesses
who need to understand timing risk, not just where trucks move.
Worst broad network time for freight-exposed movement
17:15
The V1 model treats PM peak around 17:15 as the highest-risk general traffic window
for freight-exposed movement.
Best broad network time to avoid traffic and trucks
03:00
The quietest broad road-network window is generally overnight / very early morning around 03:00,
subject to curfews, safety, fatigue rules and access restrictions.
Important V1 caveat:
Timing risk is primarily derived from SCATS time-of-day traffic pressure, while TIRTL supplies truck/heavy-vehicle
and freight exposure context. Unless time-binned TIRTL truck data is added later, this should be read as
“worst general traffic windows for freight-exposed suburbs/corridors,” not as direct observation of the worst
truck-only time window. TIRTL records are sensor movement records/passings, not unique trucks.
SCATS time source:
Loaded row-level SCATS time-bin profile from
time_bin_profile.csv
using time field time_bin and volume field month_time_bin_volume.
Suburb timing risk
Identifies suburbs where combined traffic and truck exposure make peak-period freight movement riskier.
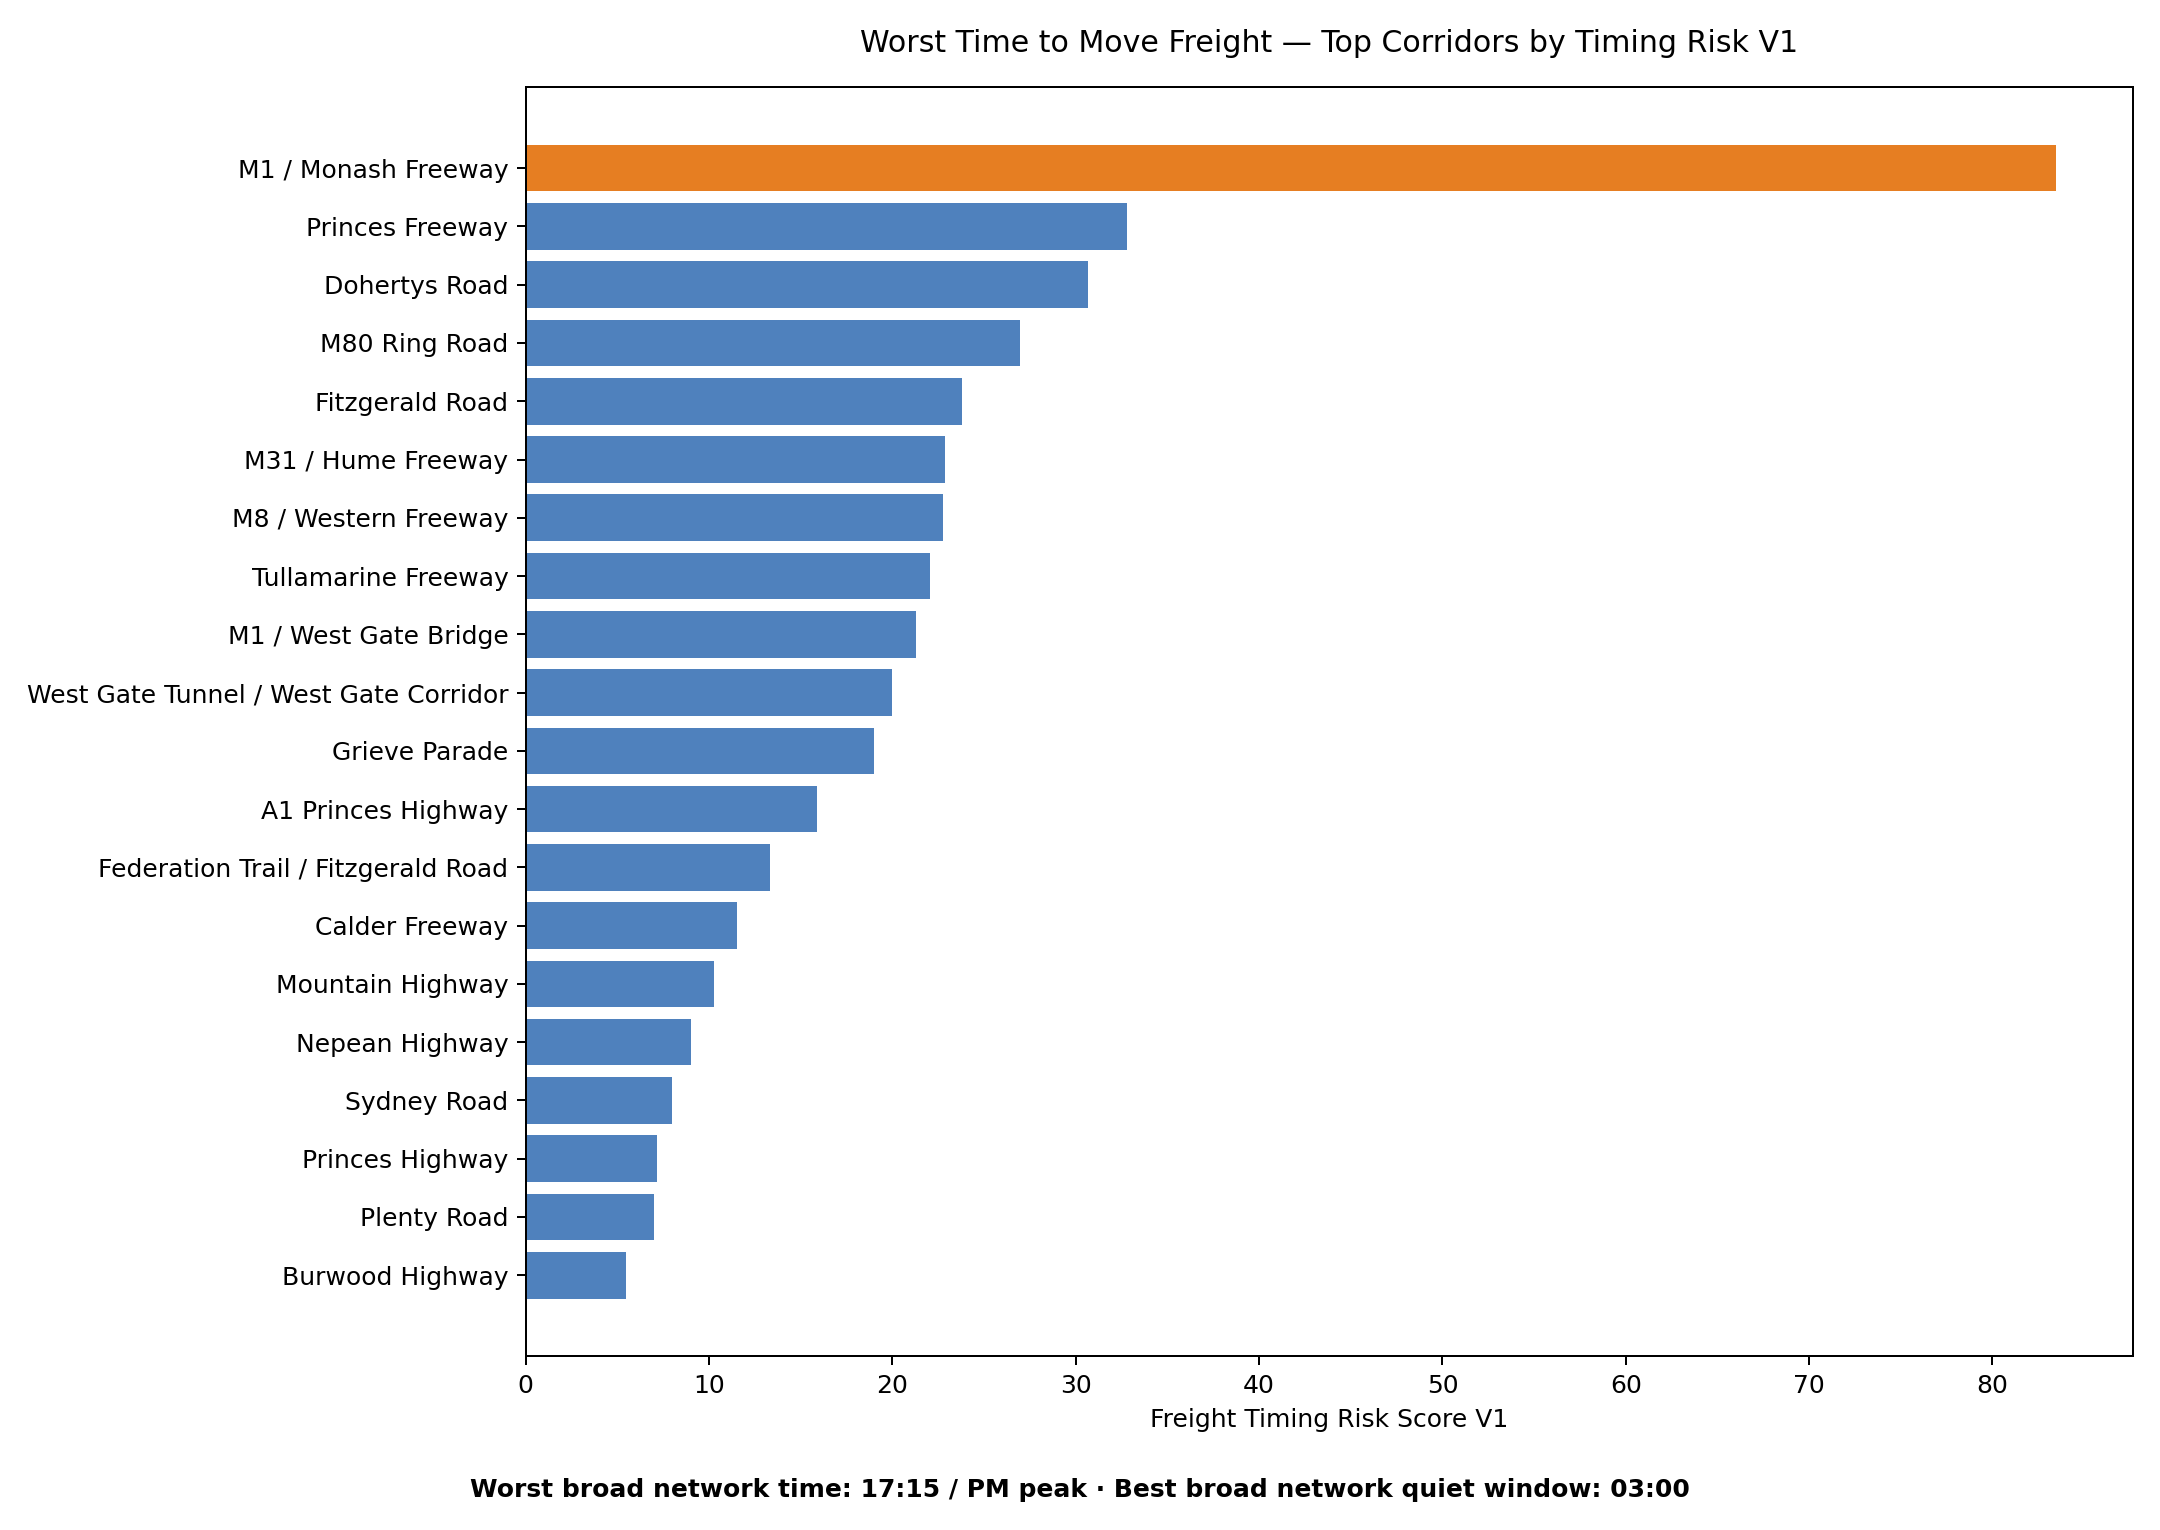
Corridor timing risk
Identifies corridors where freight-money pressure and SCATS timing pressure combine into route-pricing risk.
Operator use
Use this to compare delivery windows, customer promises, route pricing, depot timing and driver-hour exposure.
Public use
Use this to understand when leaving home or work is more likely to place you in the highest-pressure truck and traffic mix.
Worst Time to Move Freight — Top Suburbs
Rank
Suburb / Locality
Timing Risk Score
Risk Label
Worst 15-min Bin
Window
Best General Bin
TIRTL Truck Movements
TIRTL Truck %
Operator Guidance
1
MOUNT WAVERLEY
73.41
Very high freight timing risk
17:15
PM peak
03:00
16,215,466
6.52%
MOUNT WAVERLEY: avoid or price carefully around PM peak (17:15 and nearby bins) where possible. For general road-network exposure, overnight / very early morning around 03:00 is likely the lowest-pressure window, subject to curfews, customer delivery windows, fatigue rules and local access restrictions.
2
MULGRAVE
68.03
High freight timing risk
17:15
PM peak
03:00
18,308,122
6.47%
MULGRAVE: avoid or price carefully around PM peak (17:15 and nearby bins) where possible. For general road-network exposure, overnight / very early morning around 03:00 is likely the lowest-pressure window, subject to curfews, customer delivery windows, fatigue rules and local access restrictions.
3
EPPING
64.35
High freight timing risk
17:15
PM peak
03:00
1,200,348
9.60%
EPPING: avoid or price carefully around PM peak (17:15 and nearby bins) where possible. For general road-network exposure, overnight / very early morning around 03:00 is likely the lowest-pressure window, subject to curfews, customer delivery windows, fatigue rules and local access restrictions.
4
BERWICK
59.61
High freight timing risk
17:15
PM peak
03:00
8,650,475
4.53%
BERWICK: avoid or price carefully around PM peak (17:15 and nearby bins) where possible. For general road-network exposure, overnight / very early morning around 03:00 is likely the lowest-pressure window, subject to curfews, customer delivery windows, fatigue rules and local access restrictions.
5
WERRIBEE
53.74
Moderate freight timing risk
17:15
PM peak
03:00
4,896,871
5.44%
WERRIBEE: avoid or price carefully around PM peak (17:15 and nearby bins) where possible. For general road-network exposure, overnight / very early morning around 03:00 is likely the lowest-pressure window, subject to curfews, customer delivery windows, fatigue rules and local access restrictions.
6
DANDENONG NORTH
48.66
Moderate freight timing risk
17:15
PM peak
03:00
13,895,561
5.16%
DANDENONG NORTH: avoid or price carefully around PM peak (17:15 and nearby bins) where possible. For general road-network exposure, overnight / very early morning around 03:00 is likely the lowest-pressure window, subject to curfews, customer delivery windows, fatigue rules and local access restrictions.
7
GLEN WAVERLEY
45.86
Moderate freight timing risk
17:15
PM peak
03:00
4,525,206
6.55%
GLEN WAVERLEY: avoid or price carefully around PM peak (17:15 and nearby bins) where possible. For general road-network exposure, overnight / very early morning around 03:00 is likely the lowest-pressure window, subject to curfews, customer delivery windows, fatigue rules and local access restrictions.
8
POINT COOK
44.06
Moderate freight timing risk
17:15
PM peak
03:00
6,284,582
4.48%
POINT COOK: avoid or price carefully around PM peak (17:15 and nearby bins) where possible. For general road-network exposure, overnight / very early morning around 03:00 is likely the lowest-pressure window, subject to curfews, customer delivery windows, fatigue rules and local access restrictions.
Worst Time to Move Freight — Top Corridors
Rank
Corridor
Timing Risk Score
Risk Label
Worst 15-min Bin
Window
Best General Bin
Truck Movements
Truck %
Operator Guidance
1
M1 / Monash Freeway Freeway / motorway corridor
83.49
Very high freight timing risk
17:15
PM peak
03:00
103,233,823
5.43%
M1 / Monash Freeway: price and schedule carefully around PM peak (17:15 and nearby bins). For general road-network exposure, overnight / very early morning around 03:00 is likely the lowest-pressure window, subject to curfews, customer windows, fatigue rules and route constraints.
2
Princes Freeway Freeway / motorway corridor
32.82
Lower freight timing risk
17:15
PM peak
03:00
23,206,085
4.43%
Princes Freeway: price and schedule carefully around PM peak (17:15 and nearby bins). For general road-network exposure, overnight / very early morning around 03:00 is likely the lowest-pressure window, subject to curfews, customer windows, fatigue rules and route constraints.
3
Dohertys Road Industrial / freight arterial
30.66
Lower freight timing risk
17:15
PM peak
03:00
691,967
21.05%
Dohertys Road: price and schedule carefully around PM peak (17:15 and nearby bins). For general road-network exposure, overnight / very early morning around 03:00 is likely the lowest-pressure window, subject to curfews, customer windows, fatigue rules and route constraints.
4
M80 Ring Road Freeway / motorway corridor
26.96
Lower freight timing risk
17:15
PM peak
03:00
13,882,289
5.35%
M80 Ring Road: price and schedule carefully around PM peak (17:15 and nearby bins). For general road-network exposure, overnight / very early morning around 03:00 is likely the lowest-pressure window, subject to curfews, customer windows, fatigue rules and route constraints.
5
Fitzgerald Road Industrial / freight arterial
23.80
Lower freight timing risk
17:15
PM peak
03:00
499,212
15.33%
Fitzgerald Road: price and schedule carefully around PM peak (17:15 and nearby bins). For general road-network exposure, overnight / very early morning around 03:00 is likely the lowest-pressure window, subject to curfews, customer windows, fatigue rules and route constraints.
6
M31 / Hume Freeway Freeway / motorway corridor
22.88
Lower freight timing risk
17:15
PM peak
03:00
1,200,348
9.60%
M31 / Hume Freeway: price and schedule carefully around PM peak (17:15 and nearby bins). For general road-network exposure, overnight / very early morning around 03:00 is likely the lowest-pressure window, subject to curfews, customer windows, fatigue rules and route constraints.
7
M8 / Western Freeway Freeway / motorway corridor
22.74
Lower freight timing risk
17:15
PM peak
03:00
481,105
10.55%
M8 / Western Freeway: price and schedule carefully around PM peak (17:15 and nearby bins). For general road-network exposure, overnight / very early morning around 03:00 is likely the lowest-pressure window, subject to curfews, customer windows, fatigue rules and route constraints.
8
Tullamarine Freeway Freeway / motorway corridor
22.04
Lower freight timing risk
17:15
PM peak
03:00
9,175,148
3.52%
Tullamarine Freeway: price and schedule carefully around PM peak (17:15 and nearby bins). For general road-network exposure, overnight / very early morning around 03:00 is likely the lowest-pressure window, subject to curfews, customer windows, fatigue rules and route constraints.
Top Suburbs by Freight Timing Risk
Ranks suburbs/localities by V1 freight timing risk using SCATS timing pressure and TIRTL freight exposure.
Live SCATS + TIRTL evidence pages for public traffic questions
These case-study sections show how the Melbourne TIRTL and SCATS intelligence platform can respond to live community,
council and media questions using verified analytical outputs, local signal-site movement data, corridor freight context,
maps, caveats and downloadable evidence files.
Why this matters: the main TIRTL page is no longer only a static freight report. It now acts as a rapid-response
public evidence layer for issues such as West Gate Tunnel redistribution, Kensington truck concerns, Williamstown Road changes
and missing freight-monitoring screenlines.
Community evidence response
West Gate Tunnel Kensington Truck Impact Analysis
A dedicated SCATS + TIRTL evidence page testing local concerns that West Gate Tunnel traffic changes are affecting
Kensington, Macaulay Road, Epsom Road and nearby inner-north-west streets. This page turns a live community issue into
a structured evidence pack: local SCATS movement changes, West Gate Bridge TIRTL freight context, map outputs, caveats and downloads.
+1.77%Kensington Jan-Mar 2026 vs Jan-Mar 2025 across 15 candidate SCATS sites.
+699,150Net Kensington candidate-site movement change in the year-on-year comparison.
11 up / 4 downSite-level direction of movement change across the Kensington candidate SCATS set.
-162,295West Gate Bridge TIRTL truck movement change in the Nov-Dec 2025 vs Jan-Feb 2026 reference window.
Important caveat: SCATS signal-site movement volume is not the same as street-level truck classification.
This evidence page shows local movement redistribution around Kensington/Macaulay/Epsom and provides regional West Gate Bridge TIRTL freight context.
It does not by itself prove local truck-class increases on Kensington Road, Epsom Road or Macaulay Road.
The strongest public conclusion is that Kensington shows an uneven redistribution pattern: some Macaulay, Kensington and Epsom-related SCATS sites rose sharply year-on-year,
while other nearby sites fell. That makes the City of Melbourne's no-truck-zone investigation and local resident concerns highly testable with further vehicle-classification data.
Williamstown Road SCATS Site Changes — Jan-Mar 2025 vs Jan-Mar 2026
A focused SCATS map for monitored Williamstown Road-related signal sites in Yarraville and Seddon. It supports the broader West Gate Tunnel impact work by showing
where local signal-site traffic increased, decreased or stayed roughly flat in the Jan-Mar 2025 vs Jan-Mar 2026 comparison window.
8Selected Williamstown Road-related SCATS sites in Yarraville and Seddon.
Jan-MarComparison window used for 2025 vs 2026 movement-change analysis.
Red/orangeMap markers identify local increases; blue markers identify decreases.
SCATS onlyShows detected signal-site vehicle movements, not vehicle-classified truck counts.
Method note: this Williamstown Road map uses SCATS detected vehicle movements at signalised sites.
It is useful for local movement-change evidence, but it does not classify trucks versus cars in this extract.
Request a Custom SCATS + TIRTL Traffic Intelligence Report
Need a specific suburb, road, corridor, freight route, intersection, truck-pressure question,
post-project comparison, or community traffic issue analysed? Custom SCATS + TIRTL reports are
available on a fixed-fee, payment-upfront basis.
Important:
these reports use available SCATS, TIRTL, map, CSV, JSON and derived analytical outputs.
They are independent traffic-data intelligence reports, not official Department of Transport
determinations, not engineering certification, and not legal advice.
$495
Rapid Evidence Brief
A focused first-pass answer for one suburb, road, intersection, corridor or community question.
Typical turnaround: 3 business days.
$1,495
Standard Intelligence Report
A deeper written report with charts, tables, map references, source files, caveats and plain-English findings.
Typical turnaround: 5 business days.
$3,950
Priority / Commercial Report
A priority analysis for commercial, media, OOH, freight, property, planning or high-sensitivity public-interest questions.
Typical turnaround: 7 business days.
What a custom report can investigate
Suburb traffic pressure
Identify traffic movement patterns, busiest sites, time-of-day pressure, changes over time,
and where a suburb sits in the broader Melbourne network.
Truck and freight exposure
Examine available TIRTL truck-share, truck-volume, corridor, freight-timing and heavy-vehicle
exposure indicators for a road, suburb or industrial area.
Before / after comparisons
Test whether available SCATS or TIRTL outputs show movement changes before and after a road project,
tunnel opening, traffic change, local restriction, event or planning decision.
Community evidence briefs
Produce a clear evidence pack for residents, community associations, local media or councils,
including what the data supports, what it does not prove, and what further data should be requested.
OOH and location intelligence
Assess high-exposure roads, intersections, corridors, suburb movement pressure and traffic-based
site value for outdoor advertising, roadside property or commercial site-selection questions.
Freight and logistics questions
Analyse worst movement windows, freight-pressure areas, truck-heavy suburbs, corridor friction,
and operational timing questions using available SCATS + TIRTL evidence layers.
Report packages
Package
Fee
Typical turnaround
Includes
Best suited to
Rapid Evidence Brief
$495 AUD
3 business days
One focused question, short written answer, relevant tables/figures where available,
source-file references, caveats and next-data-needed notes.
Residents, community groups, journalists, local businesses.
Standard Traffic Intelligence Report
$1,495 AUD
5 business days
Deeper analysis with written findings, charts, tables, map references, before/after comparisons
where available, downloadable evidence paths and public-safe wording.
Councils, media, planning discussions, community campaigns, small commercial users.
Priority / Commercial Report
$3,950 AUD
7 business days
Priority review, broader SCATS + TIRTL evidence search, commercial framing, location/corridor analysis,
public or internal summary, and optional follow-up discussion.
Payment terms:
payment is required upfront before work begins. Reports are scoped to available datasets and existing
analytical outputs. If a requested question requires raw data that has not yet been processed or uploaded,
the report may identify the missing dataset rather than claim an unsupported conclusion.
What you receive:
a plain-English traffic intelligence report with relevant evidence, caveats, source-file references,
charts or tables where available, and a clear statement of what the data can and cannot prove.
Request a report
To request a custom report, describe the suburb, road, intersection, corridor or traffic question you want analysed.
Include any relevant dates, roads, screenshots, council issue, media article, planning question or commercial use case.
Scope limitation:
custom reports are analytical evidence products. They do not replace formal traffic engineering advice,
road safety audits, official traffic counts, planning permits, expert witness reports or legal advice.
Missing TIRTL Sensors for West Gate Tunnel Transparency — V2
This section identifies proposed public monitoring screenlines for measuring West Gate Tunnel truck uptake,
West Gate Bridge comparison traffic, port connector use, city-end dispersal and inner-west no-truck-zone accountability.
V2 adds supplied West Gate Tunnel endpoint anchors and compares each proposed screenline against the nearest existing TIRTL sensor.
Methodology note: Coordinates identify proposed monitoring screenline areas, not final engineered installation points.
Final TIRTL installation would require road authority approval, power and communications checks, safety assessment,
gantry/pole options, lane geometry and line-of-sight verification.
Nearby TIRTL exists but may not answer the screenline question
522
0.518
WGT-SCR-012
MacKenzie Road / Coode Island / Swanson Dock connector screenline
Essential
MacKenzie Road / Footscray Road / port connector
Port connector
Partial nearby coverage only
522
1.207
WGT-SCR-015
Footscray Road / Appleton Dock / CityLink split screenline
Essential
Footscray Road / Appleton Dock Road / CityLink split
Port and CityLink split
Likely missing public TIRTL coverage
522
1.926
WGT-SCR-019
Dynon Road eastern terminus screenline
Essential
Dynon Road
Eastern terminus
Likely missing public TIRTL coverage
522
2.564
WGT-SCR-005
Hyde Street dangerous-goods / freight-ramp screenline
High
Hyde Street / freeway ramp interface
Industrial freight access
Nearby TIRTL exists but may not answer the screenline question
505
0.513
WGT-SCR-013
Maribyrnong River bridge screenline
High
Maribyrnong River bridge / elevated road
River crossing / system throughput
Partial nearby coverage only
522
0.774
WGT-SCR-014
Footscray Road westbound entrance screenline
High
Footscray Road
City/port connector
Partial nearby coverage only
522
1.450
WGT-SCR-016
CityLink / Bolte Bridge connector screenline
High
CityLink / Bolte Bridge connector
Route-choice connector
Likely missing public TIRTL coverage
522
2.128
WGT-SCR-017
Footscray Road eastbound city dispersal screenline
High
Footscray Road eastbound
City-end dispersal
Likely missing public TIRTL coverage
522
2.412
WGT-SCR-018
Wurundjeri Way connector screenline
High
Wurundjeri Way
City access connector
Likely missing public TIRTL coverage
522
2.714
SCATS signal pressure → TIRTL freeway pressure lag map
West Gate Bridge Congestion Propagation Hotspot Map
This new interactive map turns the latest pressure-wave script run into a geographic view of candidate SCATS pressure points
whose signal-level congestion historically appears before later West Gate Bridge TIRTL speed-flow pressure. It sits naturally after
the broader SCATS + TIRTL pressure quadrant map because it moves from network pressure to likely upstream propagation candidates.
Interactive Google MapMinimum-score filter15 / 30 / 45 / 60-minute lag filterSCATS → TIRTL connection linesQueue-origin proxy, not proof of causality
Top mapped candidate
Whitehall / Somerville
Highest queue-origin candidate score in the embedded hotspot map.
Top score
97.5
Map-score layer used for marker size, marker colour and the hotspot list.
Operational meaning
upstream pressure
Candidate intersections where signal pressure may precede freeway stress.
Best public wording
candidate proxy
Use as a lead-generation and investigation layer, not as a live causal model.
Important caveat: this is a historical lag-association and queue-origin proxy. It does not prove causality,
does not measure physical queue length, and is not a live prediction system. Its value is in showing where the next round of
field validation, engineering review and journalist questions should focus.
SCATS → TIRTL Pressure-Wave Propagation: Candidate Queue Origins, Lag Associations and Long-Queue Proxies
This new layer joins upstream SCATS signal pressure with downstream TIRTL speed-flow pressure on the West Gate Bridge.
It tests whether pressure at signalised intersections tends to appear before freeway speed-flow pressure at 15, 30, 45 and 60-minute lags.
The result is a candidate map of where congestion waves may be starting before they appear as freeway pressure.
Methodology caveat: historical lag association only. These charts do not prove causality, measured physical queue length,
or exact wave origin. They identify high-priority candidates for investigation, validation, field observation and engineering review.
WHITEHALL/SOMERVILLE
Top signal-to-freeway lag candidate · score 89.50
WHITEHALL/SOMERVILLE
Top SCATS queue-origin candidate · score 97.50
WHITEHALL/SOMERVILLE
Top long-queue proxy intersection · score 73.75
15–60 min
Lag window tested between upstream SCATS pressure and downstream TIRTL pressure
How long does traffic buildup at signals affect freeway flow?
Answered / lag association candidate
Tests whether SCATS pressure tends to precede TIRTL pressure at 15, 30, 45 and 60-minute lags. This is association, not proven causality.
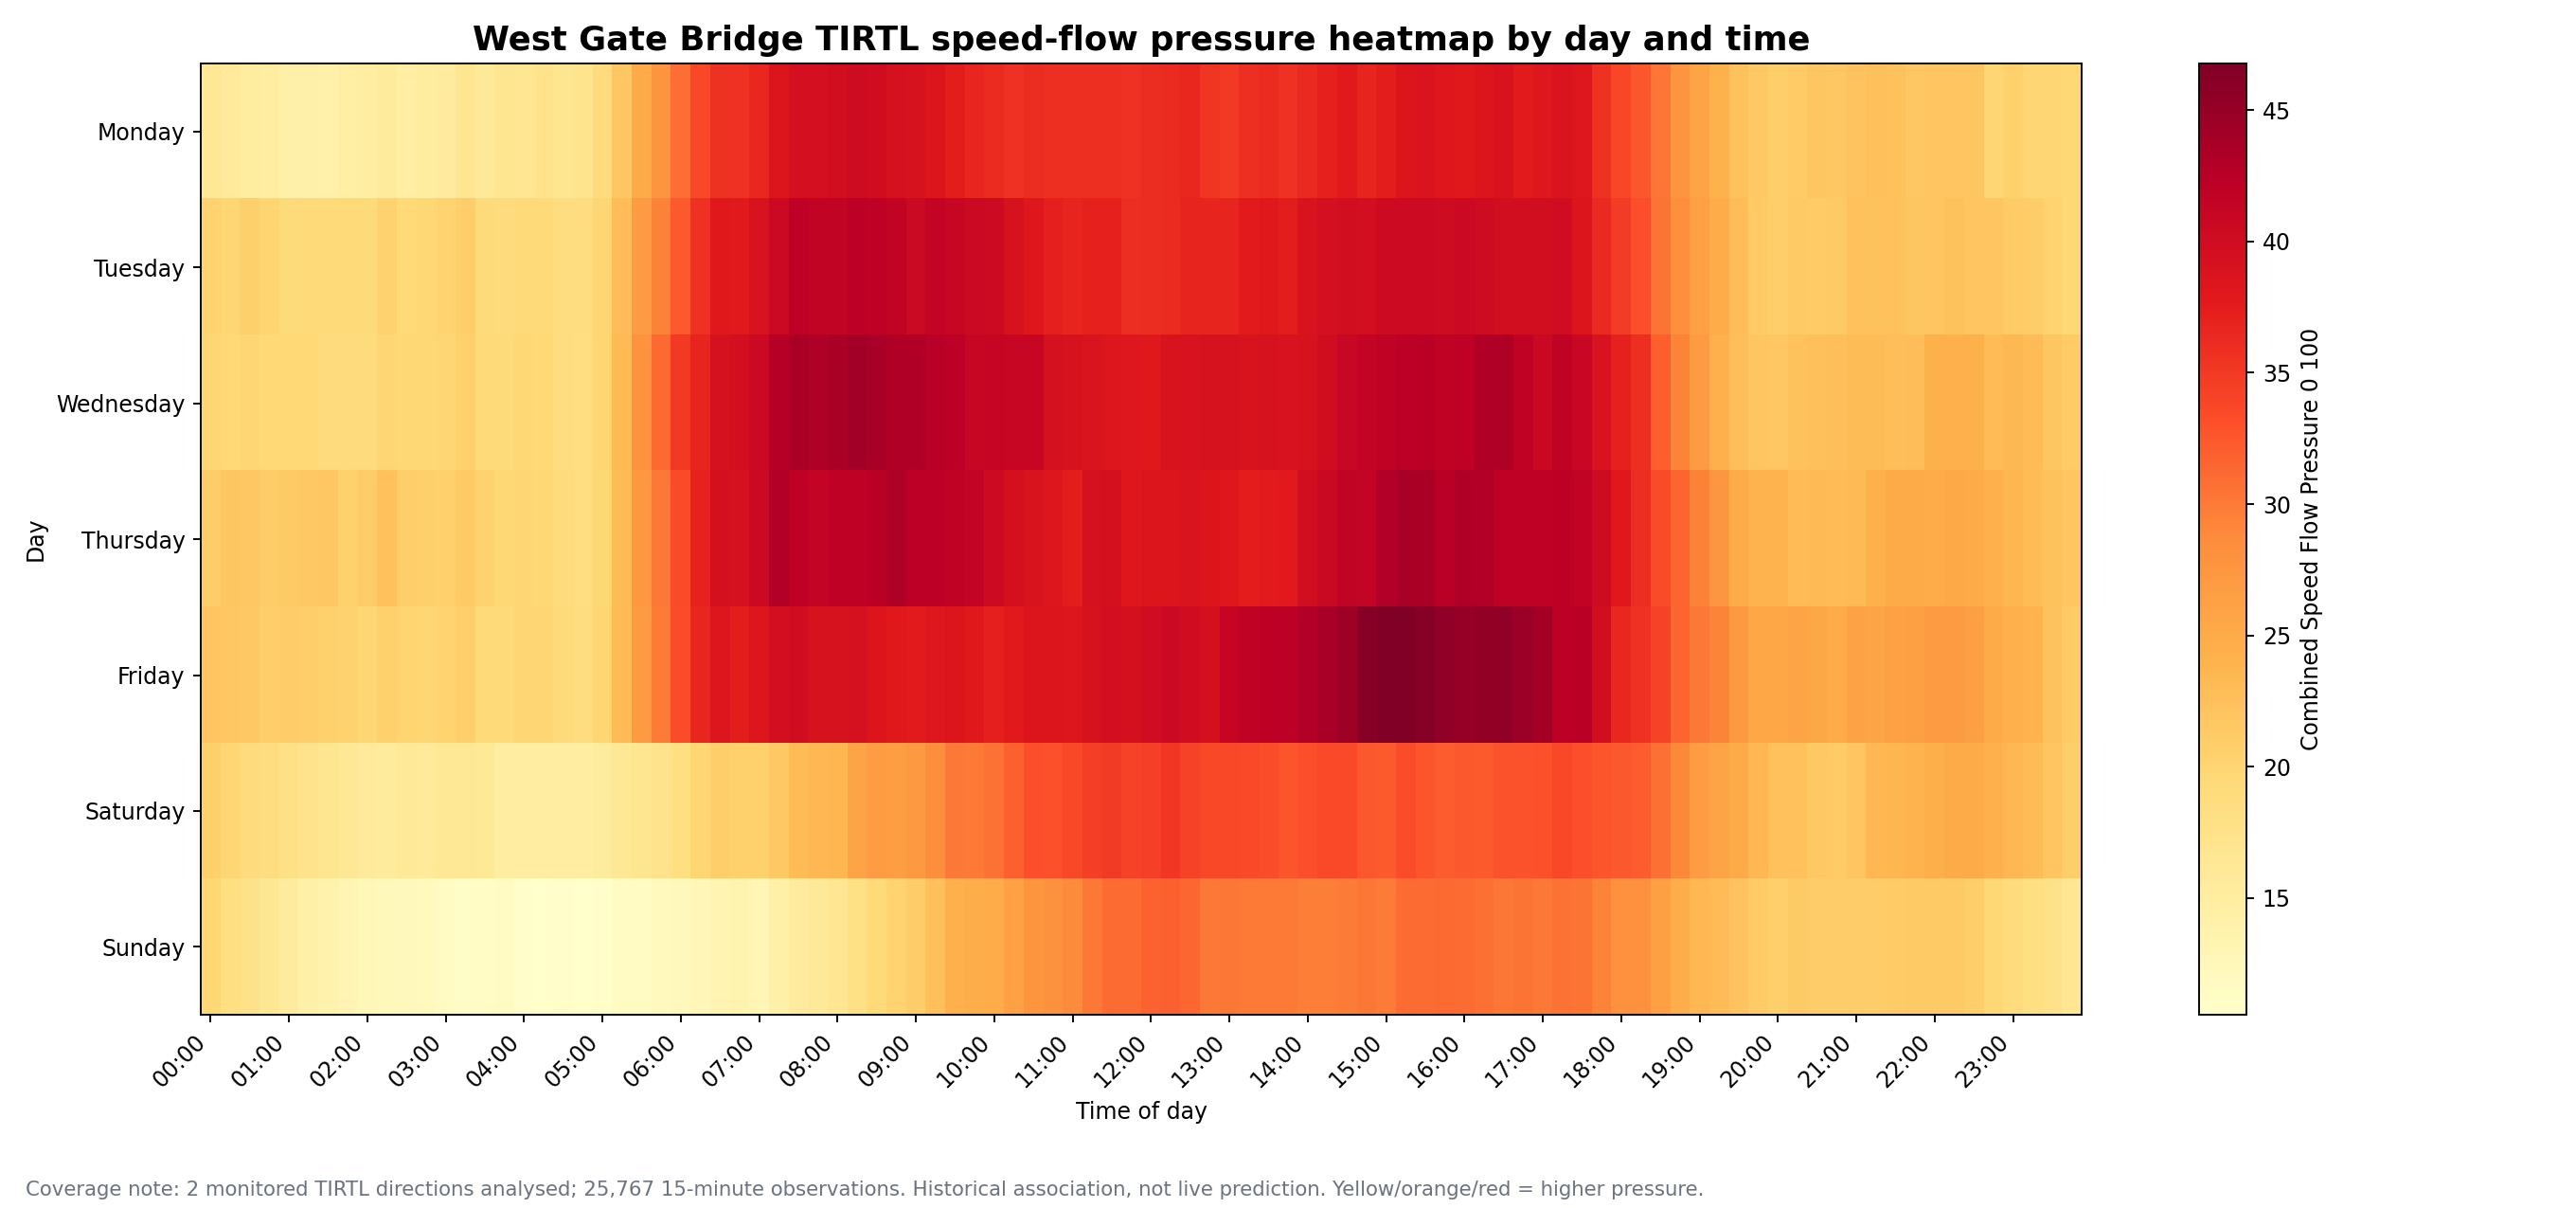
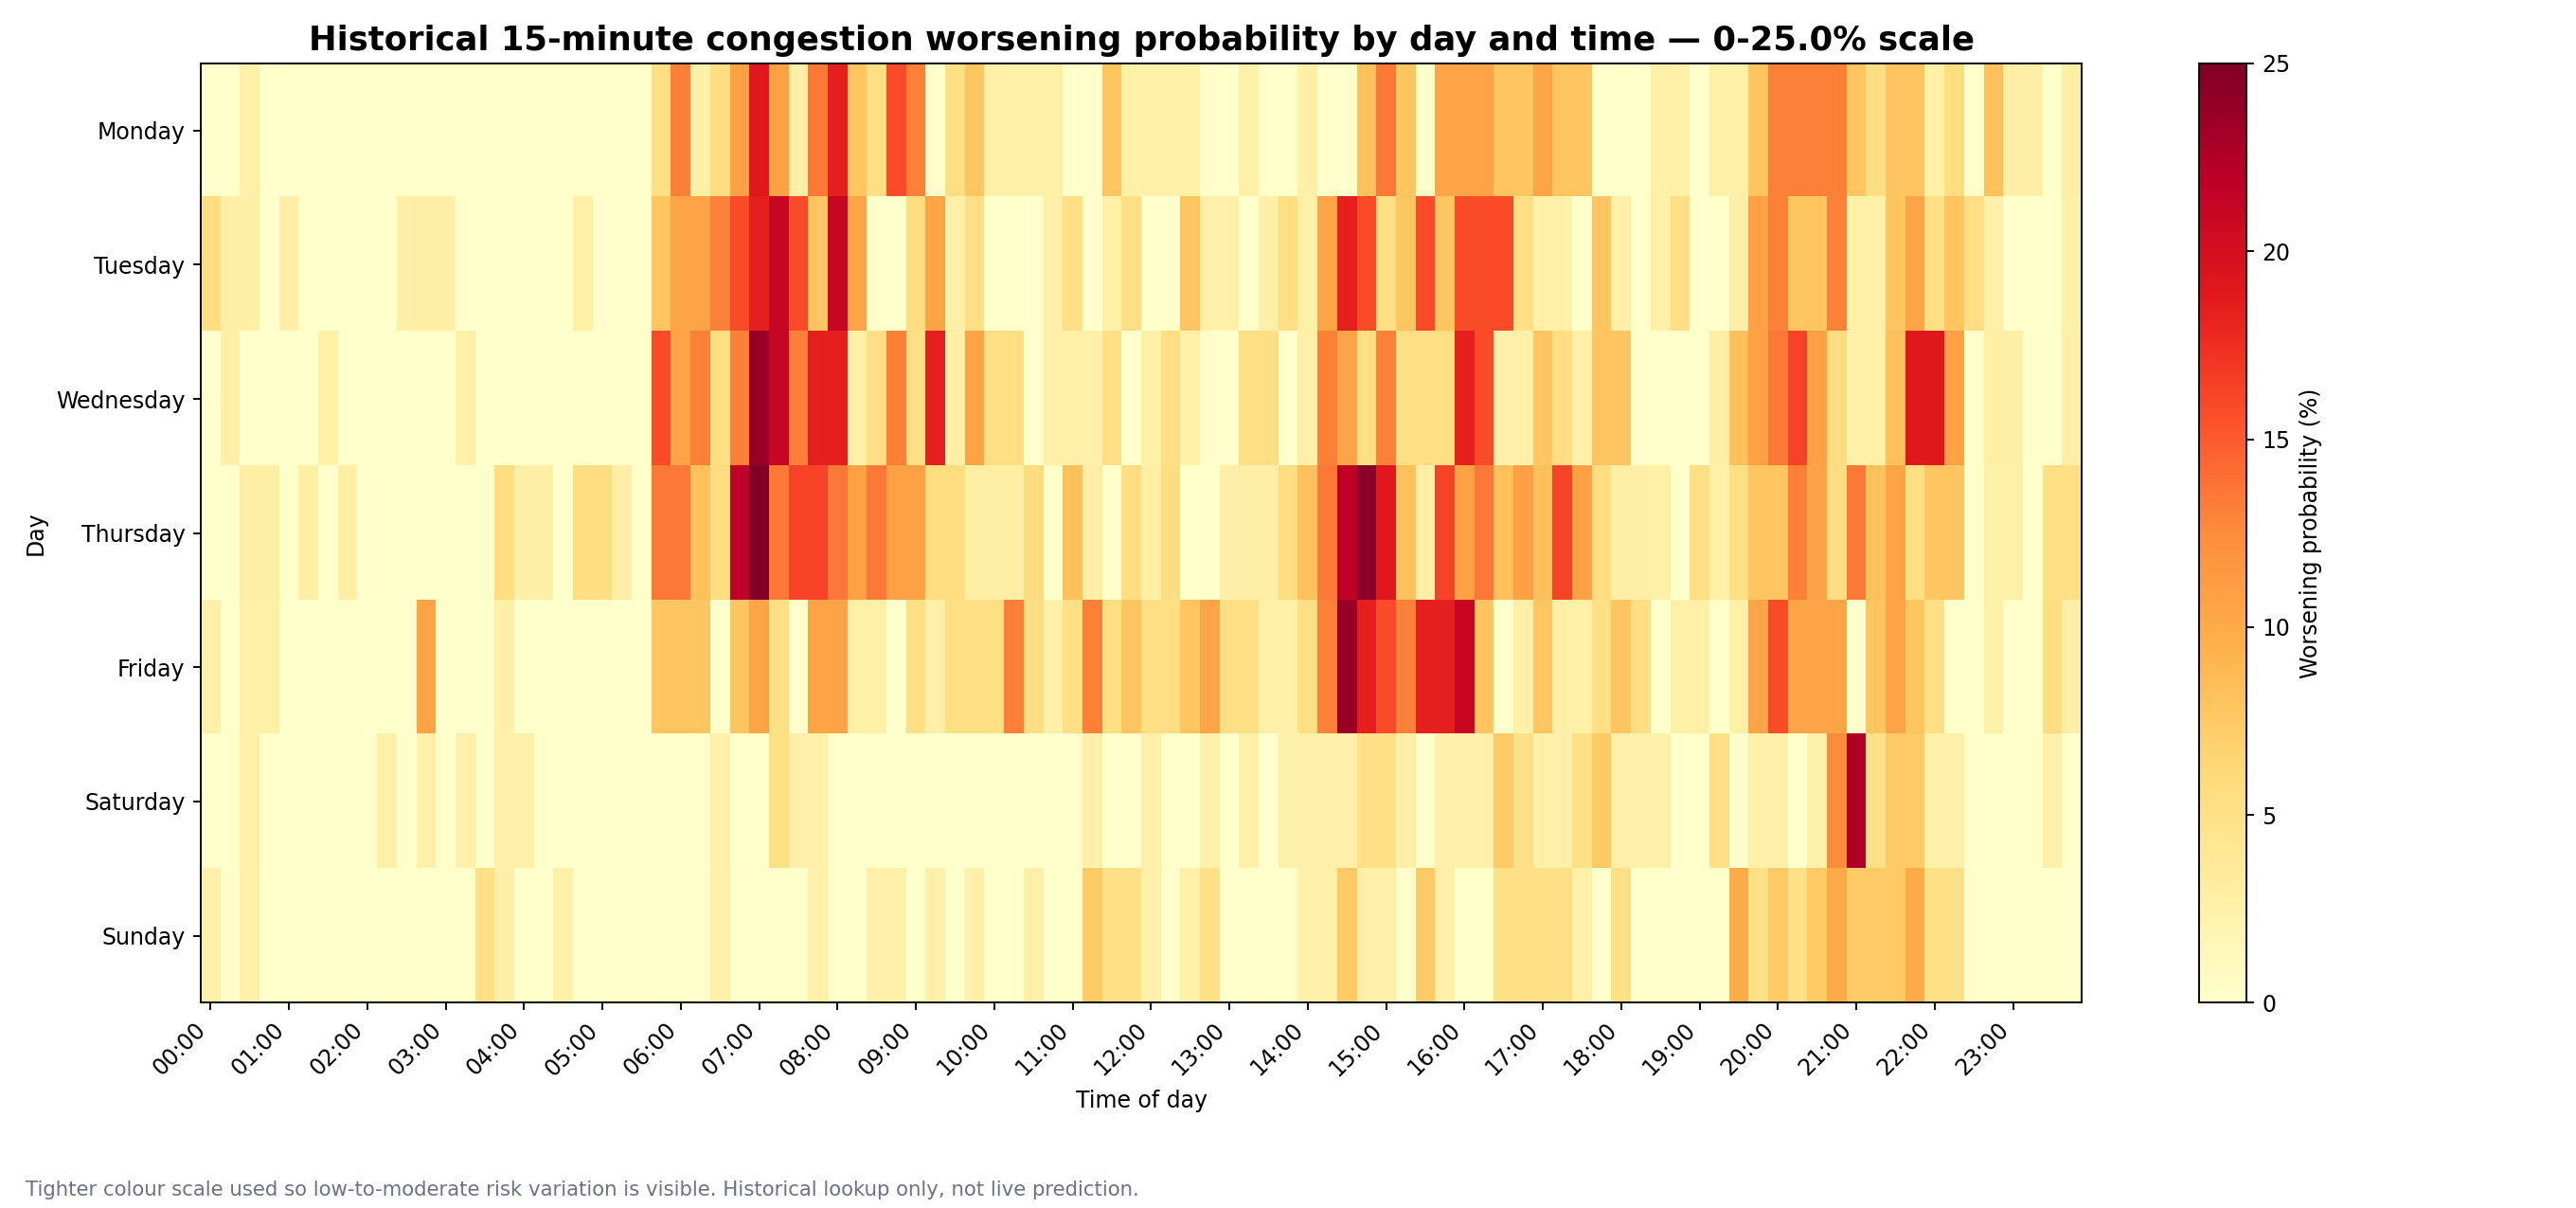
This heatmap converts the TIRTL 15-minute pressure layer into a simple operational view:
darker/hotter cells indicate periods where volume pressure and low-speed pressure combine into higher freeway stress.
Signal-to-freeway lag association candidates
Highest-ranked upstream SCATS sites where signal pressure tends to precede West Gate Bridge TIRTL pressure at the tested lag windows.
SCATS site
TIRTL direction
Best lag
Distance
Observations
Pressure corr.
Pressure lift
Candidate score
WHITEHALL/SOMERVILLE
West Gate Bridge inbound E inbound E
15 min
1,806 m
12,772
0.80
17.62
89.50
COOK/SALMON/WESTGATE FWY ENTRANCE
West Gate Bridge outbound W outbound W
45 min
1,997 m
12,817
0.76
15.35
85.84
WHITEHALL NR FREDERICK
West Gate Bridge inbound E inbound E
15 min
1,213 m
12,772
0.76
16.36
82.24
FOOTSCRAY/MARKET GATE 1.
West Gate Bridge outbound W outbound W
45 min
3,070 m
12,817
0.80
14.67
81.18
FRANCIS/WHITEHALL
West Gate Bridge inbound E inbound E
15 min
998 m
12,772
0.75
16.36
80.37
HYDE/FRANCIS
West Gate Bridge inbound E inbound E
15 min
1,091 m
12,772
0.78
16.22
79.89
WHITEHALL NR FREDERICK
West Gate Bridge outbound W outbound W
45 min
1,202 m
12,817
0.82
15.05
79.48
TODD/WEBB DOCK/WESTGATE WB RAMPS
West Gate Bridge outbound W outbound W
60 min
1,211 m
12,817
0.82
15.50
79.00
WHITEHALL NR HALL
West Gate Bridge inbound E inbound E
15 min
1,558 m
12,772
0.70
16.54
78.91
FOOTSCRAY/MARKET GATE 2
West Gate Bridge outbound W outbound W
45 min
3,126 m
12,817
0.78
14.67
78.66
WHITEHALL/SOMERVILLE
West Gate Bridge outbound W outbound W
45 min
1,796 m
12,817
0.81
14.86
77.57
SOMERVILLE/HYDE
West Gate Bridge inbound E inbound E
15 min
1,861 m
12,772
0.78
16.36
75.65
SCATS queue-origin candidate sites
Candidate intersections whose pressure patterns most strongly precede freeway speed-flow pressure.
Whitehall / Somerville, Whitehall near Frederick and Francis / Whitehall are especially prominent in this run.
Candidate origin site
Best lag
Best distance
Observations
Pressure corr.
Low-speed corr.
Pressure lift
Origin score
WHITEHALL/SOMERVILLE
15 min
1,796 m
12,817
0.81
0.35
17.62
97.50
WHITEHALL NR FREDERICK
15 min
1,202 m
12,817
0.82
0.31
16.36
93.05
FRANCIS/WHITEHALL
15 min
986 m
12,817
0.78
0.29
16.36
92.52
HYDE/FRANCIS
15 min
1,077 m
12,817
0.81
0.27
16.22
91.75
WHITEHALL NR HALL
15 min
1,547 m
12,817
0.70
0.31
16.54
90.08
FRANCIS/STEPHEN
15 min
1,198 m
12,817
0.82
0.24
15.24
85.33
COOK/SALMON/WESTGATE FWY ENTRANCE
45 min
1,997 m
12,817
0.76
0.31
15.35
71.63
TODD/WEBB DOCK/WESTGATE WB RAMPS
60 min
1,211 m
12,817
0.82
0.24
15.50
69.84
Todd Road/Webb Dock Drive/Cook Street
60 min
1,048 m
12,817
0.79
0.21
15.10
67.05
SOMERVILLE/HYDE
15 min
1,861 m
12,772
0.78
0.27
16.36
66.78
WILLIAMSTOWN/TODD
60 min
1,444 m
12,817
0.81
0.23
14.84
65.74
FRANCIS NR BALLARAT
15 min
1,410 m
12,772
0.75
0.24
15.63
65.51
Longest queue-generating intersection proxy
A proxy ranking for intersections that may be associated with longer upstream/downstream queue effects,
using lag association, distance and pressure-lift behaviour rather than measured physical queue length.
Intersection proxy
Best lag
Max candidate distance
TIRTL directions
Pressure corr.
Pressure lift
Origin score
Long-queue proxy
WHITEHALL/SOMERVILLE
15 min
1,806 m
2.00
0.81
17.62
97.50
73.75
PHW/SOMERVILLE/ROBERTS
15 min
3,491 m
1.00
0.80
16.89
61.95
67.05
MONTAGUE/NORMANBY/MUNRO
45 min
4,230 m
1.00
0.82
15.13
49.73
66.48
WHITEHALL NR HALL
15 min
1,558 m
2.00
0.70
16.54
90.08
65.85
FOOTSCRAY/MARKET GATE 1.
45 min
3,070 m
1.00
0.80
14.67
64.45
64.24
WHITEHALL NR FREDERICK
15 min
1,213 m
2.00
0.82
16.36
93.05
64.20
FOOTSCRAY/MARKET GATE 2
45 min
3,126 m
1.00
0.78
14.67
62.66
63.59
HYDE/FRANCIS
15 min
1,091 m
2.00
0.81
16.22
91.75
61.97
WESTGATE FWY WB/MONTAGUE
45 min
4,036 m
1.00
0.80
14.66
46.07
61.81
BAY/BRIDGE
60 min
3,885 m
1.00
0.76
13.95
48.29
61.74
FRANCIS/WHITEHALL
15 min
998 m
2.00
0.78
16.36
92.52
61.51
FRANCIS/STEPHEN
15 min
1,214 m
2.00
0.82
15.24
85.33
58.80
Best signal-to-freeway lag by pair
Best lag, pressure correlation, lift and candidate score for each SCATS/TIRTL pair.
This is a proxy and candidate layer. It does not prove causality, measure queue length,
or predict live network failure. It identifies places where multiple independent pressure signals overlap.
Use: candidate pressure point, proxy score, strategic risk signal, possible bottleneck.
Avoid: definite failure, proven cause, exact queue origin, live prediction.
Top strategic pressure point
MOUNT WAVERLEY · 84.1
High total traffic + high truck pressure. Proxy score from existing SCATS + TIRTL summary layers.
Top failure-first proxy candidate
MOUNT WAVERLEY
Candidate only. This is not a live failure prediction.
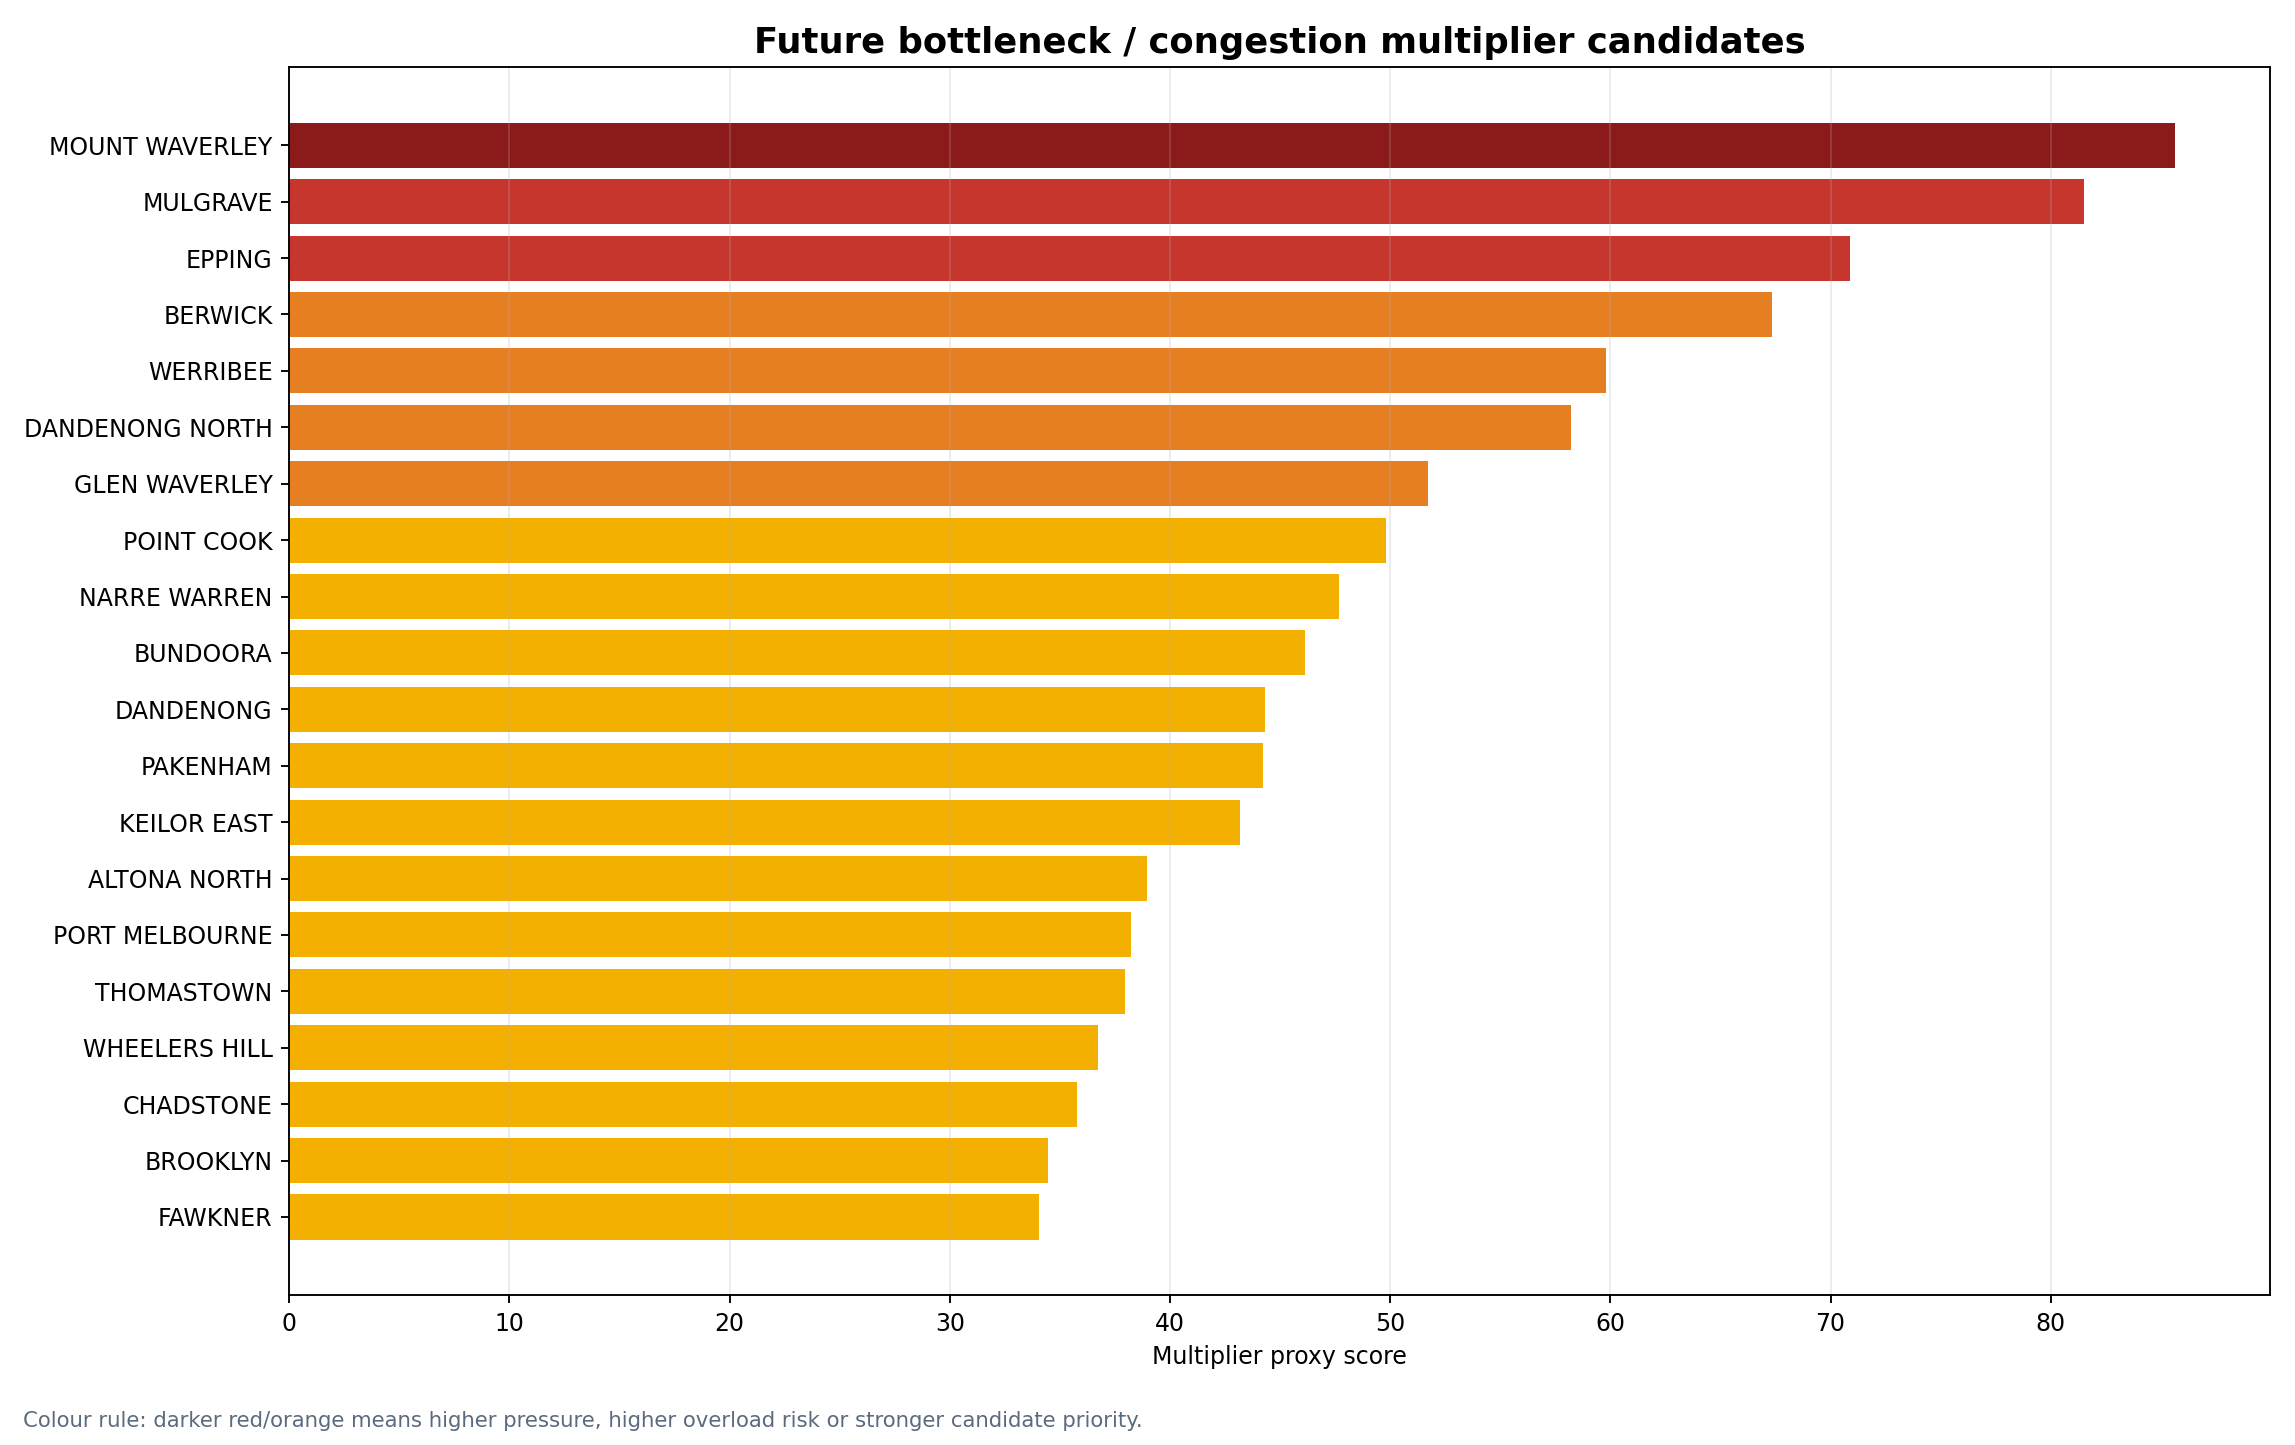
Top bottleneck / multiplier candidate
MOUNT WAVERLEY
Where combined pressure indicators suggest possible congestion-multiplier behaviour.
More resilient under-load proxy
GOWANBRAE
Higher resilience score means lower overload risk under the current proxy model.
Lowest resilience proxy
MOUNT WAVERLEY
Lower resilience means higher overload pressure in the current proxy model.
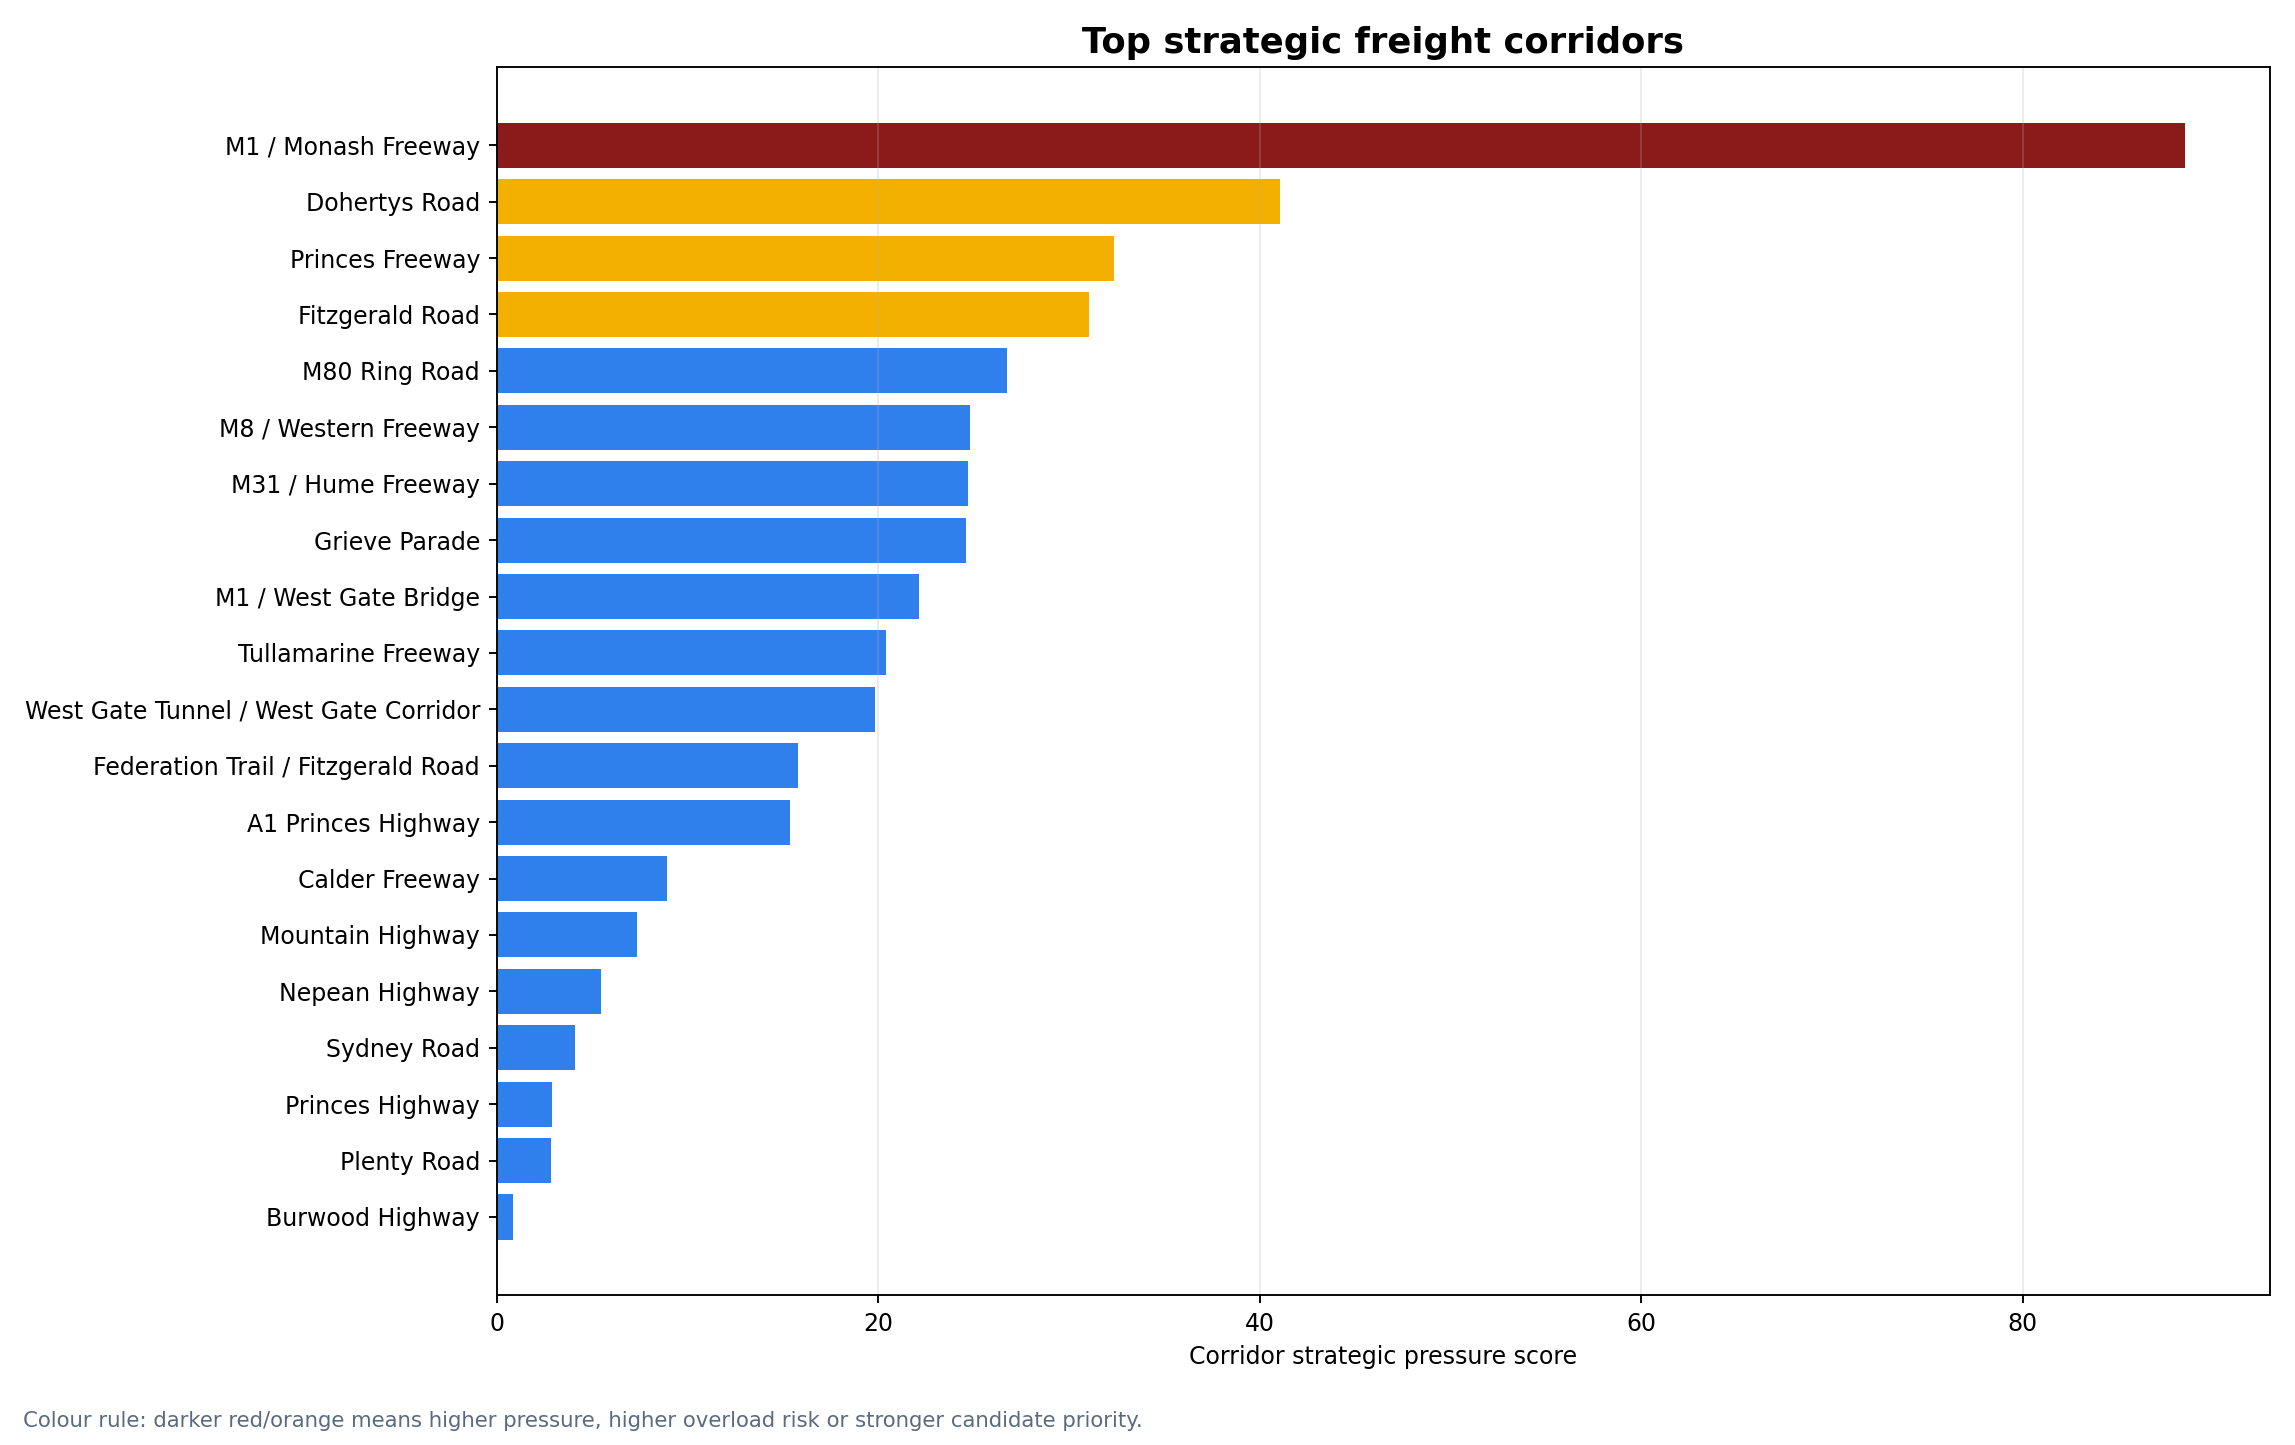
Top strategic freight corridor
M1 / Monash Freeway
Ranked using freight-money, truck movement, truck share and timing-risk indicators.
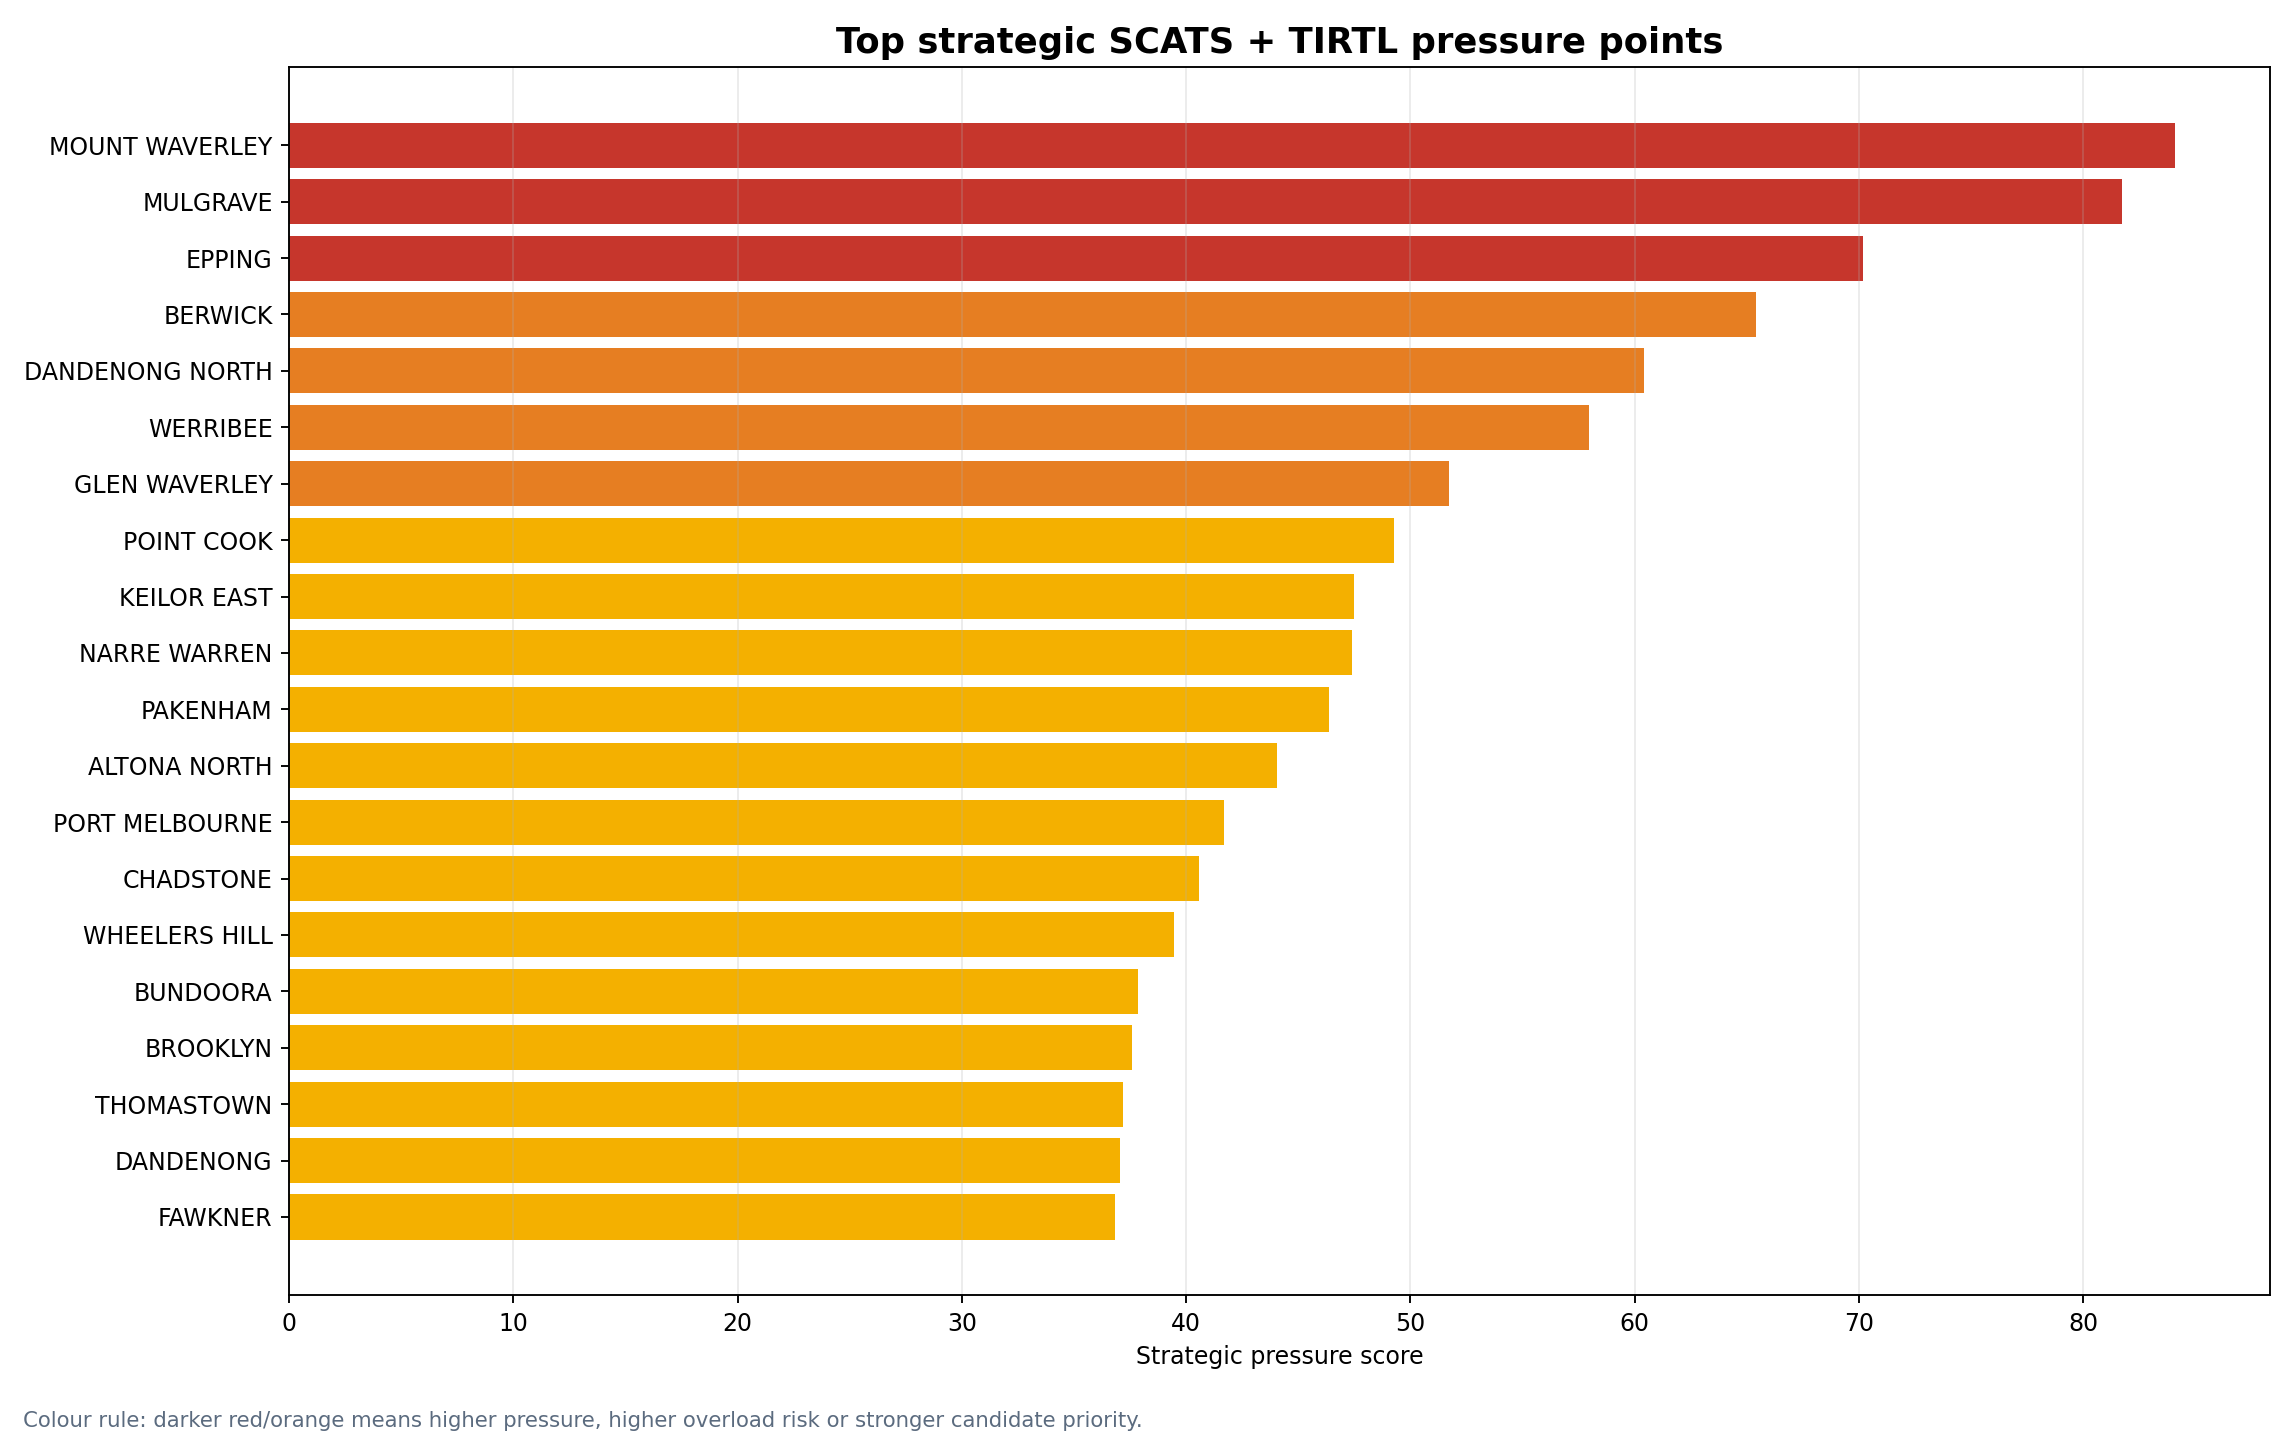
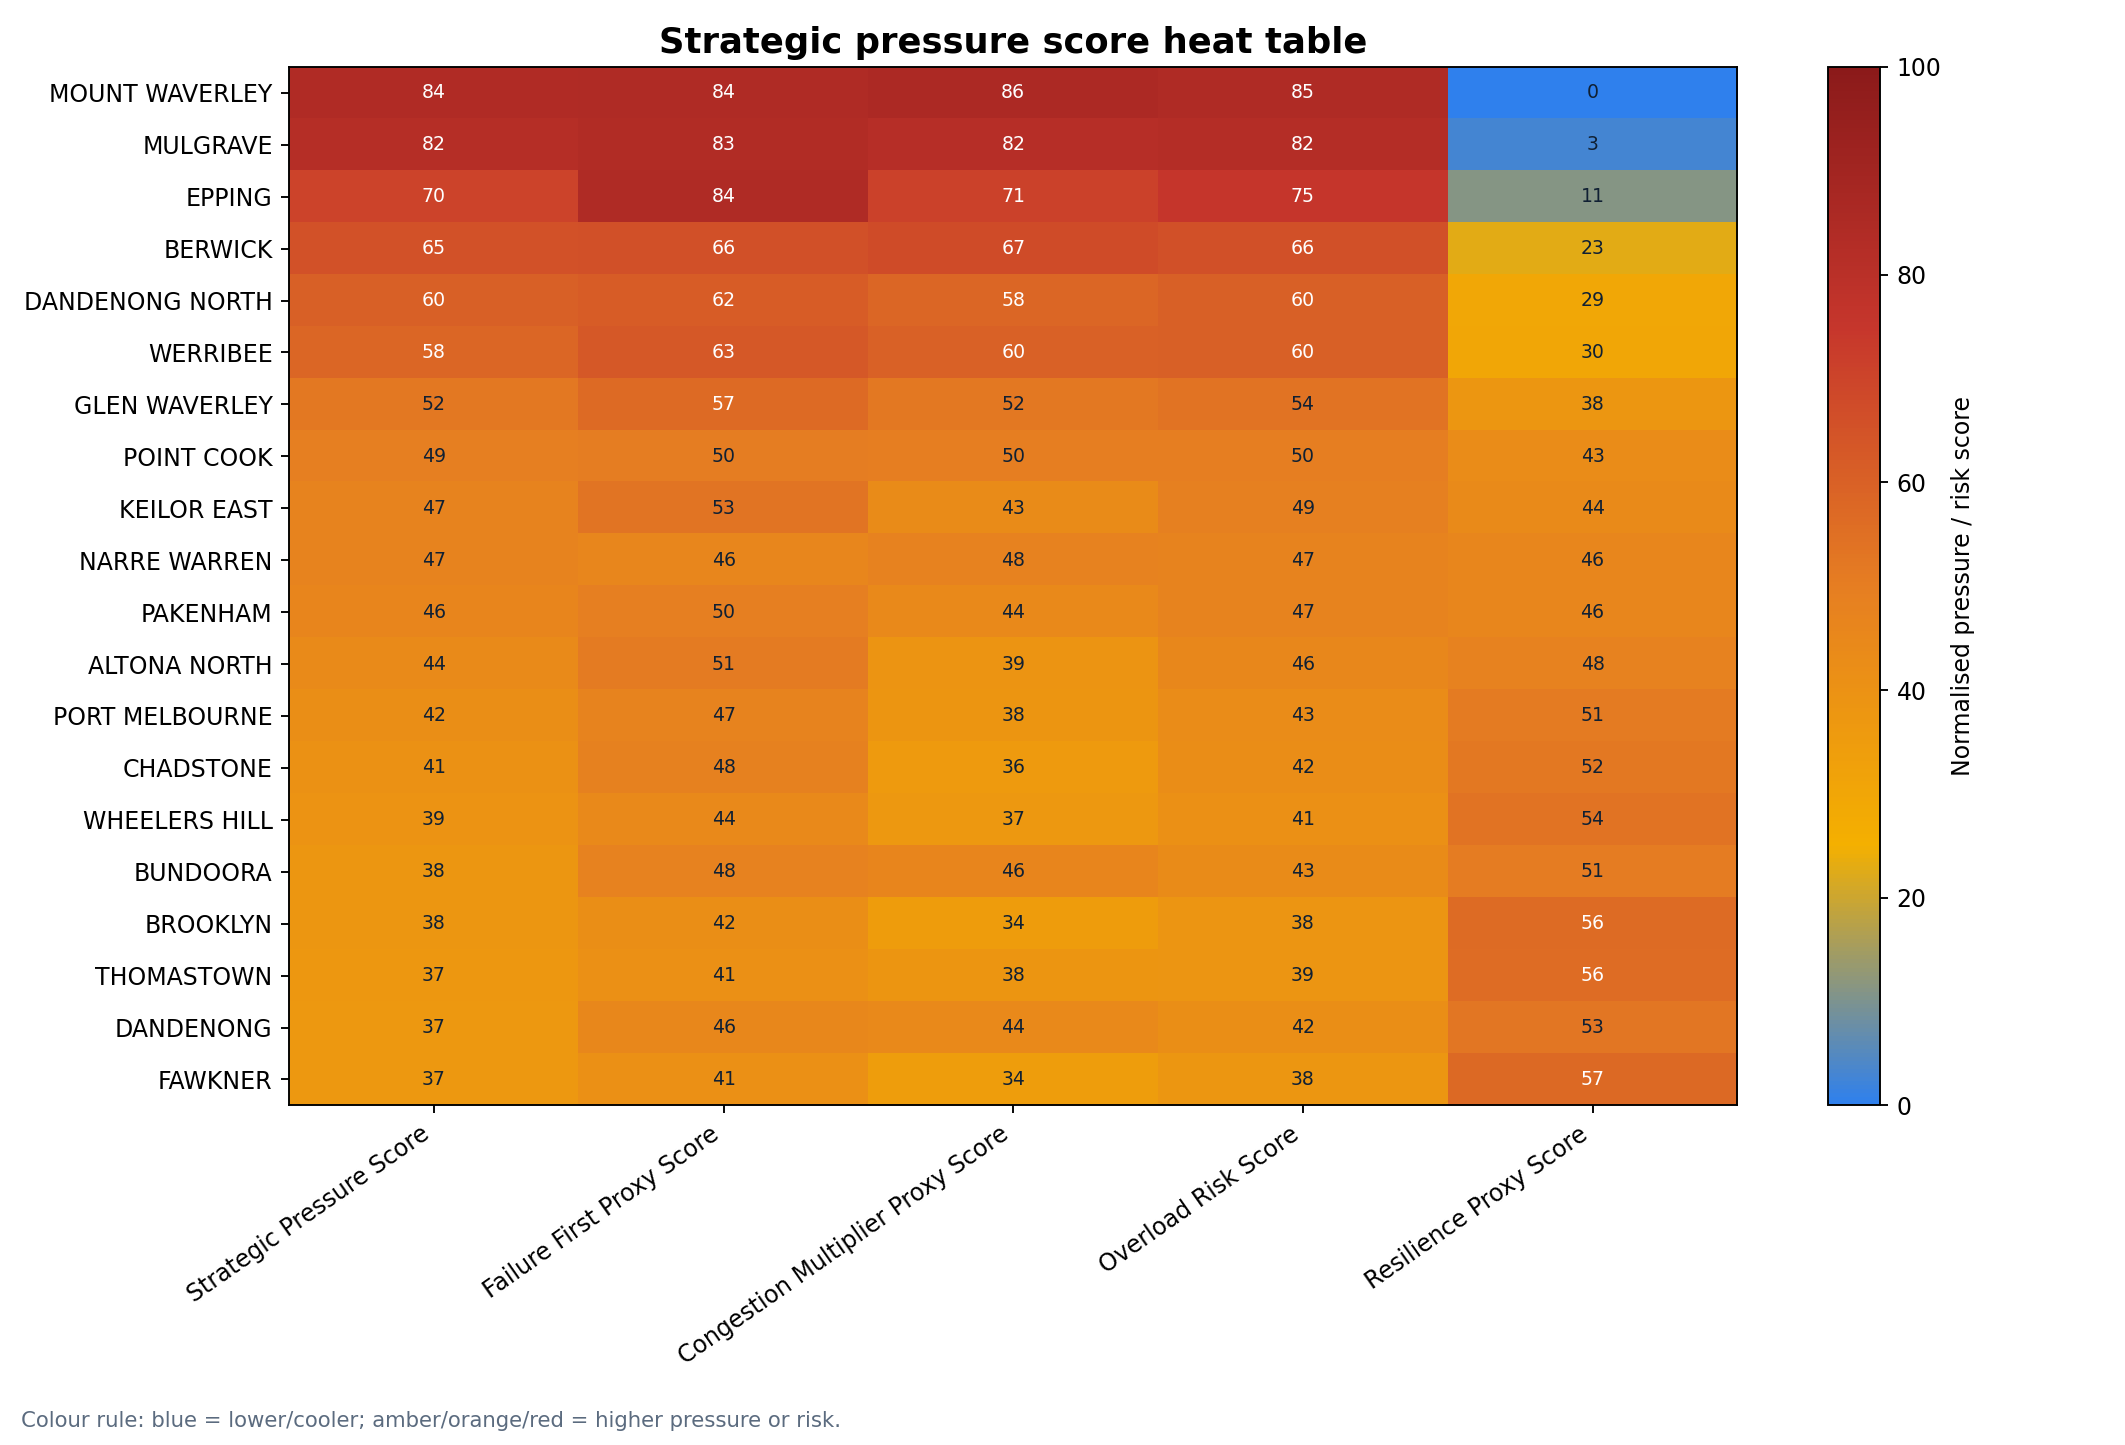
Top strategic pressure points
Red and orange show the strongest combined pressure signals.
These are the strongest combined suburb/locality pressure candidates using SCATS pressure, TIRTL truck pressure, freight timing risk, truck share and freight-money indicators.
Strategic Rank
Suburb Locality
Strategic Pressure Score
Failure First Proxy Score
Congestion Multiplier Proxy Score
Resilience Proxy Score
Pressure Point Type
Proxy Confidence
Worst Time Window
Best General Window
1.0
MOUNT WAVERLEY
84.1
84.5
85.7
0.0
High total traffic + high truck pressure
Higher
PM peak
Overnight / very early morning
2.0
MULGRAVE
81.7
83.4
81.5
2.8
Truck-heavy / freight-led pressure
Higher
PM peak
Overnight / very early morning
3.0
EPPING
70.2
84.5
70.9
11.3
Commuter / general traffic-led pressure
Higher
PM peak
Overnight / very early morning
4.0
BERWICK
65.4
65.7
67.3
22.8
Commuter / general traffic-led pressure
Higher
PM peak
Overnight / very early morning
5.0
DANDENONG NORTH
60.4
61.7
58.2
29.5
Commercial freight pressure candidate
Higher
PM peak
Overnight / very early morning
6.0
WERRIBEE
58.0
63.2
59.8
29.8
Commuter / general traffic-led pressure
Higher
PM peak
Overnight / very early morning
7.0
GLEN WAVERLEY
51.7
57.0
51.7
37.9
Moderate combined pressure
Higher
PM peak
Overnight / very early morning
8.0
POINT COOK
49.3
50.1
49.8
42.6
Moderate combined pressure
Higher
PM peak
Overnight / very early morning
9.0
KEILOR EAST
47.5
53.3
43.2
43.9
Moderate combined pressure
Higher
PM peak
Overnight / very early morning
10.0
NARRE WARREN
47.4
45.8
47.7
46.0
Moderate combined pressure
Higher
PM peak
Overnight / very early morning
11.0
PAKENHAM
46.4
49.6
44.2
45.8
Moderate combined pressure
Higher
PM peak
Overnight / very early morning
12.0
ALTONA NORTH
44.0
51.1
39.0
47.7
Moderate combined pressure
Higher
PM peak
Overnight / very early morning
13.0
PORT MELBOURNE
41.7
47.3
38.2
50.8
Moderate combined pressure
Higher
PM peak
Overnight / very early morning
14.0
CHADSTONE
40.6
48.2
35.8
51.6
Moderate combined pressure
Higher
PM peak
Overnight / very early morning
15.0
WHEELERS HILL
39.4
44.4
36.8
53.7
Moderate combined pressure
Higher
PM peak
Overnight / very early morning
16.0
BUNDOORA
37.8
47.9
46.1
50.8
Commuter / general traffic-led pressure
Higher
PM peak
Overnight / very early morning
17.0
BROOKLYN
37.6
41.7
34.5
56.4
Moderate combined pressure
Higher
PM peak
Overnight / very early morning
18.0
THOMASTOWN
37.2
40.6
38.0
56.2
Moderate combined pressure
Higher
PM peak
Overnight / very early morning
19.0
DANDENONG
37.0
45.6
44.3
52.6
Commuter / general traffic-led pressure
Higher
PM peak
Overnight / very early morning
20.0
FAWKNER
36.9
40.9
34.0
57.2
Moderate combined pressure
Higher
PM peak
Overnight / very early morning
21.0
OFFICER
35.9
38.9
32.4
59.0
Moderate combined pressure
Higher
PM peak
Overnight / very early morning
22.0
BALLAN
32.6
46.7
23.8
59.6
Moderate combined pressure
Higher
PM peak
Overnight / very early morning
23.0
LAVERTON NORTH
32.5
36.1
28.8
63.0
Moderate combined pressure
Higher
PM peak
Overnight / very early morning
24.0
AIRPORT WEST
29.2
31.1
26.4
67.5
Moderate combined pressure
Higher
PM peak
Overnight / very early morning
25.0
ENDEAVOUR HILLS
28.0
30.8
26.2
68.3
Moderate combined pressure
Higher
PM peak
Overnight / very early morning
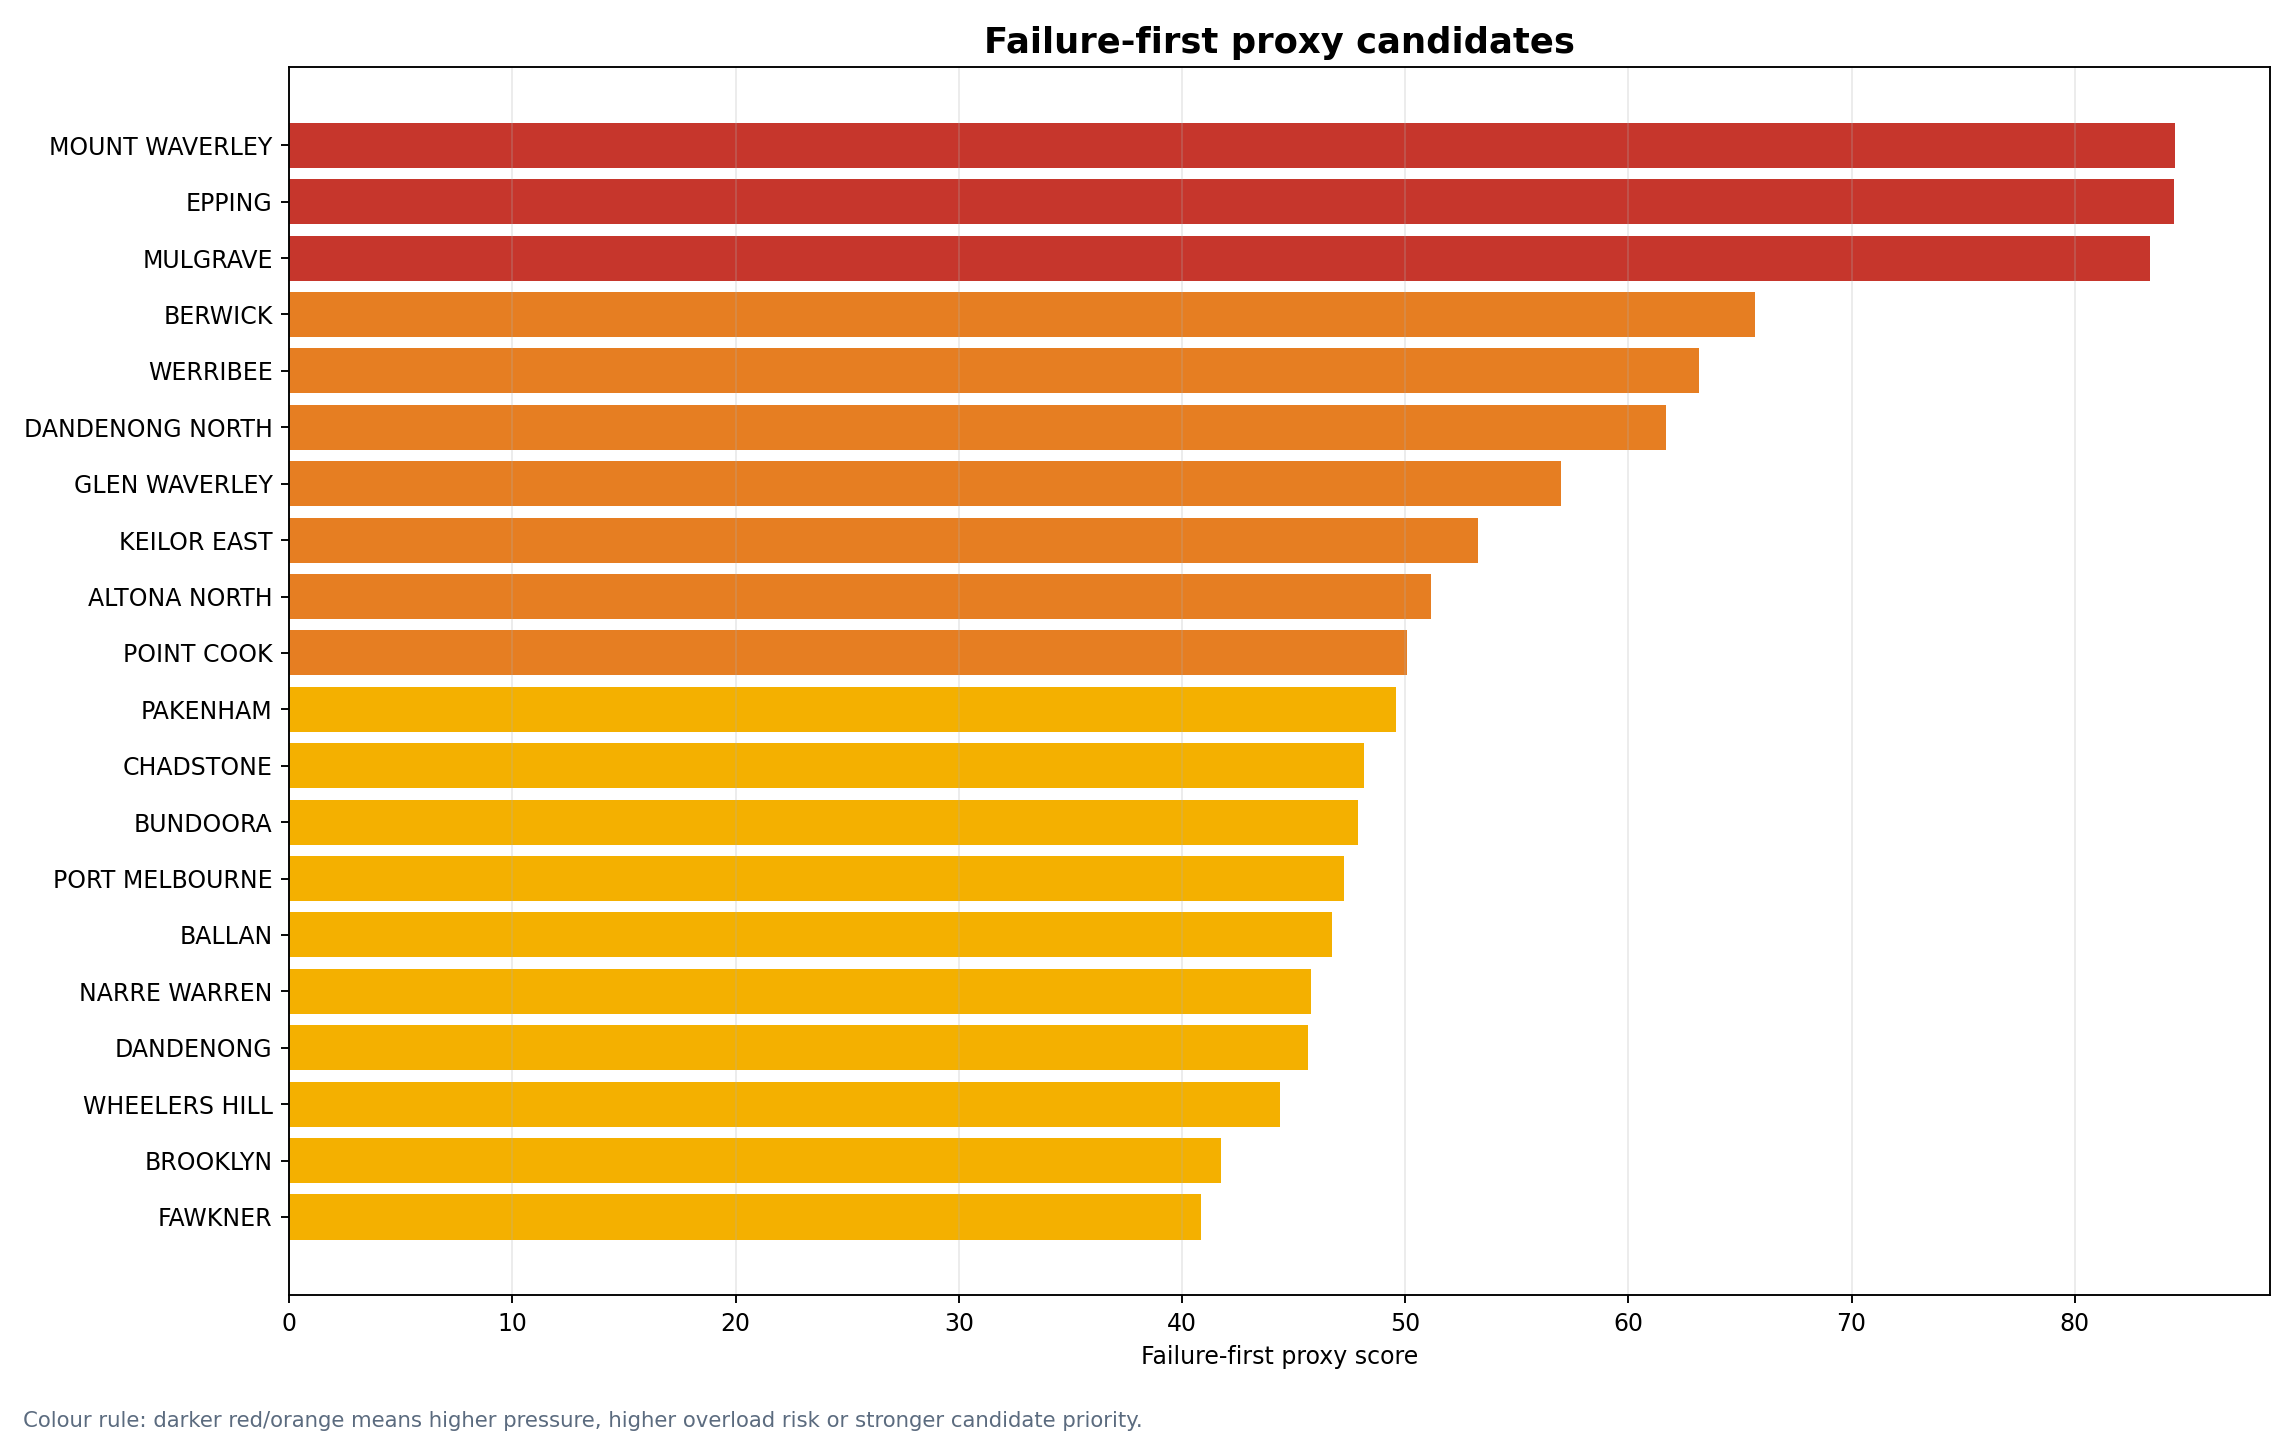
Failure-First Proxy Candidates
These are not live predictions. They are locations where the current summary-layer model sees strong pressure, timing-risk and overload-risk signals.
Candidate multiplier locations are where general traffic pressure, truck pressure and freight timing risk overlap.
Strategic Rank
Suburb Locality
Congestion Multiplier Proxy Score
Strategic Pressure Score
Scats Pressure Score
Tirtl Truck Pressure Score
Freight Timing Risk Score
Pressure Point Type
Public Summary
1.0
MOUNT WAVERLEY
85.7
84.1
70.5
78.1
73.4
High total traffic + high truck pressure
MOUNT WAVERLEY appears as a High total traffic + high truck pressure with SCATS pressure 70.5, TIRTL truck pressure 78.1, and strategic pressure score 84.1.
2.0
MULGRAVE
81.5
81.7
51.5
85.4
68.0
Truck-heavy / freight-led pressure
MULGRAVE appears as a Truck-heavy / freight-led pressure with SCATS pressure 51.5, TIRTL truck pressure 85.4, and strategic pressure score 81.7.
3.0
EPPING
70.9
70.2
100.0
35.7
64.3
Commuter / general traffic-led pressure
EPPING appears as a Commuter / general traffic-led pressure with SCATS pressure 100.0, TIRTL truck pressure 35.7, and strategic pressure score 70.2.
4.0
BERWICK
67.3
65.4
74.5
44.1
59.6
Commuter / general traffic-led pressure
BERWICK appears as a Commuter / general traffic-led pressure with SCATS pressure 74.5, TIRTL truck pressure 44.1, and strategic pressure score 65.4.
6.0
WERRIBEE
59.8
58.0
76.0
34.0
53.7
Commuter / general traffic-led pressure
WERRIBEE appears as a Commuter / general traffic-led pressure with SCATS pressure 76.0, TIRTL truck pressure 34.0, and strategic pressure score 58.0.
5.0
DANDENONG NORTH
58.2
60.4
27.4
65.0
48.7
Commercial freight pressure candidate
DANDENONG NORTH appears as a Commercial freight pressure candidate with SCATS pressure 27.4, TIRTL truck pressure 65.0, and strategic pressure score 60.4.
7.0
GLEN WAVERLEY
51.7
51.7
58.4
36.6
45.9
Moderate combined pressure
GLEN WAVERLEY appears as a Moderate combined pressure with SCATS pressure 58.4, TIRTL truck pressure 36.6, and strategic pressure score 51.7.
8.0
POINT COOK
49.8
49.3
52.4
35.5
44.1
Moderate combined pressure
POINT COOK appears as a Moderate combined pressure with SCATS pressure 52.4, TIRTL truck pressure 35.5, and strategic pressure score 49.3.
10.0
NARRE WARREN
47.7
47.4
43.8
37.8
41.8
Moderate combined pressure
NARRE WARREN appears as a Moderate combined pressure with SCATS pressure 43.8, TIRTL truck pressure 37.8, and strategic pressure score 47.4.
16.0
BUNDOORA
46.1
37.8
96.0
1.6
43.8
Commuter / general traffic-led pressure
BUNDOORA appears as a Commuter / general traffic-led pressure with SCATS pressure 96.0, TIRTL truck pressure 1.6, and strategic pressure score 37.8.
19.0
DANDENONG
44.3
37.0
90.8
0.8
41.9
Commuter / general traffic-led pressure
DANDENONG appears as a Commuter / general traffic-led pressure with SCATS pressure 90.8, TIRTL truck pressure 0.8, and strategic pressure score 37.0.
11.0
PAKENHAM
44.2
46.4
42.4
34.8
39.3
Moderate combined pressure
PAKENHAM appears as a Moderate combined pressure with SCATS pressure 42.4, TIRTL truck pressure 34.8, and strategic pressure score 46.4.
9.0
KEILOR EAST
43.2
47.5
23.9
47.0
36.7
Moderate combined pressure
KEILOR EAST appears as a Moderate combined pressure with SCATS pressure 23.9, TIRTL truck pressure 47.0, and strategic pressure score 47.5.
12.0
ALTONA NORTH
39.0
44.0
32.7
34.0
34.8
Moderate combined pressure
ALTONA NORTH appears as a Moderate combined pressure with SCATS pressure 32.7, TIRTL truck pressure 34.0, and strategic pressure score 44.0.
13.0
PORT MELBOURNE
38.2
41.7
34.9
32.2
34.1
Moderate combined pressure
PORT MELBOURNE appears as a Moderate combined pressure with SCATS pressure 34.9, TIRTL truck pressure 32.2, and strategic pressure score 41.7.
18.0
THOMASTOWN
38.0
37.2
47.8
22.0
34.4
Moderate combined pressure
THOMASTOWN appears as a Moderate combined pressure with SCATS pressure 47.8, TIRTL truck pressure 22.0, and strategic pressure score 37.2.
15.0
WHEELERS HILL
36.8
39.4
27.7
35.9
31.9
Moderate combined pressure
WHEELERS HILL appears as a Moderate combined pressure with SCATS pressure 27.7, TIRTL truck pressure 35.9, and strategic pressure score 39.4.
14.0
CHADSTONE
35.8
40.6
9.6
47.3
30.0
Moderate combined pressure
CHADSTONE appears as a Moderate combined pressure with SCATS pressure 9.6, TIRTL truck pressure 47.3, and strategic pressure score 40.6.
17.0
BROOKLYN
34.5
37.6
32.2
28.0
30.4
Moderate combined pressure
BROOKLYN appears as a Moderate combined pressure with SCATS pressure 32.2, TIRTL truck pressure 28.0, and strategic pressure score 37.6.
20.0
FAWKNER
34.0
36.9
28.0
30.6
30.0
Moderate combined pressure
FAWKNER appears as a Moderate combined pressure with SCATS pressure 28.0, TIRTL truck pressure 30.6, and strategic pressure score 36.9.
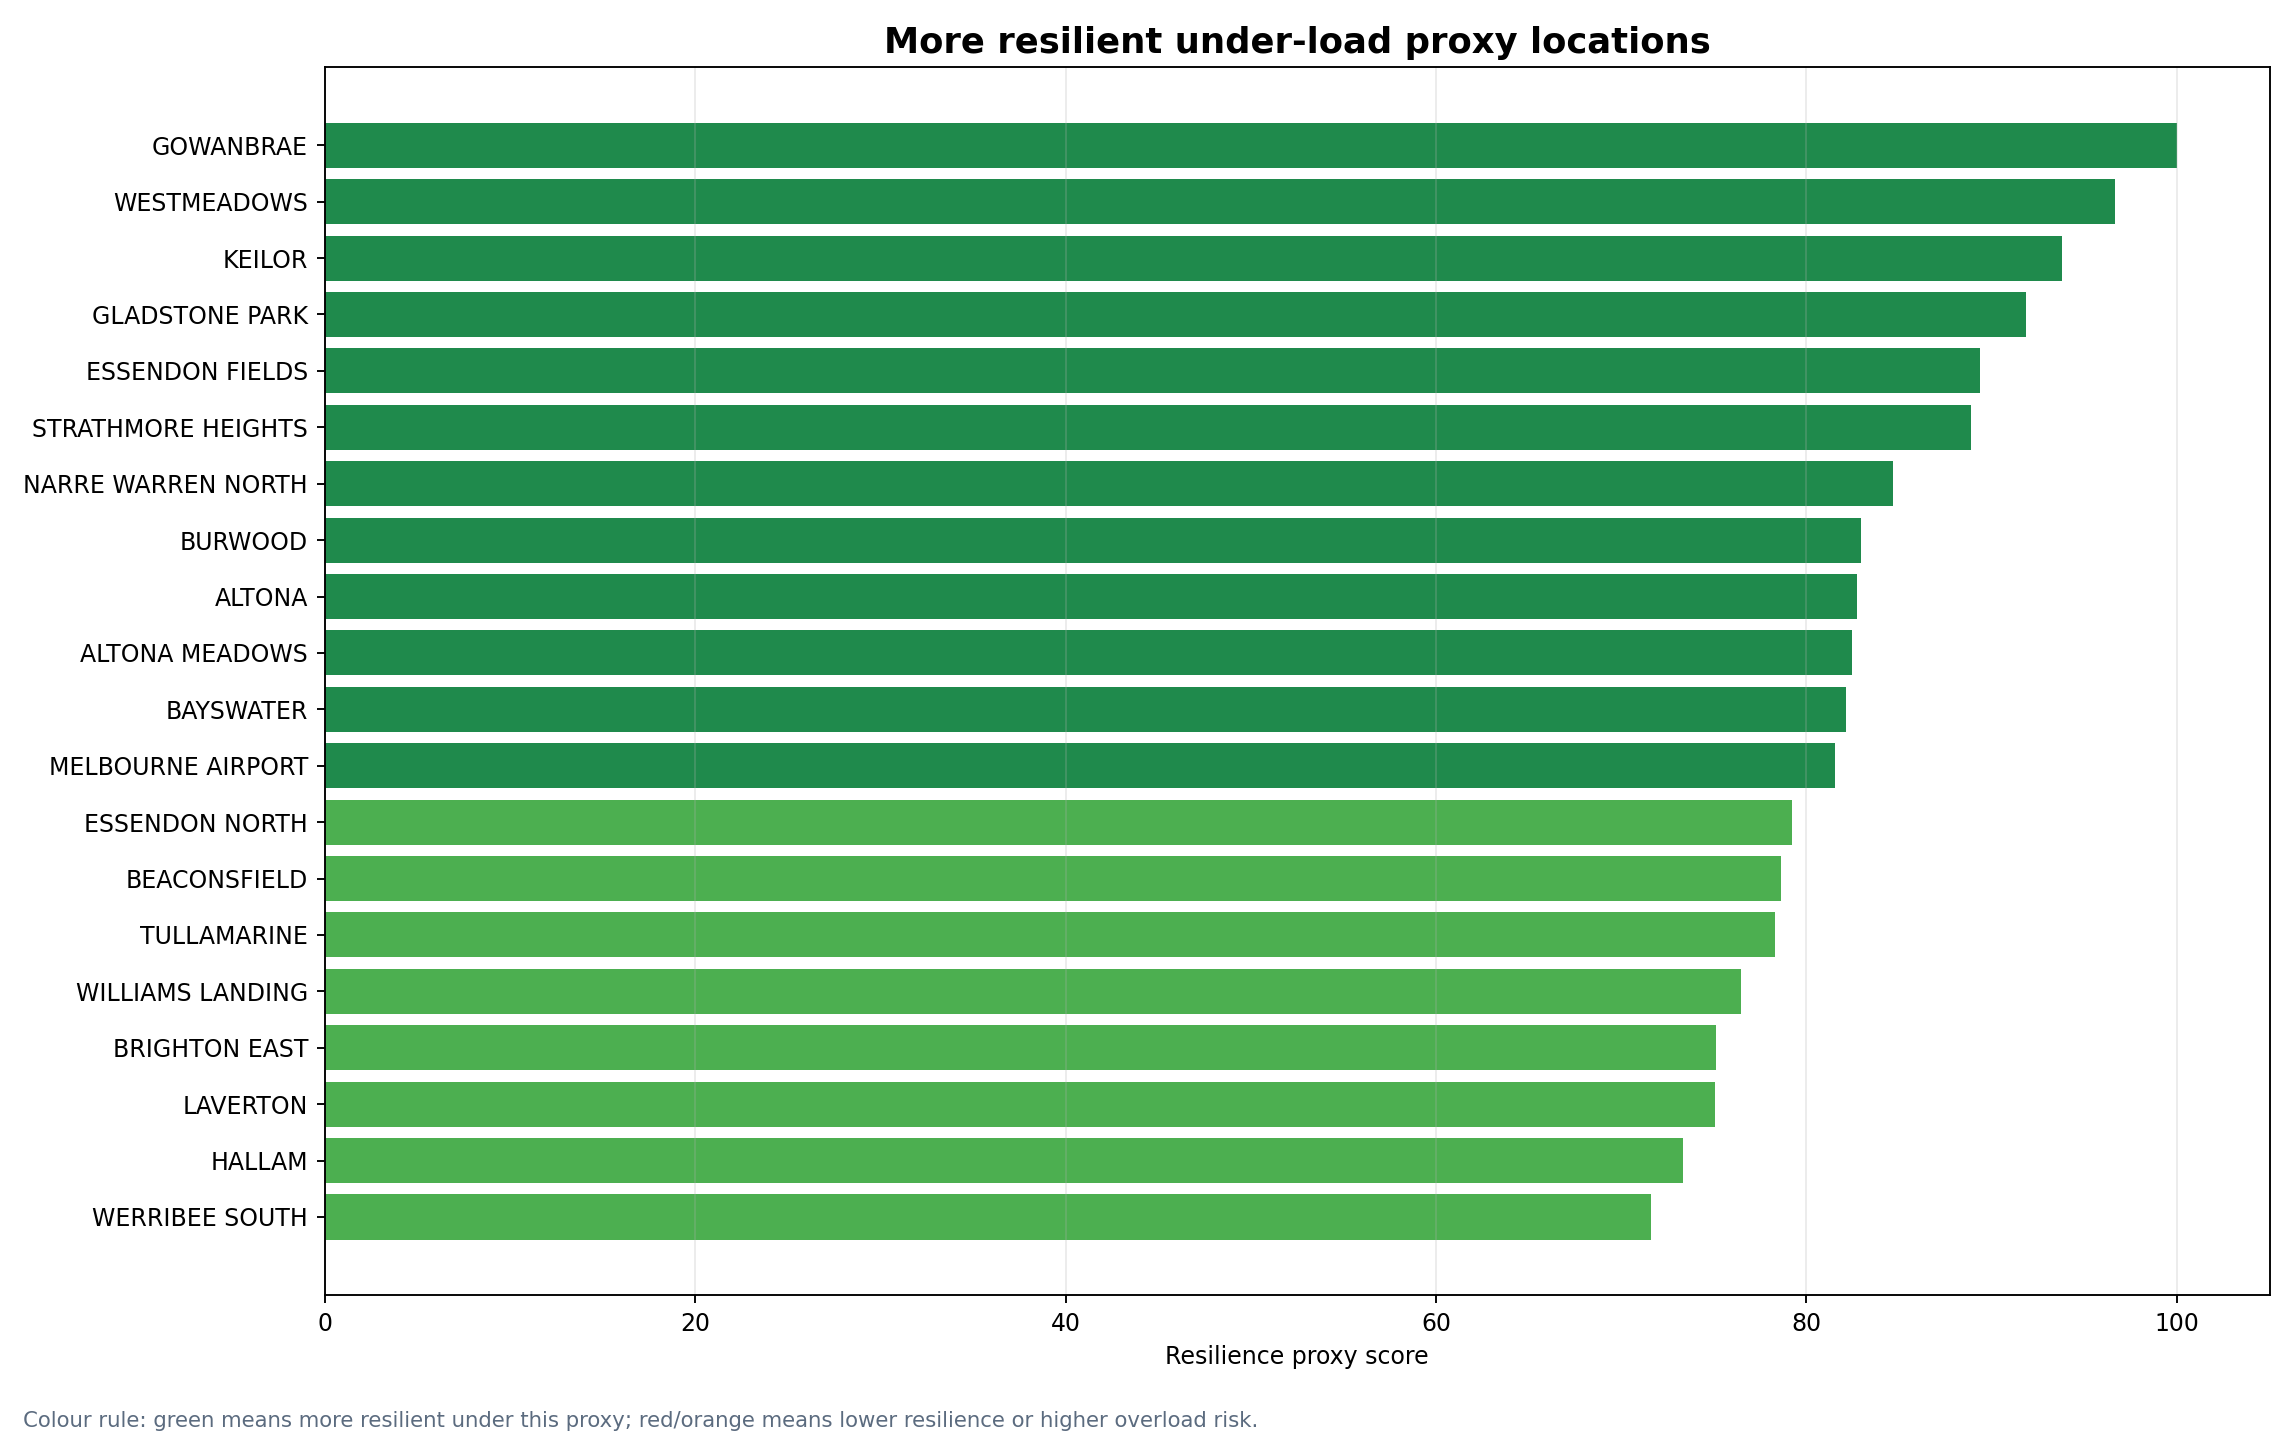
Network Resilience Under Load — Proxy
This is a first-pass resilience proxy. It is not a true operational resilience model.
More resilient under-load proxy
Strategic Rank
Suburb Locality
Resilience Proxy Score
Overload Risk Score
Strategic Pressure Score
Pressure Point Type
46.0
GOWANBRAE
100.0
2.7
2.7
Moderate combined pressure
45.0
WESTMEADOWS
96.7
5.4
5.4
Moderate combined pressure
44.0
KEILOR
93.8
7.8
7.2
Moderate combined pressure
43.0
GLADSTONE PARK
91.9
9.4
9.1
Moderate combined pressure
42.0
ESSENDON FIELDS
89.4
11.4
10.7
Moderate combined pressure
41.0
STRATHMORE HEIGHTS
88.9
11.8
11.2
Moderate combined pressure
39.0
NARRE WARREN NORTH
84.7
15.3
14.8
Moderate combined pressure
40.0
BURWOOD
82.9
16.7
14.6
Moderate combined pressure
37.0
ALTONA
82.7
16.9
16.5
Moderate combined pressure
36.0
ALTONA MEADOWS
82.5
17.1
16.6
Moderate combined pressure
38.0
BAYSWATER
82.2
17.3
16.0
Moderate combined pressure
35.0
MELBOURNE AIRPORT
81.5
17.8
17.5
Moderate combined pressure
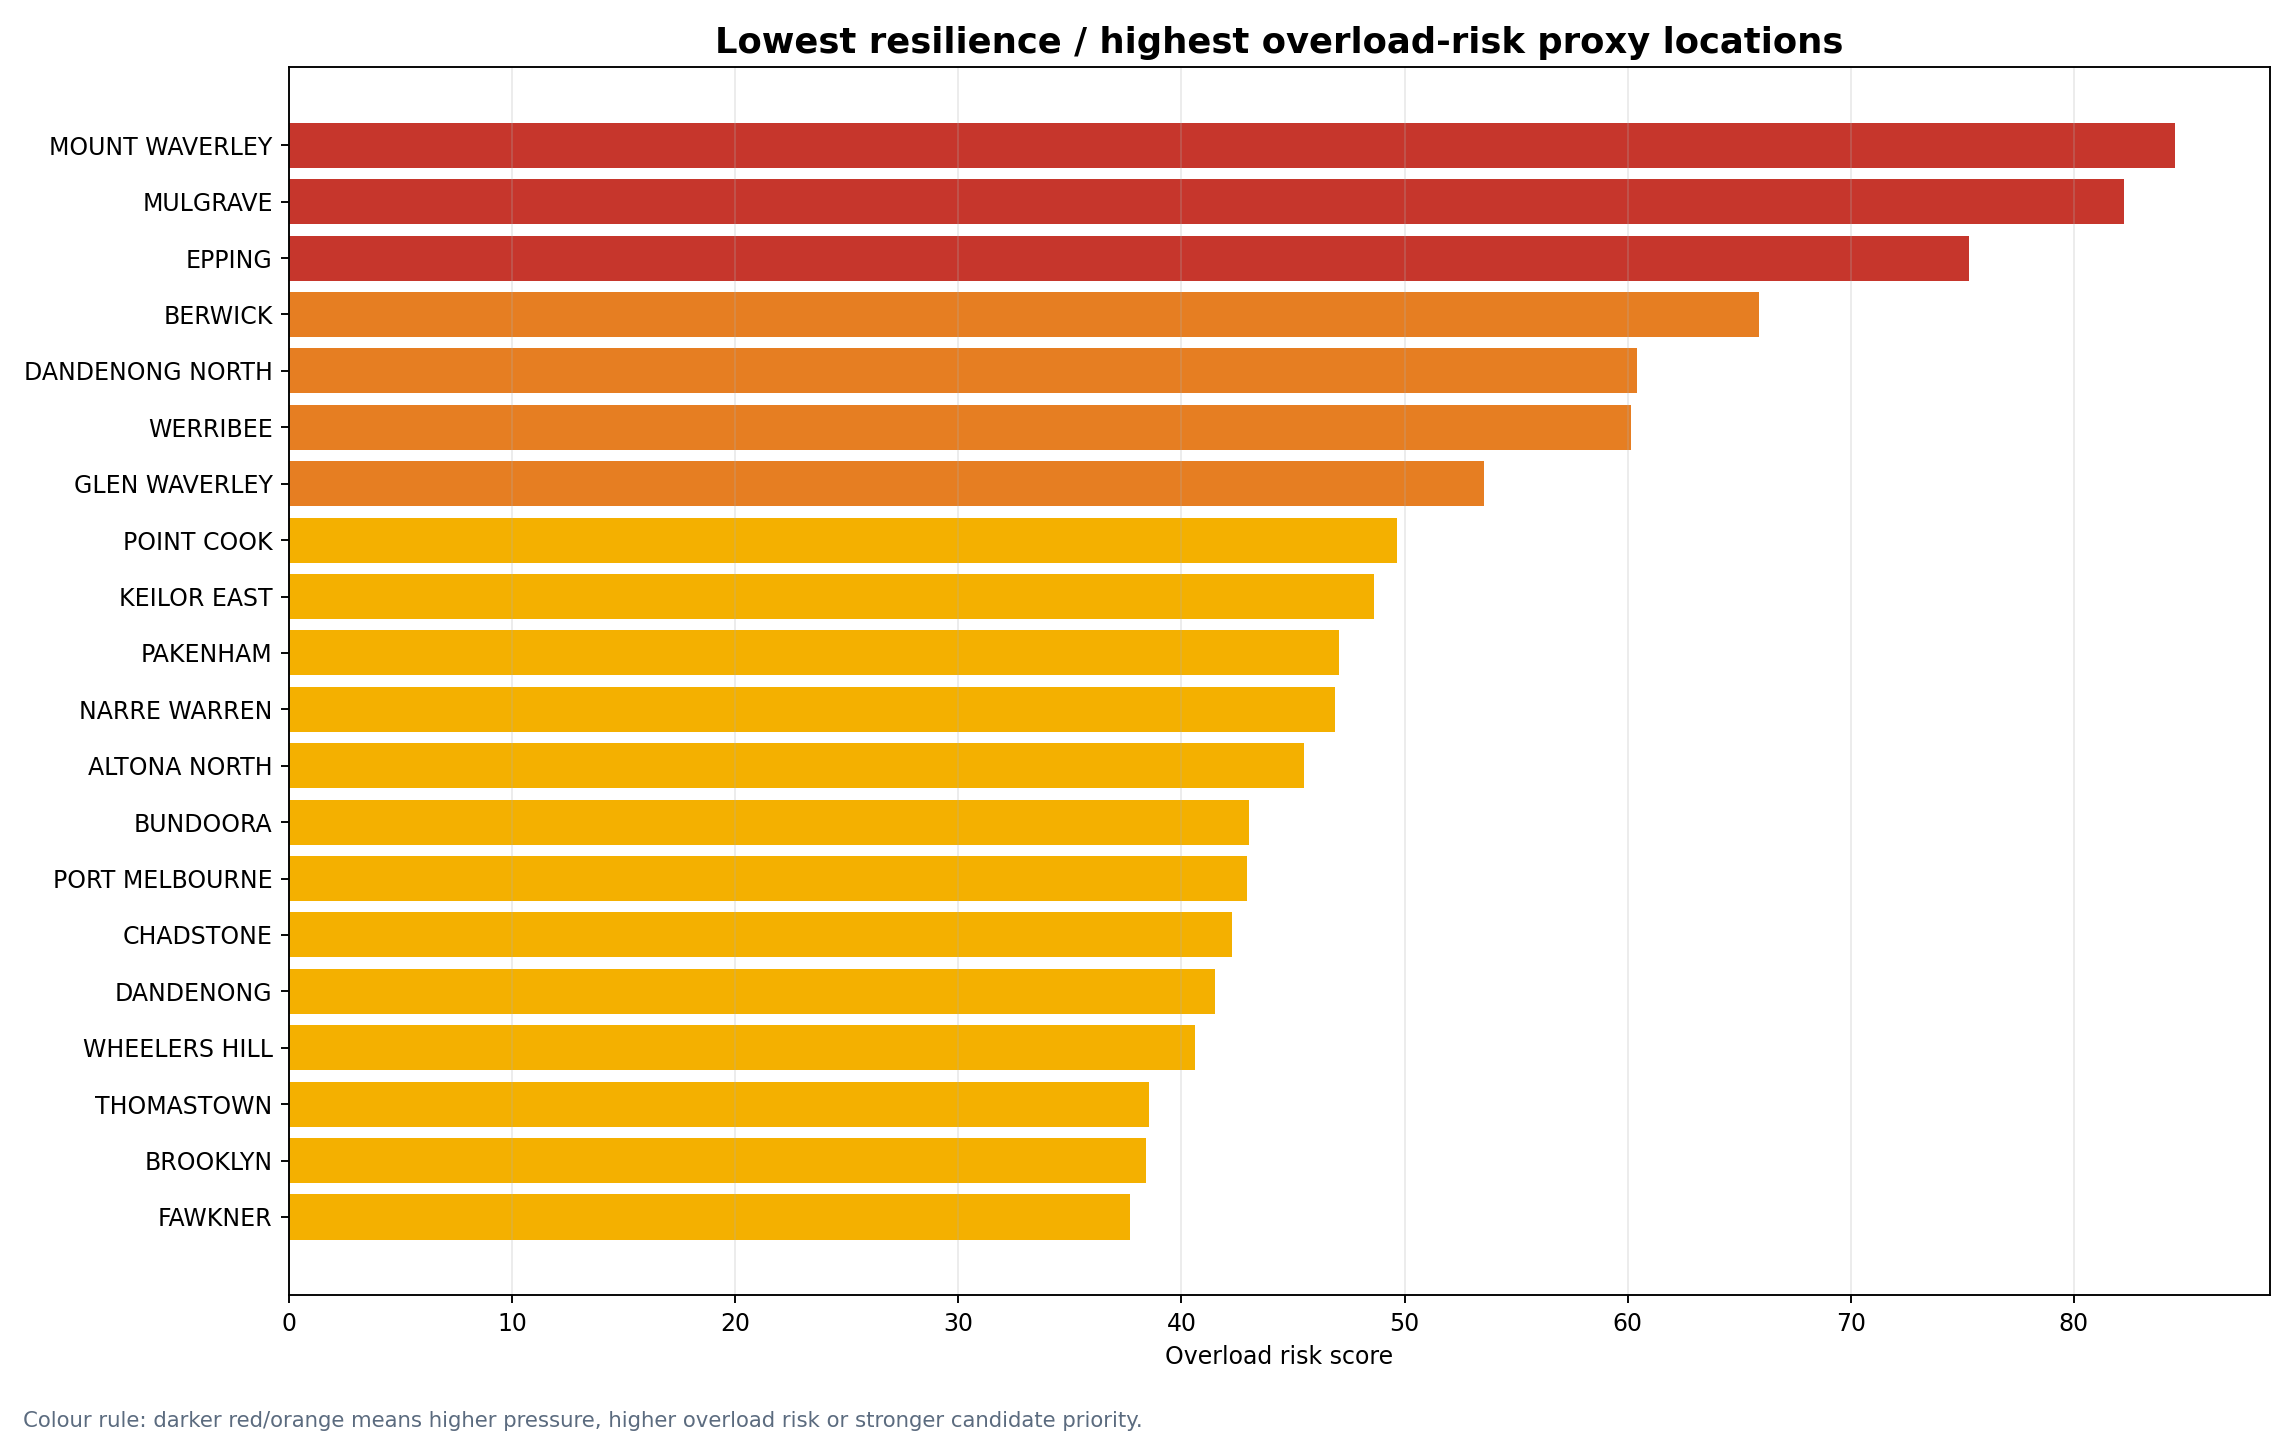
Lowest resilience / highest overload-risk proxy
Strategic Rank
Suburb Locality
Resilience Proxy Score
Overload Risk Score
Strategic Pressure Score
Pressure Point Type
1.0
MOUNT WAVERLEY
0.0
84.5
84.1
High total traffic + high truck pressure
2.0
MULGRAVE
2.8
82.3
81.7
Truck-heavy / freight-led pressure
3.0
EPPING
11.3
75.3
70.2
Commuter / general traffic-led pressure
4.0
BERWICK
22.8
65.9
65.4
Commuter / general traffic-led pressure
5.0
DANDENONG NORTH
29.5
60.4
60.4
Commercial freight pressure candidate
6.0
WERRIBEE
29.8
60.2
58.0
Commuter / general traffic-led pressure
7.0
GLEN WAVERLEY
37.9
53.6
51.7
Moderate combined pressure
8.0
POINT COOK
42.6
49.7
49.3
Moderate combined pressure
9.0
KEILOR EAST
43.9
48.6
47.5
Moderate combined pressure
11.0
PAKENHAM
45.8
47.1
46.4
Moderate combined pressure
10.0
NARRE WARREN
46.0
46.9
47.4
Moderate combined pressure
12.0
ALTONA NORTH
47.7
45.5
44.0
Moderate combined pressure
Strategic Freight Corridors
These corridors combine freight-money pressure, truck movements, truck share and timing risk.
Corridor Strategic Rank
Corridor Name
Corridor Type
Corridor Strategic Pressure Score
Freight Money Score
Truck Movements
Truck Pct
Worst Time Window
Best General Window
Commercial Label
1.0
M1 / Monash Freeway
Freeway / motorway corridor
88.5
80.3
103.23M
5.43
PM peak
Overnight / very early morning, especially around 03:00, subject to curfews, customer delivery windows, fatigue rules, noise restrictions and local access conditions
Very high freight commercial importance
2.0
Dohertys Road
Industrial / freight arterial
41.0
45.3
691,967
21.05
PM peak
Overnight / very early morning, especially around 03:00, subject to curfews, customer delivery windows, fatigue rules, noise restrictions and local access conditions
Moderate freight opportunity
3.0
Princes Freeway
Freeway / motorway corridor
32.4
37.4
23.21M
4.43
PM peak
Overnight / very early morning, especially around 03:00, subject to curfews, customer delivery windows, fatigue rules, noise restrictions and local access conditions
Lower freight commercial signal
4.0
Fitzgerald Road
Industrial / freight arterial
31.1
36.5
499,212
15.33
PM peak
Overnight / very early morning, especially around 03:00, subject to curfews, customer delivery windows, fatigue rules, noise restrictions and local access conditions
Lower freight commercial signal
5.0
M80 Ring Road
Freeway / motorway corridor
26.8
32.8
13.88M
5.35
PM peak
Overnight / very early morning, especially around 03:00, subject to curfews, customer delivery windows, fatigue rules, noise restrictions and local access conditions
Lower freight commercial signal
6.0
M8 / Western Freeway
Freeway / motorway corridor
24.8
31.0
481,105
10.55
PM peak
Overnight / very early morning, especially around 03:00, subject to curfews, customer delivery windows, fatigue rules, noise restrictions and local access conditions
Lower freight commercial signal
7.0
M31 / Hume Freeway
Freeway / motorway corridor
24.7
31.8
1.20M
9.60
PM peak
Overnight / very early morning, especially around 03:00, subject to curfews, customer delivery windows, fatigue rules, noise restrictions and local access conditions
Lower freight commercial signal
8.0
Grieve Parade
Industrial / freight arterial
24.6
28.4
284,033
13.18
PM peak
Overnight / very early morning, especially around 03:00, subject to curfews, customer delivery windows, fatigue rules, noise restrictions and local access conditions
Lower freight commercial signal
9.0
M1 / West Gate Bridge
Freeway / motorway corridor
22.1
29.6
2.29M
7.55
PM peak
Overnight / very early morning, especially around 03:00, subject to curfews, customer delivery windows, fatigue rules, noise restrictions and local access conditions
Lower freight commercial signal
10.0
Tullamarine Freeway
Freeway / motorway corridor
20.4
27.4
9.18M
3.52
PM peak
Overnight / very early morning, especially around 03:00, subject to curfews, customer delivery windows, fatigue rules, noise restrictions and local access conditions
Lower freight commercial signal
11.0
West Gate Tunnel / West Gate Corridor
Freeway / motorway corridor
19.8
27.4
2.85M
5.96
PM peak
Overnight / very early morning, especially around 03:00, subject to curfews, customer delivery windows, fatigue rules, noise restrictions and local access conditions
Lower freight commercial signal
12.0
Federation Trail / Fitzgerald Road
Industrial / freight arterial
15.8
22.6
561,904
6.64
PM peak
Overnight / very early morning, especially around 03:00, subject to curfews, customer delivery windows, fatigue rules, noise restrictions and local access conditions
Lower freight commercial signal
13.0
A1 Princes Highway
Arterial / monitored road corridor
15.4
20.0
92,000
6.94
PM peak
Overnight / very early morning, especially around 03:00, subject to curfews, customer delivery windows, fatigue rules, noise restrictions and local access conditions
Lower freight commercial signal
14.0
Calder Freeway
Freeway / motorway corridor
8.9
14.6
295,406
2.86
PM peak
Overnight / very early morning, especially around 03:00, subject to curfews, customer delivery windows, fatigue rules, noise restrictions and local access conditions
Lower freight commercial signal
15.0
Mountain Highway
Arterial / monitored road corridor
7.3
12.1
198,785
2.73
PM peak
Overnight / very early morning, especially around 03:00, subject to curfews, customer delivery windows, fatigue rules, noise restrictions and local access conditions
Lower freight commercial signal
16.0
Nepean Highway
Arterial / monitored road corridor
5.5
10.6
205,807
1.55
PM peak
Overnight / very early morning, especially around 03:00, subject to curfews, customer delivery windows, fatigue rules, noise restrictions and local access conditions
Lower freight commercial signal
17.0
Sydney Road
Arterial / monitored road corridor
4.1
8.5
141,665
1.34
PM peak
Overnight / very early morning, especially around 03:00, subject to curfews, customer delivery windows, fatigue rules, noise restrictions and local access conditions
Lower freight commercial signal
18.0
Princes Highway
Arterial / monitored road corridor
2.9
6.8
127,997
1.08
PM peak
Overnight / very early morning, especially around 03:00, subject to curfews, customer delivery windows, fatigue rules, noise restrictions and local access conditions
Lower freight commercial signal
19.0
Plenty Road
Arterial / monitored road corridor
2.8
6.5
115,599
1.16
PM peak
Overnight / very early morning, especially around 03:00, subject to curfews, customer delivery windows, fatigue rules, noise restrictions and local access conditions
Lower freight commercial signal
20.0
Burwood Highway
Arterial / monitored road corridor
0.9
3.6
55,766
0.78
PM peak
Overnight / very early morning, especially around 03:00, subject to curfews, customer delivery windows, fatigue rules, noise restrictions and local access conditions
Lower freight commercial signal
Newly Answerable Question Status
This new layer allows several previously unlinked questions from the SCATS + TIRTL question bank to become partial answers.
The new layer identifies failure-first proxy candidates using combined SCATS pressure, TIRTL truck pressure, freight timing risk and freight-money pressure. It is not a live failure prediction.
The new layer identifies locations where high SCATS pressure and high TIRTL truck pressure overlap, which are candidate congestion multipliers requiring validation.
This section adds the Version 2 TIRTL speed-flow analysis to the page. It uses 15-minute TIRTL speed, volume and truck-share observations to show how speed changes as traffic builds, when pressure is highest, where collapse signals appear, and which bridge direction appears more stable under load.
25,767 15-minute observations2 monitored TIRTL directionsAverage speed km/hVehicles per hourTruck-share intensityHistorical, not live prediction
Coverage and interpretation note
The current speed-flow database coverage is a West Gate Bridge two-direction dataset, not a full Melbourne-wide speed network. The charts are therefore best read as a directional West Gate Bridge speed-flow case study. The results show historical association and candidate pressure signals; they do not prove causality and are not live forecasts.
Avoid: confirmed incident, live prediction, guaranteed failure, citywide speed conclusion.
Observations analysed
25,767
15-minute TIRTL observations across the monitored West Gate Bridge directions.
Coverage
2 directions
West Gate Bridge inbound eastbound and outbound westbound direction records.
Strongest slowdown story
Friday PM
The speed heatmap shows the clearest low-speed band on Friday afternoon.
Highest pressure window
Weekday peaks
The pressure heatmap shows weekday pressure building from the morning and staying elevated into the PM peak.
Most stable direction
Inbound E
The stability-under-load chart shows inbound eastbound as the stronger stable-speed direction under this proxy.
Collapse candidate
Outbound W
The collapse-pressure chart shows outbound westbound as the stronger speed-collapse pressure candidate.
Headline speed-flow charts
These charts are the strongest public-facing outputs. They show the weekly rhythm of speed, pressure, volume and truck share on the monitored West Gate Bridge TIRTL directions.
Speed-flow pressure heatmap by day and time
Yellow/orange/red shows higher combined speed-flow pressure. Weekday pressure is visibly stronger than weekend pressure.
These charts compare the two monitored West Gate Bridge directions. They are useful as directional diagnostics, but should not be described as a Melbourne-wide ranking.
Speed collapse pressure candidates
Outbound westbound shows the stronger speed-collapse pressure signal under the current scoring model.
How does truck traffic influence freeway speeds? Uses truck-share intensity and speed association, not causation.
How do vehicle speeds change as traffic volumes increase? The speed-volume scatter and daily profile show the volume-speed relationship.
At what volume do speeds begin to collapse? The collapse-candidate chart and supporting output identify candidate volume thresholds.
Where does traffic slow first during peak periods? The slow-first directional comparison identifies stronger peak-period slowdown signals.
What is the relationship between volume and speed? The daily profile and scatter show speed falling as traffic pressure rises.
What traffic volumes trigger congestion conditions? The threshold candidate layer provides historical candidate trigger levels.
How quickly do speeds recover after peak congestion? The PM recovery chart provides a first recovery proxy.
Which locations maintain stable speeds under heavy load? The stable-under-load chart highlights the stronger stable direction.
Plain-English takeaway
The latest TIRTL speed-flow layer turns the page from a truck/freight exposure dashboard into a genuine speed-behaviour intelligence page for the West Gate Bridge. It shows when the bridge is under pressure, when speeds fall, how traffic volume and speed interact, and which monitored direction appears more vulnerable to collapse versus more stable under load.
This section adds three new public-facing intelligence layers: construction RDO effects on citywide SCATS daily movements,
historical 15-minute TIRTL worsening-risk patterns, and abnormal speed-flow episode detection on the West Gate Bridge TIRTL screenline.
It helps answer the remaining question-bank topics around incident-like traffic signatures, recovery duration, network worsening risk,
and non-standard calendar behaviour.
Important wording: these outputs identify historical abnormal speed-flow episodes, incident-like candidates,
and historical 15-minute worsening probabilities. They are not official incident records, not live predictions, and not proof of causation.
-0.75%
Construction RDO Monday effect
Average citywide SCATS Monday movement volume is only slightly lower on construction RDO Mondays than ordinary Mondays in the joined calendar sample.
15 min
Most common abnormal episode band
The abnormal-flow duration distribution is dominated by short same-day 15-minute episodes, with a smaller long tail.
0–25%
Public nowcast heatmap scale
The V2 heatmap uses a tighter scale so low-to-moderate historical worsening-risk variation is visible.
n≥20
Nowcast sample-size filter
Public highest-risk lookup rows are filtered to rows with at least 20 matching historical transitions.
Questions this section now helps answer:
How long do incident-like effects last? What patterns indicate incident-like traffic behaviour? Which locations show faster recovery?
What traffic conditions are historically more likely to worsen in the next 15 minutes? How do construction RDOs change citywide movement?
Construction RDO movement effects
The RDO charts show that construction RDO Mondays sit mostly inside the normal Monday range rather than fundamentally changing the citywide traffic pattern.
In this joined sample, construction RDO Mondays average about 135.8 million movements compared with about 136.9 million
on ordinary Mondays, a difference of roughly -0.75%.
Daily SCATS movements with construction RDOs highlighted
Shows ordinary daily movement totals with construction RDO dates overlaid. The low January points remain visible as seasonal/calendar effects.
The nowcast layer is a historical transition model. It asks: given the same TIRTL direction, day, time and current pressure band,
how often did traffic conditions worsen in the next 15 minutes? The heatmap is the safest public-facing view because it shows
broad day/time patterns rather than overclaiming individual low-sample lookup rows.
Historical 15-minute worsening probability by day and time
Yellow/orange/red means a higher historical probability that conditions worsen in the next 15 minutes.
Abnormal speed-flow episodes and incident-like candidates
This layer identifies baseline-deviation patterns such as speed drops, volume surges, and combined speed-drop/volume-surge episodes.
V2 splits abnormal episodes at midnight and when the abnormal episode type changes, which makes the duration outputs more credible for public use.
Abnormal speed-flow episode types
Classifies the main abnormal signatures: speed-drop episodes, volume-surge episodes, and combined speed-drop plus volume-surge episodes.
Methodology note: the abnormal-flow layer uses baseline deviation rather than official incident logs. The nowcast layer uses historical 15-minute transitions rather than live data.
Construction RDO analysis is based on the joined RDO calendar file; this V2 input did not contain public holiday rows, so the public-facing charts correctly focus on construction RDOs rather than public holidays.
Freight Pressure by Municipality: Which Melbourne Councils Carry the Heaviest Truck Exposure?
This first-pass municipality layer joins the TIRTL suburb/locality truck movement summary to local government areas,
making the page easier for councils, journalists, freight operators, planners and local residents to interpret.
This is a V1 rollup based on the current TIRTL suburb/locality summary table. Some Melbourne suburbs and localities
can cross municipal boundaries, and some combined source rows contain more than one locality. These rows are retained
with review notes in the lookup CSV so the municipality layer can be refined as the source data is cleaned.
Truck movements remain classified TIRTL movement records / passings, not unique trucks.
For councils
Identify where monitored truck movement, heavy-vehicle exposure and freight pressure concentrate inside local government areas.
For journalists
Turn the analysis into local stories: which councils carry the most freight pressure, truck share and corridor exposure?
For freight operators
See which municipal areas sit inside stronger truck movement and freight-exposure zones.
For SEO
Adds local-government search intent: truck movements by council, freight pressure by municipality and heavy vehicle exposure by LGA.
Top municipality groupings by TIRTL truck movement records — V1
Rank
Municipality / LGA grouping
Suburbs / localities
Site-headings
Vehicle movements
Truck movements
Truck %
Included suburbs/localities
1
Monash
5
91
766,435,510
50,418,255
6.58%
CHADSTONE; GLEN WAVERLEY; MOUNT WAVERLEY; MULGRAVE; WHEELERS HILL
2
Casey
6
116
680,833,414
28,672,950
4.21%
BERWICK; DOVETON; ENDEAVOUR HILLS; HALLAM; NARRE WARREN; NARRE WARREN NORTH
3
Wyndham
5
73
325,052,533
16,649,183
5.12%
LAVERTON NORTH; POINT COOK; WERRIBEE; WERRIBEE SOUTH; WILLIAMS LANDING
Freight Money Map: Where Transport Operators Can Save Time, Fuel and Dead Kilometres
This section translates TIRTL truck movement records, truck share, freight corridor rankings
and SCATS-style traffic pressure into a practical commercial signal for transport companies,
depot operators, trailer hire businesses, truck-service providers and logistics planners.
Dollar signs are a relative signal for commercial pressure or opportunity. They do not estimate exact revenue
or exact operating cost. They indicate where truck movement, freight dependence, route pressure and business
opportunity may be strongest.
🚚 Truck movement pressure💲 Freight money signal⛽ Fuel and delay exposure🏭 Depot and yard opportunity🛣️ Corridor pricing risk
How to read the money signal
The money signal is a relative commercial indicator. It combines truck movement,
truck share, freight-corridor importance and traffic-pressure context to show
where transport operators may face higher cost pressure or stronger business opportunity.
💲 Lower commercial signal💲💲 Moderate signal💲💲💲 High signal💲💲💲💲 Very high signal💲💲💲💲💲 Extreme signal
Highest Freight Cost Pressure
💲💲💲💲💲
Corridors where high truck movement, freeway dependency and traffic pressure may create expensive routing, timing and quoting mistakes.
Best Depot / Yard Opportunity
💲💲💲💲
Suburbs and corridors where transport operators may reduce dead kilometres by locating closer to freight-heavy movement patterns.
Truck Service Opportunity
💲💲💲💲
Areas where tyre shops, truck mechanics, diesel, trailer hire, wash bays, parking and support services may benefit from concentrated truck activity.
Route Pricing Risk
💲💲💲💲💲
Corridors where operators may need to quote carefully because delay, congestion, fuel burn or bridge/freeway dependency could affect margins.
Top Freight Money Corridors — V1
Rank
Corridor
Truck %
Truck Movements
Freight Money Score
Money Signal
Business Meaning
1
M1 / Monash Freeway Freeway / motorway corridor
5.43%
103,233,823
80.35
💲💲💲💲
M1 / Monash Freeway: high-value freight corridor for route planning, depot positioning and pricing discipline; large absolute truck movement volume may create operational cost exposure even when truck share is moderate; major freeway role makes it relevant for fleet routing and delivery-window planning.
2
Dohertys Road Industrial / freight arterial
21.05%
691,967
45.31
💲💲
Dohertys Road: mixed commercial signal; useful as supporting context rather than a headline freight-money zone; very high truck-share signal suggests a road function strongly tied to freight or industrial movement; industrial corridor signal may support depot, yard, trailer hire and truck-service decisions.
3
Princes Freeway Freeway / motorway corridor
4.43%
23,206,085
37.36
💲
Princes Freeway: lower commercial signal in the current V1 model; large absolute truck movement volume may create operational cost exposure even when truck share is moderate; major freeway role makes it relevant for fleet routing and delivery-window planning.
4
Fitzgerald Road Industrial / freight arterial
15.33%
499,212
36.46
💲
Fitzgerald Road: lower commercial signal in the current V1 model; very high truck-share signal suggests a road function strongly tied to freight or industrial movement; industrial corridor signal may support depot, yard, trailer hire and truck-service decisions.
5
M80 Ring Road Freeway / motorway corridor
5.35%
13,882,289
32.77
💲
M80 Ring Road: lower commercial signal in the current V1 model; large absolute truck movement volume may create operational cost exposure even when truck share is moderate; major freeway role makes it relevant for fleet routing and delivery-window planning.
6
M31 / Hume Freeway Freeway / motorway corridor
9.60%
1,200,348
31.75
💲
M31 / Hume Freeway: lower commercial signal in the current V1 model; elevated truck share suggests meaningful freight exposure; major freeway role makes it relevant for fleet routing and delivery-window planning.
7
M8 / Western Freeway Freeway / motorway corridor
10.55%
481,105
31.01
💲
M8 / Western Freeway: lower commercial signal in the current V1 model; elevated truck share suggests meaningful freight exposure.
8
M1 / West Gate Bridge Freeway / motorway corridor
7.55%
2,286,084
29.60
💲
M1 / West Gate Bridge: lower commercial signal in the current V1 model; elevated truck share suggests meaningful freight exposure; bridge or freeway dependency may increase route pricing risk; major freeway role makes it relevant for fleet routing and delivery-window planning.
Top Freight Money Corridors
Ranks monitored corridors by the V1 Freight Money Score.
Identify corridors where truck movement and traffic pressure may create costly stop-start driving, idling and inefficient routing.
🕒 Save driver hours
Use corridor and suburb pressure to plan delivery windows and reduce time lost in freight-heavy or congestion-sensitive areas.
🏭 Reduce dead kilometres
Compare truck-heavy suburbs and corridors when choosing depots, yards, trailer storage locations or cross-dock sites.
🧾 Quote jobs more accurately
Use route pricing risk signals to avoid underquoting freight runs through expensive corridors or bridge-dependent routes.
🔧 Find truck-service opportunities
Identify areas where mechanics, tyre shops, diesel, trailer hire, parking or wash bays may benefit from concentrated truck movement.
📦 Spot backload zones
Use truck movement concentration as an early signal for possible freight activity, return-load opportunity and logistics demand.
V1 methodology note:
The Freight Money Score is a relative commercial index, not a precise financial estimate.
This first version combines TIRTL truck movement volume, TIRTL truck share, existing freight corridor score,
a SCATS-style traffic-pressure proxy and monitored corridor coverage.
Later versions can add real SCATS corridor joins, depot locations, industrial zoning, travel-time data,
fuel assumptions, driver-hour cost and customer delivery-window behaviour.
Download Freight Money Corridor Index CSV
Ranked corridor-level commercial freight signal output.
Freight Money Suburbs: Depot, Yard, Service and Dead-Kilometre Opportunity
This suburb/locality index translates TIRTL truck movement records and truck share into a place-based
commercial signal for transport companies, trailer hire businesses, depot operators, truck-service providers
and logistics planners.
Corridor rankings show where money may leak on the road. Suburb rankings show where operators may position yards,
depots, services, advertising and customer operations to reduce dead kilometres or capture freight demand.
🏭 Depot and yard opportunity🔧 Truck service demand🚚 Local truck pressure📦 Backload potential💲 Commercial freight signal
Depot / Yard Shortlisting
🏭 💲💲💲💲
Identify suburbs/localities with strong truck movement and freight exposure for yard, depot or trailer storage investigation.
Truck-Service Opportunity
🔧 💲💲💲💲
Find areas where mechanics, tyre shops, diesel, wash bays, parking and trailer support services may have stronger demand.
Dead-Kilometre Reduction
⛽ 💲💲💲
Compare high truck-pressure suburbs when choosing operating bases closer to actual freight movement patterns.
Customer Targeting
📦 💲💲💲
Use local truck movement concentration as a lead-generation signal for freight-adjacent business opportunities.
Top Freight Money Suburbs / Localities — V1
Rank
Suburb / Locality
Truck %
Truck Movements
Site-Headings
Freight Money Score
Money Signal
Business Meaning
1
MULGRAVE
6.47%
18,308,122
32
83.15
💲💲💲💲
MULGRAVE: very strong suburb-level freight signal worth investigating for commercial transport operations; very high absolute truck movement records suggest significant freight activity; elevated truck share suggests useful heavy-vehicle exposure; broad monitored coverage improves confidence in the suburb-level signal.
2
MOUNT WAVERLEY
6.52%
16,215,466
31
75.13
💲💲💲💲
MOUNT WAVERLEY: very strong suburb-level freight signal worth investigating for commercial transport operations; very high absolute truck movement records suggest significant freight activity; elevated truck share suggests useful heavy-vehicle exposure; broad monitored coverage improves confidence in the suburb-level signal.
3
DANDENONG NORTH
5.16%
13,895,561
40
74.45
💲💲💲💲
DANDENONG NORTH: very strong suburb-level freight signal worth investigating for commercial transport operations; very high absolute truck movement records suggest significant freight activity; elevated truck share suggests useful heavy-vehicle exposure; broad monitored coverage improves confidence in the suburb-level signal.
4
BERWICK
4.53%
8,650,475
44
60.52
💲💲💲
BERWICK: high freight opportunity area that may support fleet, service, depot or customer-location decisions; strong truck movement volume suggests meaningful freight exposure; broad monitored coverage improves confidence in the suburb-level signal.
V1 methodology note:
The Freight Money Suburb Score is a relative commercial index, not a precise financial estimate.
It combines TIRTL truck movement volume, TIRTL truck share, monitored site-heading coverage,
a SCATS-style pressure proxy and a simple industrial/corridor context heuristic.
Later versions should join real SCATS suburb pressure, industrial zoning, depot locations, travel-time data,
fuel assumptions and driver-hour costs.
Download Freight Money Suburb Index CSV
Ranked suburb/locality-level commercial freight signal output.
This table ranks monitored TIRTL site-headings by absolute truck movement records.
Important terminology:
Vehicle movements and truck movements are classified TIRTL sensor movement records / passings. They are not counts of unique vehicles or unique trucks.
Rank
Source site
Heading
Site name
Suburb / locality
Truck movements
Vehicle movements
Truck %
1
505
W
M1 West Gate Bridge Outbound (WB)
PORT MELBOURNE
1,279,880
17,066,572
7.50%
2
107
E
M80 Outbound - Keilor park off ramp (EB)
KEILOR EAST
1,272,856
17,302,546
7.36%
3
167
E
M1 Outbound - CH 18380
MOUNT WAVERLEY
1,209,351
19,415,956
6.23%
4
147
E
M1 Outbound - CH 17000
CHADSTONE
1,200,342
17,724,927
6.77%
5
145
E
M1 Outbound - CH 16520
CHADSTONE
1,197,019
17,745,239
6.75%
6
173
E
M1 Outbound - CH 19890
MOUNT WAVERLEY
1,194,271
19,228,540
6.21%
7
149
E
M1 Outbound - CH 17390
MOUNT WAVERLEY
1,190,965
17,728,412
6.72%
8
166
W
M1 Inbound - CH 18380
MOUNT WAVERLEY
1,189,906
18,524,173
6.42%
9
112
W
M80 Inbound - Keilor Park Drive Exit (WB)
KEILOR EAST
1,186,846
16,041,476
7.40%
10
169
E
M1 Outbound - CH 18980
MOUNT WAVERLEY
1,186,140
18,357,954
6.46%
11
144
W
M1 Inbound - CH 16520
CHADSTONE
1,182,888
17,214,138
6.87%
12
146
W
M1 Inbound - CH 17000
CHADSTONE
1,182,042
17,136,731
6.90%
13
172
W
M1 Inbound - CH 19890
MOUNT WAVERLEY
1,181,165
18,004,319
6.56%
14
148
W
M1 Inbound - CH 17390
MOUNT WAVERLEY
1,180,759
17,152,618
6.88%
15
171
E
M1 Outbound - CH 19450
MOUNT WAVERLEY
1,180,049
18,125,865
6.51%
16
170
W
M1 Inbound - CH 19450
MOUNT WAVERLEY
1,170,723
17,291,969
6.77%
17
179
E
M1 Outbound - CH 21190
GLEN WAVERLEY
1,148,063
18,212,169
6.30%
18
177
E
M1 Outbound - CH 20770
GLEN WAVERLEY
1,133,455
17,245,052
6.57%
19
189
E
M1 Outbound - CH 23810
WHEELERS HILL
1,132,554
18,069,681
6.27%
20
175
E
M1 Outbound - CH 20300
MOUNT WAVERLEY
1,128,484
17,237,782
6.55%
21
178
W
M1 Inbound - CH 21190
GLEN WAVERLEY
1,126,227
17,342,769
6.49%
22
187
E
M1 Outbound - CH 23270
WHEELERS HILL
1,125,647
18,044,559
6.24%
23
176
W
M1 Inbound - CH 20770
GLEN WAVERLEY
1,117,461
16,325,060
6.85%
24
186
W
M1 Inbound - CH 23280
MULGRAVE
1,115,404
17,337,947
6.43%
25
194
W
M1 Inbound - CH 25280
MULGRAVE
1,112,867
17,789,101
6.26%
26
199
W
M1 Inbound - CH 26900
MULGRAVE
1,106,614
16,343,283
6.77%
27
197
W
M1 Inbound - CH 26380
MULGRAVE
1,105,606
16,312,776
6.78%
28
196
E
M1 Outbound - CH 25820
MULGRAVE
1,098,086
17,556,746
6.25%
29
142
W
M1 Inbound - CH 15860
CHADSTONE
1,096,973
13,883,747
7.90%
30
143
E
M1 Outbound - CH 15860
CHADSTONE
1,092,548
13,776,631
7.93%
31
222
E
M1 Outbound - CH 25400
MULGRAVE
1,090,277
17,457,999
6.25%
32
185
E
M1 Outbound - CH 22800
WHEELERS HILL
1,083,664
15,998,300
6.77%
33
183
E
M1 Outbound - CH 22300
MULGRAVE
1,083,455
16,008,345
6.77%
34
108
E
M80 Outbound - Keilor Park Drive Exit (EB)
KEILOR EAST
1,079,310
14,317,140
7.54%
35
191
E
M1 Outbound - CH 24340
WHEELERS HILL
1,075,784
16,205,805
6.64%
36
190
W
M1 Inbound - CH 24210
MULGRAVE
1,074,860
15,736,433
6.83%
37
184
W
M1 Inbound - CH 22800
MULGRAVE
1,073,162
15,288,314
7.02%
38
181
E
M1 Outbound - CH 21780
MULGRAVE
1,072,046
15,914,184
6.74%
39
174
W
M1 Inbound - CH 20300
MOUNT WAVERLEY
1,067,513
15,583,765
6.85%
40
180
W
M1 Inbound - CH 21780
MULGRAVE
1,065,910
15,315,702
6.96%
41
182
W
M1 Inbound - CH 22300
MULGRAVE
1,060,880
15,196,489
6.98%
42
195
W
M1 Inbound - CH 25820
MULGRAVE
1,046,615
17,047,638
6.14%
43
192
E
M1 Outbound - CH 24900
MULGRAVE
1,044,230
17,055,565
6.12%
44
168
W
M1 Inbound - CH 18990
MOUNT WAVERLEY
1,020,365
15,170,054
6.73%
45
193
W
M1 Inbound - CH 24720
MULGRAVE
1,013,189
15,102,021
6.71%
46
580
E
M1 Monash Hwy - Stanley Outbound
MOUNT WAVERLEY
1,011,174
16,310,009
6.20%
47
504
E
M1 West Gate Bridge Inbound (EB)
PORT MELBOURNE
1,006,179
13,231,650
7.60%
48
581
W
M1 Monash Fwy - Stanley Inbound
MOUNT WAVERLEY
957,832
14,863,243
6.44%
49
225
E
M80 - WRR East of Kathryn St GB
FAWKNER
938,521
11,778,243
7.97%
50
24
W
M1 Inbound - Under Power Rd Overpass
DOVETON
904,941
19,460,223
4.65%
51
26
W
M1 Inbound - Before Heatherton Rd Exit
DOVETON
903,284
19,411,352
4.65%
52
223
E
M80 - WRR Kathryn St GB
FAWKNER
901,335
11,498,446
7.84%
53
16
W
M1 Inbound - Just Before Stud Rd Exit Ramp
DANDENONG NORTH
899,242
18,355,817
4.90%
54
25
E
M1 Outbound - Under Power Rd Overpass
ENDEAVOUR HILLS
883,752
18,403,669
4.80%
55
18
W
M1 Inbound - After Heatherton Rd Entry Ramp
DOVETON
881,776
18,119,684
4.87%
56
22
W
M1 Inbound - Heatherton Rd Exit Ramp
DOVETON
879,458
16,876,200
5.21%
57
23
E
M1 Outbound - Heatherton Rd Entry Ramp
DOVETON
867,087
16,115,868
5.38%
58
229
E
M80 - WRR East of Merri Creek GB
THOMASTOWN
854,250
13,651,274
6.26%
59
110
E
M80 Outbound - Beneath Gantry 153 (EB)
KEILOR EAST
851,748
11,460,985
7.43%
60
8
W
M1 Inbound - After Brady Rd
DANDENONG NORTH
848,790
16,903,583
5.02%
61
6
W
M1 Inbound - Before Police Rd Exit Ramp
DANDENONG NORTH
839,620
16,835,971
4.99%
62
12
W
M1 Inbound - Stud Rd Entry Ramp Bullnose
DANDENONG NORTH
836,822
15,599,108
5.36%
63
14
W
M1 Inbound - Stud Rd off ramp
DANDENONG NORTH
833,346
15,501,113
5.38%
64
188
W
M1 Inbound - CH 23810
MULGRAVE
830,986
13,040,512
6.37%
65
9
E
M1 Outbound - McGregor entry
DANDENONG NORTH
829,425
16,089,896
5.15%
66
21
E
M1 Outbound - Heatherton Rd Exit Ramp
ENDEAVOUR HILLS
825,863
15,700,835
5.26%
67
7
E
M1 Outbound - Before Stud Rd Exit Ramp
DANDENONG NORTH
822,929
16,032,027
5.13%
68
17
E
M1 Outbound - Just After Stud Rd Entry Ramp
DANDENONG NORTH
822,615
16,484,635
4.99%
69
13
E
M1 Outbound - Stud Road On Ramp
DANDENONG NORTH
819,032
14,950,485
5.48%
70
114
W
M80 Inbound - Altona bound EJ Whitten bridge (WB)
KEILOR EAST
766,865
10,977,123
6.99%
71
565
E
WGT - Inbound Main Carriageway
BROOKLYN
732,299
10,947,370
6.69%
72
226
W
M80 - WRR East of Kathryn St AB
FAWKNER
731,009
10,935,230
6.68%
73
566
E
WGT - Inbound Main Carriageway
BROOKLYN
725,305
10,969,267
6.61%
74
3
E
M1 Outbound - Eastlink Interchange
DANDENONG NORTH
670,623
13,476,081
4.98%
75
5
E
M1 Outbound - Eastlink Interchange
DANDENONG NORTH
668,504
13,548,932
4.93%
76
198
E
M1 Outbound - CH 26380
MULGRAVE
657,440
12,246,493
5.37%
77
202
E
M1 Outbound - CH 27230
DANDENONG NORTH
656,725
12,254,639
5.36%
78
200
E
M1 Outbound - CH 26830
MULGRAVE
656,493
12,227,624
5.37%
79
203
E
M1 Outbound - CH 27560
DANDENONG NORTH
656,143
12,247,050
5.36%
80
2
W
M1 IB west of Eastlink
DANDENONG NORTH
654,638
12,487,194
5.24%
81
15
E
M1 Outbound - First after Stud Rd onramp
DANDENONG NORTH
649,986
13,408,160
4.85%
82
4
W
M1 Inbound - Eastlink Interchange
DANDENONG NORTH
649,471
12,406,858
5.23%
83
336
W
PFW 125m East of Kororoit Creek Road (OB)
ALTONA NORTH
649,342
13,226,915
4.91%
84
204
W
M1 Inbound - CH 27700
DANDENONG NORTH
616,500
11,828,248
5.21%
85
531
S
M31 Hume Fwy and Cooper St (SB)
EPPING
603,672
6,384,687
9.45%
86
530
N
M31 Hume Fwy and Cooper St (NB)
EPPING
596,676
6,120,003
9.75%
87
281
E
PFW 870m West of Forsyth Road IB
POINT COOK
589,802
13,079,174
4.51%
88
292
E
PFW 1280m West of Kororoit Creek Road (IB)
LAVERTON
571,794
16,369,019
3.49%
89
311
E
PFW 780m East of High Street/Newland St Entry Exit Ramps (IB)
LAVERTON
570,492
16,396,546
3.48%
90
334
W
PFW 1280m West of Kororoit Creek Road (OB)
ALTONA
565,298
16,163,919
3.50%
91
314
W
PFW 240m East of Duncans Road (OB)
WERRIBEE SOUTH
564,446
7,517,219
7.51%
92
289
E
PFW Between High Street/Newland St Entry Exit Ramps (IB)
LAVERTON
563,883
15,702,201
3.59%
93
20
W
M1 Inbound - Heatherton Rd Entry Ramp Bullnose
DOVETON
557,111
11,828,301
4.71%
94
111
W
M80 Inbound - Keilor park exit Altona bound (WB)
KEILOR EAST
554,760
7,867,129
7.05%
95
330
W
PFW 510m West of High Street/Newland St (OB)
ALTONA MEADOWS
554,466
15,785,391
3.51%
96
288
E
PFW 510m West of High Street/Newland St (IB)
LAVERTON
551,191
15,737,447
3.50%
97
312
E
PFW 125m East of Kororoit Creek Road (IB)
LAVERTON NORTH
545,855
12,831,818
4.25%
98
282
E
PFW 210m West of Forsyth Road (IB)
POINT COOK
543,690
11,661,332
4.66%
99
27
E
M1 Outbound - After Heatherton Rd
ENDEAVOUR HILLS
543,234
11,063,549
4.91%
100
230
W
M80 - WRR East of Merri Creek AB
THOMASTOWN
542,399
9,074,883
5.98%
Truck-Share Ranking
Top TIRTL sites by truck share
This table ranks monitored TIRTL site-headings by truck share.
Important terminology:
Vehicle movements and truck movements are classified TIRTL sensor movement records / passings. They are not counts of unique vehicles or unique trucks.
Rank
Source site
Heading
Site name
Suburb / locality
Truck %
Truck movements
Vehicle movements
1
264
W
Dohertys Rd (WB)
ALTONA NORTH
22.46%
354,021
1,576,084
2
263
E
Dohertys Rd (EB)
ALTONA NORTH
19.75%
337,946
1,710,707
3
256
S
Fitzgerald Rd and Federation trail (SB)
LAVERTON NORTH
15.34%
259,000
1,688,563
4
255
N
Fitzgerald Rd and Federation trail (NB)
LAVERTON NORTH
15.32%
240,168
1,567,558
5
261
N
Grieve Pde (NB)
ALTONA NORTH
14.90%
149,156
1,001,051
6
262
S
Grieve Pde (SB)
ALTONA NORTH
11.69%
134,877
1,154,186
7
555
E
M8 Western Fwy - Ballan Inbound (EB)
BALLAN
10.58%
240,867
2,277,368
8
556
W
M8 Western Fwy - Ballan Outbound (WB)
BALLAN
10.52%
240,238
2,283,298
9
530
N
M31 Hume Fwy and Cooper St (NB)
EPPING
9.75%
596,676
6,120,003
10
531
S
M31 Hume Fwy and Cooper St (SB)
EPPING
9.45%
603,672
6,384,687
11
568
E
WGT - Inbound M80 Ring Rd to Eastbound Main Carriageway
LAVERTON NORTH
8.75%
414,662
4,738,211
12
225
E
M80 - WRR East of Kathryn St GB
FAWKNER
7.97%
938,521
11,778,243
13
143
E
M1 Outbound - CH 15860
CHADSTONE
7.93%
1,092,548
13,776,631
14
142
W
M1 Inbound - CH 15860
CHADSTONE
7.90%
1,096,973
13,883,747
15
223
E
M80 - WRR Kathryn St GB
FAWKNER
7.84%
901,335
11,498,446
16
109
W
M80 Inbound - Just before Keilor Park on ramp (WB)
KEILOR EAST
7.67%
461,971
6,025,470
17
504
E
M1 West Gate Bridge Inbound (EB)
PORT MELBOURNE
7.60%
1,006,179
13,231,650
18
108
E
M80 Outbound - Keilor Park Drive Exit (EB)
KEILOR EAST
7.54%
1,079,310
14,317,140
19
314
W
PFW 240m East of Duncans Road (OB)
WERRIBEE SOUTH
7.51%
564,446
7,517,219
20
505
W
M1 West Gate Bridge Outbound (WB)
PORT MELBOURNE
7.50%
1,279,880
17,066,572
21
110
E
M80 Outbound - Beneath Gantry 153 (EB)
KEILOR EAST
7.43%
851,748
11,460,985
22
112
W
M80 Inbound - Keilor Park Drive Exit (WB)
KEILOR EAST
7.40%
1,186,846
16,041,476
23
201
W
M1 Inbound - CH 27230
DANDENONG NORTH
7.38%
264,428
3,582,513
24
107
E
M80 Outbound - Keilor park off ramp (EB)
KEILOR EAST
7.36%
1,272,856
17,302,546
25
113
E
M80 Outbound - Before Calder Fwy exit (EB)
KEILOR EAST
7.23%
469,836
6,495,853
26
338
E
M1 Outbound - CH 960 (FDS01a)
PAKENHAM
7.20%
348,117
4,832,563
27
337
W
M1 Inbound - CH 960 (FDS01b)
PAKENHAM
7.12%
363,949
5,110,607
28
102
E
M1 Outbound - RCB25164 Just Before Koo Wee Rup Rd (FDS03a)
PAKENHAM
7.06%
365,674
5,178,329
29
111
W
M80 Inbound - Keilor park exit Altona bound (WB)
KEILOR EAST
7.05%
554,760
7,867,129
30
340
E
M1 Outbound - CH 1460 (FDS02a)
PAKENHAM
7.03%
363,908
5,176,596
31
184
W
M1 Inbound - CH 22800
MULGRAVE
7.02%
1,073,162
15,288,314
32
569
W
A1 Princes Hwy - Lindenow South Westbound
LINDENOW SOUTH
7.01%
46,696
665,853
33
114
W
M80 Inbound - Altona bound EJ Whitten bridge (WB)
KEILOR EAST
6.99%
766,865
10,977,123
34
182
W
M1 Inbound - CH 22300
MULGRAVE
6.98%
1,060,880
15,196,489
35
180
W
M1 Inbound - CH 21780
MULGRAVE
6.96%
1,065,910
15,315,702
36
101
W
M1 Inbound - RCB25164 Just After Koo Wee Rup Rd (FDS03b)
PAKENHAM
6.92%
374,051
5,401,462
37
146
W
M1 Inbound - CH 17000
CHADSTONE
6.90%
1,182,042
17,136,731
38
148
W
M1 Inbound - CH 17390
MOUNT WAVERLEY
6.88%
1,180,759
17,152,618
39
144
W
M1 Inbound - CH 16520
CHADSTONE
6.87%
1,182,888
17,214,138
40
570
E
A1 Princes Hwy - Lindenow South Eastbound
LINDENOW SOUTH
6.87%
45,304
659,874
41
339
W
M1 Inbound - CH 1460 (FDS02b)
PAKENHAM
6.86%
370,057
5,396,470
42
251
E
Princes Hwy and Federation Trail (EB)
BROOKLYN
6.85%
298,073
4,348,692
43
174
W
M1 Inbound - CH 20300
MOUNT WAVERLEY
6.85%
1,067,513
15,583,765
44
176
W
M1 Inbound - CH 20770
GLEN WAVERLEY
6.85%
1,117,461
16,325,060
45
190
W
M1 Inbound - CH 24210
MULGRAVE
6.83%
1,074,860
15,736,433
46
197
W
M1 Inbound - CH 26380
MULGRAVE
6.78%
1,105,606
16,312,776
47
185
E
M1 Outbound - CH 22800
WHEELERS HILL
6.77%
1,083,664
15,998,300
48
147
E
M1 Outbound - CH 17000
CHADSTONE
6.77%
1,200,342
17,724,927
49
199
W
M1 Inbound - CH 26900
MULGRAVE
6.77%
1,106,614
16,343,283
50
170
W
M1 Inbound - CH 19450
MOUNT WAVERLEY
6.77%
1,170,723
17,291,969
51
183
E
M1 Outbound - CH 22300
MULGRAVE
6.77%
1,083,455
16,008,345
52
99
E
M1 Outbound - RCB1413 McGregor Rd Exit Bullnose
PAKENHAM
6.75%
271,498
4,024,052
53
145
E
M1 Outbound - CH 16520
CHADSTONE
6.75%
1,197,019
17,745,239
54
181
E
M1 Outbound - CH 21780
MULGRAVE
6.74%
1,072,046
15,914,184
55
168
W
M1 Inbound - CH 18990
MOUNT WAVERLEY
6.73%
1,020,365
15,170,054
56
149
E
M1 Outbound - CH 17390
MOUNT WAVERLEY
6.72%
1,190,965
17,728,412
57
193
W
M1 Inbound - CH 24720
MULGRAVE
6.71%
1,013,189
15,102,021
58
162
N
Tullamarine FWY Outbound - After Terminal Dr Exit (NB)
MELBOURNE AIRPORT
6.70%
123,225
1,838,879
59
565
E
WGT - Inbound Main Carriageway
BROOKLYN
6.69%
732,299
10,947,370
60
226
W
M80 - WRR East of Kathryn St AB
FAWKNER
6.68%
731,009
10,935,230
61
227
E
M80 - WRR East of Mahoneys Rd GB
FAWKNER
6.64%
423,727
6,380,780
62
191
E
M1 Outbound - CH 24340
WHEELERS HILL
6.64%
1,075,784
16,205,805
63
566
E
WGT - Inbound Main Carriageway
BROOKLYN
6.61%
725,305
10,969,267
64
177
E
M1 Outbound - CH 20770
GLEN WAVERLEY
6.57%
1,133,455
17,245,052
65
172
W
M1 Inbound - CH 19890
MOUNT WAVERLEY
6.56%
1,181,165
18,004,319
66
175
E
M1 Outbound - CH 20300
MOUNT WAVERLEY
6.55%
1,128,484
17,237,782
67
171
E
M1 Outbound - CH 19450
MOUNT WAVERLEY
6.51%
1,180,049
18,125,865
68
178
W
M1 Inbound - CH 21190
GLEN WAVERLEY
6.49%
1,126,227
17,342,769
69
169
E
M1 Outbound - CH 18980
MOUNT WAVERLEY
6.46%
1,186,140
18,357,954
70
581
W
M1 Monash Fwy - Stanley Inbound
MOUNT WAVERLEY
6.44%
957,832
14,863,243
71
549
W
M1 Monash Fwy - Stanley Inbound
MOUNT WAVERLEY
6.44%
199,768
3,102,087
72
186
W
M1 Inbound - CH 23280
MULGRAVE
6.43%
1,115,404
17,337,947
73
166
W
M1 Inbound - CH 18380
MOUNT WAVERLEY
6.42%
1,189,906
18,524,173
74
252
W
Princes Hwy and Federation Trail (WB)
BROOKLYN
6.42%
263,830
4,111,797
75
188
W
M1 Inbound - CH 23810
MULGRAVE
6.37%
830,986
13,040,512
76
179
E
M1 Outbound - CH 21190
GLEN WAVERLEY
6.30%
1,148,063
18,212,169
77
266
E
PFW 240m East of Duncans Road (IB)
WERRIBEE
6.29%
416,179
6,618,721
78
189
E
M1 Outbound - CH 23810
WHEELERS HILL
6.27%
1,132,554
18,069,681
79
229
E
M80 - WRR East of Merri Creek GB
THOMASTOWN
6.26%
854,250
13,651,274
80
194
W
M1 Inbound - CH 25280
MULGRAVE
6.26%
1,112,867
17,789,101
81
196
E
M1 Outbound - CH 25820
MULGRAVE
6.25%
1,098,086
17,556,746
82
222
E
M1 Outbound - CH 25400
MULGRAVE
6.25%
1,090,277
17,457,999
83
187
E
M1 Outbound - CH 23270
WHEELERS HILL
6.24%
1,125,647
18,044,559
84
167
E
M1 Outbound - CH 18380
MOUNT WAVERLEY
6.23%
1,209,351
19,415,956
85
173
E
M1 Outbound - CH 19890
MOUNT WAVERLEY
6.21%
1,194,271
19,228,540
86
91
W
M1 Inbound - Cardinia Rd (CH 54204)
OFFICER
6.21%
402,021
6,474,628
87
580
E
M1 Monash Hwy - Stanley Outbound
MOUNT WAVERLEY
6.20%
1,011,174
16,310,009
88
195
W
M1 Inbound - CH 25820
MULGRAVE
6.14%
1,046,615
17,047,638
89
192
E
M1 Outbound - CH 24900
MULGRAVE
6.12%
1,044,230
17,055,565
90
318
W
PFW 200m West of Sneydes Road (OB)
POINT COOK
6.09%
478,701
7,855,465
91
228
W
M80 - WRR East of Mahoneys Rd AB
FAWKNER
6.08%
121,669
2,002,225
92
92
E
M1 Outbound - Cardinia Rd (CH 54189)
OFFICER
6.07%
336,492
5,540,602
93
104
E
M1 Outbound - Koo Wee Rup
PAKENHAM
6.05%
178,626
2,951,194
94
319
W
PFW 380m East of Sneydes Road (OB)
POINT COOK
6.05%
471,083
7,789,095
95
550
E
M1 Monash Hwy - Stanley Outbound
MOUNT WAVERLEY
6.04%
146,984
2,433,856
96
96
W
M1 Inbound - after McGregor Rd Entry
PAKENHAM
5.98%
418,448
6,995,888
97
230
W
M80 - WRR East of Merri Creek AB
THOMASTOWN
5.98%
542,399
9,074,883
98
98
W
M1 Inbound - McGregor entry
PAKENHAM
5.96%
143,823
2,414,255
99
313
W
PFW 900m west of Duncans Road (OB)
WERRIBEE SOUTH
5.94%
460,855
7,755,475
100
276
E
PFW 1490m East of Sneydes Road (IB)
WERRIBEE
5.93%
476,373
8,029,879
Freight Corridor Ranking
Freight corridor ranking
This table ranks inferred monitored freight corridors using the Version 1 Freight Dependence Score.
Important terminology:
Vehicle movements and truck movements are classified TIRTL sensor movement records / passings. They are not counts of unique vehicles or unique trucks.
This table aggregates TIRTL truck movement records by suburb/locality.
Important terminology:
Vehicle movements and truck movements are classified TIRTL sensor movement records / passings. They are not counts of unique vehicles or unique trucks.
Rank
Suburb / locality
Site-headings
Unique sites
Vehicle movements
Truck movements
Truck %
First month
Last month
1
MULGRAVE
32
18
282,977,913
18,308,122
6.47%
2025-11
2026-05
2
MOUNT WAVERLEY
31
16
248,531,720
16,215,466
6.52%
2025-11
2026-05
3
DANDENONG NORTH
40
20
269,529,163
13,895,561
5.16%
2025-11
2026-05
4
BERWICK
44
24
190,801,061
8,650,475
4.53%
2025-11
2026-05
5
NARRE WARREN
32
17
194,851,421
7,555,471
3.88%
2025-11
2026-05
6
CHADSTONE
12
6
97,481,735
6,951,812
7.13%
2025-11
2026-05
7
KEILOR EAST
16
8
90,487,828
6,644,198
7.34%
2025-11
2026-05
8
POINT COOK
27
15
140,140,824
6,284,582
4.48%
2025-11
2026-05
9
OFFICER
27
14
112,888,078
5,766,429
5.11%
2025-11
2026-05
10
DOVETON
13
7
113,882,671
5,391,948
4.73%
2025-11
2026-05
11
AIRPORT WEST
21
11
125,276,666
5,080,963
4.06%
2025-11
2026-05
12
WERRIBEE
23
12
89,967,212
4,896,871
5.44%
2025-11
2026-05
13
GLEN WAVERLEY
8
4
69,125,313
4,525,206
6.55%
2025-11
2026-05
14
ENDEAVOUR HILLS
16
9
107,689,949
4,517,957
4.20%
2025-11
2026-05
15
WHEELERS HILL
8
4
68,318,829
4,417,649
6.47%
2025-11
2026-05
16
LAVERTON
15
8
121,820,004
4,243,529
3.48%
2025-11
2026-05
17
PAKENHAM
20
13
61,925,283
4,037,380
6.52%
2025-11
2026-05
18
FAWKNER
13
7
53,148,439
3,257,926
6.13%
2025-11
2026-05
19
THOMASTOWN
14
8
73,231,059
2,958,807
4.04%
2025-11
2026-05
20
ALTONA MEADOWS
10
5
73,196,581
2,583,348
3.53%
2025-11
2026-05
21
WERRIBEE SOUTH
7
5
41,039,434
2,486,325
6.06%
2025-11
2026-05
22
LAVERTON NORTH
15
8
42,044,330
2,442,273
5.81%
2025-11
2026-05
23
PORT MELBOURNE
4
2
30,299,007
2,286,084
7.55%
2025-11
2026-05
24
BROOKLYN
8
4
30,377,346
2,019,508
6.65%
2025-11
2026-05
25
HALLAM
8
4
50,976,483
1,773,104
3.48%
2025-11
2026-05
26
ALTONA NORTH
9
5
18,668,969
1,625,342
8.71%
2025-11
2026-05
27
TULLAMARINE
17
10
79,003,115
1,568,762
1.99%
2025-11
2026-05
28
ESSENDON NORTH
8
4
31,764,650
1,505,755
4.74%
2025-11
2026-05
29
EPPING
4
2
12,504,695
1,200,348
9.60%
2025-11
2026-05
30
ALTONA
4
2
31,093,357
1,082,393
3.48%
2025-11
2026-05
31
STRATHMORE HEIGHTS
4
2
22,427,244
800,400
3.57%
2025-11
2026-05
32
NARRE WARREN NORTH
3
2
22,631,829
783,995
3.46%
2025-11
2026-05
33
MELBOURNE AIRPORT
10
5
25,337,421
654,817
2.58%
2025-11
2026-05
34
WILLIAMS LANDING
1
1
11,860,733
539,132
4.55%
2025-11
2026-05
35
BALLAN
4
2
4,560,685
481,105
10.55%
2025-11
2026-05
36
ESSENDON FIELDS
2
1
12,822,444
467,823
3.65%
2025-11
2026-05
37
BEACONSFIELD
1
1
9,850,299
443,248
4.50%
2025-11
2026-05
38
BRIGHTON EAST
4
2
13,244,117
205,807
1.55%
2025-11
2026-05
39
BAYSWATER
4
2
7,289,817
198,785
2.73%
2025-11
2026-05
40
GLADSTONE PARK
2
2
8,241,070
182,339
2.21%
2025-11
2026-05
41
WESTMEADOWS
2
1
7,974,816
153,734
1.93%
2025-11
2026-05
42
GOWANBRAE
1
1
7,789,814
120,974
1.55%
2025-11
2026-05
43
BUNDOORA
4
2
9,978,568
115,599
1.16%
2025-11
2026-05
44
KEILOR
2
1
3,678,644
98,010
2.66%
2025-11
2026-02
45
LINDENOW SOUTH
4
2
1,325,828
92,000
6.94%
2025-11
2026-05
46
BURWOOD
4
2
7,174,315
55,766
0.78%
2025-11
2026-05
47
DANDENONG
4
2
5,240,388
52,905
1.01%
2025-11
2026-05
Charts
TIRTL truck movement charts
These colour-coded charts turn the TIRTL outputs into visual evidence:
top truck suburbs, truck-share rankings, monthly movement trends,
freight corridor rankings, and high-volume truck monitoring locations.
Important terminology:
Vehicle movements and truck movements are classified TIRTL sensor movement records / passings. They are not counts of unique vehicles or unique trucks.
Colour logic:
red and dark red indicate hotter, busier, higher-pressure, or more freight-intensive values.
Blue and cooler tones indicate lower values. This matches the visual language used across the SCATS intelligence charts.
Top suburbs/localities by TIRTL truck movement records
Ranks suburbs/localities by classified TIRTL truck movement records.
Higher values are shown with hotter orange/red colours; lower values are shown with cooler blue colours.
Monthly totals are classified TIRTL movement records aggregated across imported site-headings. They should be interpreted as network sensor passings, not the number of unique vehicles in Melbourne.
Important terminology:
Vehicle movements and truck movements are classified TIRTL sensor movement records / passings. They are not counts of unique vehicles or unique trucks.
This table aggregates the site-day TIRTL daily summary into network-level daily totals. It shows recent daily vehicle movement records, truck movement records and truck share.
Important terminology:
Vehicle movements and truck movements are classified TIRTL sensor movement records / passings. They are not counts of unique vehicles or unique trucks.
Date
Sites
Site-headings
Vehicle movements
Truck movements
Truck %
Avg speed km/h
Observations
Peak 15m volume
Peak 15m trucks
2026-03-15
2
2
160,002
10,870
6.79%
73.2
192
1,618
109
2026-03-14
2
2
187,350
17,458
9.32%
70.4
192
1,857
190
2026-03-13
2
2
201,363
40,789
20.26%
64.1
192
1,888
518
2026-03-12
2
2
193,230
40,959
21.20%
67.1
192
1,944
496
2026-03-11
2
2
186,694
40,282
21.58%
65.0
192
1,921
468
2026-03-10
2
2
186,146
37,665
20.23%
71.6
192
1,919
482
2026-03-09
2
2
152,376
12,786
8.39%
77.3
192
1,602
134
2026-03-08
2
2
166,153
10,123
6.09%
76.6
192
1,611
122
2026-03-07
2
2
183,662
15,450
8.41%
76.6
192
1,651
174
2026-03-06
2
2
201,309
38,433
19.09%
70.4
192
1,940
469
2026-03-05
2
2
196,853
39,559
20.10%
68.0
192
1,959
472
2026-03-04
2
2
197,395
40,173
20.35%
68.7
192
2,031
494
2026-03-03
2
2
190,671
39,249
20.58%
67.4
192
2,003
502
2026-03-02
2
2
178,047
35,584
19.99%
66.8
192
1,883
429
2026-03-01
2
2
160,200
10,925
6.82%
70.6
192
1,718
122
2026-02-28
2
2
195,783
18,017
9.20%
69.2
192
1,776
196
2026-02-27
2
2
201,875
39,302
19.47%
62.7
192
1,876
512
2026-02-26
2
2
186,375
38,949
20.90%
61.1
177
2,012
505
2026-02-25
2
2
188,648
39,342
20.85%
65.4
187
1,958
516
2026-02-24
2
2
176,664
37,232
21.08%
65.9
177
1,977
486
2026-02-23
2
2
177,441
36,155
20.38%
69.6
186
2,003
442
2026-02-22
2
2
156,961
10,307
6.57%
71.3
191
1,785
108
2026-02-21
2
2
194,162
16,969
8.74%
69.1
192
1,894
181
2026-02-20
2
2
201,928
38,772
19.20%
65.4
192
1,957
482
2026-02-19
2
2
195,011
39,247
20.13%
63.4
192
2,008
497
2026-02-18
2
2
194,277
39,993
20.59%
65.8
192
1,953
489
2026-02-17
2
2
187,349
38,342
20.47%
66.6
192
1,937
475
2026-02-16
2
2
187,810
38,389
20.44%
68.2
192
1,923
456
2026-02-15
2
2
170,320
11,167
6.56%
72.1
192
1,807
111
2026-02-14
2
2
193,026
16,652
8.63%
69.9
192
1,778
183
2026-02-13
2
2
204,284
39,929
19.55%
65.5
192
1,894
562
Methodology
How the Melbourne TIRTL truck movement intelligence layer was built
This section explains how raw TIRTL outputs were converted into public-facing truck movement,
truck-share, suburb/locality, map and freight-corridor intelligence.
Important terminology:
Vehicle movements and truck movements are classified TIRTL sensor movement records / passings. They are not counts of unique vehicles or unique trucks.
1
Import and organise TIRTL movement records
The workflow starts with imported TIRTL records and source manifests. The current import manifest contains
7 rows across
0 detected monthly periods.
2
Create site and site-heading master tables
TIRTL monitoring locations are organised into base sites and directional site-heading records.
The current site-heading master contains 562 rows.
3
Attach coordinates and suburb/locality context
The enriched map layer contains 562 site-heading records.
Coordinates were used to spatially join the records to Vicmap locality polygons, producing
47 suburbs/localities in the current output.
4
Calculate vehicle movement, truck movement and truck-share metrics
Across the current map layer, the output contains
3,134,471,167 vehicle movement records and
159,620,033 truck movement records.
The network-wide truck share is 5.09%.
5
Build rankings, suburb summaries and dashboard layers
The workflow generates top truck movement rankings, top truck-share rankings, suburb/locality summaries,
monthly/daily summaries, interactive map layers and technical appendix outputs.
6
Infer Version 1 freight corridors
The freight corridor model groups TIRTL site-heading records into inferred monitored corridors and ranks them
using a transparent Freight Dependence Score. The current freight corridor output identifies
21 inferred corridors and
21 GeoJSON line features.
Freight corridor note:
The Version 1 freight corridor map connects measured TIRTL site-heading locations into inferred corridor lines. It identifies monitored freight-heavy corridors, but it is not yet a road-centreline-snapped engineering map.
Locality join note:
TIRTL site-heading coordinates were spatially joined to Vicmap LOCALITY_POLYGON boundaries to assign suburb/locality names.
Data Quality & Caveats
Data quality, caveats and interpretation rules
These checks explain what is strong about the current TIRTL output and where the limits are.
The page is designed to be useful while remaining careful about what the data can and cannot claim.
Critical caveat:
Vehicle movements and truck movements are classified TIRTL sensor movement records / passings. They are not counts of unique vehicles or unique trucks.
Coordinate completeness
562 / 562
Rows with latitude values in the public map layer.
Longitude completeness
562 / 562
Rows with longitude values in the public map layer.
Suburb/locality completeness
562 / 562
Rows with a suburb/locality assignment after spatial enrichment.
Movement records are not unique vehicles. A real-world vehicle can appear multiple times if it passes multiple sensors, site-headings or corridors.
Truck share is a proportion of classified movement records. It is useful for identifying freight-heavy road function, but it is not a population count of trucks.
High truck volume and high truck share are different. A freeway may carry more trucks in total while an industrial arterial may have a higher truck percentage.
The freight corridor map is Version 1. It connects measured TIRTL points into inferred corridor lines and should not be described as a road-centreline-snapped engineering model.
Suburb/locality names come from spatial joins. They are useful for public interpretation but should be checked around boundaries and complex road corridors.
Downloads & Technical Appendices
TIRTL downloads, map layers and technical appendices
These files support public review, journalist research, map reproduction, future page generation,
methodology checking and later SCATS + TIRTL combined intelligence work.
Important terminology:
Vehicle movements and truck movements are classified TIRTL sensor movement records / passings. They are not counts of unique vehicles or unique trucks.
34
Download entries
Files listed in this download catalogue.
34
Files currently available
Existing files detected at build time.
8
Download groups
Public data, maps, methodology, dictionaries and future-chat files.
Release guidance:
Public summary datasets and interactive pages are intended for broad interpretation.
Technical appendix files are useful for reproducibility and review.
High-value full lookup/map-layer files may be better released selectively or with clear context.
Public summary datasets
6 / 6 files available · 0.149 MB
CSVAVAILABLE
Suburb/locality truck summary
Aggregated truck movement and truck-share summary by Vicmap suburb/locality.
Audience: Journalists, councils, public, property analystsStatus: Good public release candidateSize: 0.003 MB
Reproducibility, audit trail and technical appendices
The TIRTL intelligence work is built from repeatable CSV, JSON, GeoJSON, chart and HTML outputs.
These files make it possible to regenerate the page, verify the source layers, explain the methodology,
and support future AI-assisted traffic analysis for journalists, developers, transport reviewers and public users.
Public methodology note:
the files listed here are analytical outputs and documentation layers, not official Department of Transport incident records.
Abnormal-flow outputs identify historical speed-flow deviation patterns and incident-like candidates; the nowcast outputs are
historical transition probabilities, not live predictions.
TIRTL + SCATS
Integrated evidence base
Freeway screenline behaviour, truck/freight intelligence and citywide SCATS movement context.
V2
New abnormal-flow layer
Abnormal speed-flow episodes, incident-like candidates and recovery-duration proxy outputs.
15 min
Nowcast transition interval
Historical worsening-risk tables compare current conditions with the following 15-minute interval.
AI-ready
Structured output catalogue
CSV, JSON and dictionary outputs support future Traffic AI Analyst question-answering.
Connects TIRTL monitoring locations to localities and map outputs.
Public methodology / technical appendix
New V2 answer-layer outputs
The latest build adds three higher-level evidence families: construction RDO movement effects,
historical 15-minute worsening-risk nowcast outputs, and abnormal speed-flow episode detection.
These files are the main audit trail for the new abnormal-flow and nowcast section.
Human-readable technical appendix for the TIRTL data dictionary.
Next reproducibility upgrade
The next useful upgrade is a single public methodology appendix that links each major chart,
table, map layer and CSV back to its source script, source dataset, output path and caveat.
This would also become the foundation for a future Traffic AI Analyst chatbot that can answer public and journalist questions
using verified source files instead of guessed filenames.