Freight exposure is concentrated
Selected industrial arterials in Melbourne’s West carry unusually high and persistent heavy-vehicle exposure.

Loading verified freight findings…
A concise briefing for elected representatives, candidates, advisers, freight stakeholders and journalists.
Selected industrial arterials in Melbourne’s West carry unusually high and persistent heavy-vehicle exposure.
Loading the verified corridor and overnight results…
Road renewal, lighting, maintenance and safety investment should be tested against measured freight exposure.
Match these rankings to pavement condition, maintenance history, lighting assets, crash records and expenditure.
A transparent summary of the verified findings, their limits and the evidence still required for infrastructure claims.
This template is ready to receive a concise evidence-based account of where heavy-vehicle activity is concentrated, how freight patterns change after dark, and whether Western Melbourne carries a disproportionate share of the monitored freight task.
Scope boundary: TIRTL measures classified traffic and freight exposure. Claims about pavement condition, lighting adequacy, maintenance backlog or expenditure require separate asset-condition and investment data.
Headline measures calculated from the verified reporting extract.
The report separates measured traffic exposure from conclusions that require additional road-asset evidence.
Rank reviewed western roads by truck volume, truck share, coverage-adjusted intensity and overnight freight concentration.
Measure the proportion of freight occurring overnight and the share of all overnight traffic represented by trucks.
Compare West, South-East, North and East using both total activity and coverage-adjusted intensity measures.
Highest monitored truck volumes and truck shares, with a dedicated secondary-arterial lens.
Individual site-headings are ranked to avoid inflating long corridors with many sequential sensors.
Source: Melbourne TIRTL classified vehicle data. Individual site-headings are shown to avoid inflating long corridors with multiple sequential sensors.
Truck movements as a percentage of classified movements on reviewed community-facing roads.
Source: Melbourne TIRTL classified vehicle data. Regional and road classifications are reviewed analytical groupings.
The chart ranks individual directional headings. This companion map shows the same top locations geographically, without implying that surrounding suburbs are completely monitored.
One mapped circle represents one directional TIRTL monitoring heading. Truck totals are classified sensor passings, not unique trucks.
| Rank | Road / corridor | Region | Road class | Truck movements | Truck share | Overnight share | Exposure score | Evidence note |
|---|
Source: Melbourne TIRTL classified vehicle data for the reporting period shown above. Movements are sensor passings, not unique vehicles. Coverage varies by location.
Two distinct measures are retained: the share of a corridor’s trucks occurring overnight, and trucks as a share of all overnight traffic.
Default bands: day 06:00–18:00, evening 18:00–22:00, overnight 22:00–06:00.
Source: 15-minute TIRTL intervals. Day 06:00–17:59; evening 18:00–21:59; overnight 22:00–05:59.
Highest truck share within the overnight period.
Source: 15-minute TIRTL intervals. The metric is trucks divided by all classified overnight traffic.
Each point is placed at the strongest representative monitored heading for the ranked corridor. The percentage is the corridor result shown in the overnight ranking.
The map location is a representative monitored heading for each corridor. It is not the corridor’s full road geometry, and blank roads are not measured zeroes.
| Rank | Corridor / site | Region | Night trucks | Night share of corridor trucks | Trucks as share of night traffic | Peak night interval | Weekday / weekend note |
|---|
Source: Melbourne TIRTL 15-minute classified vehicle data. Overnight is 22:00–05:59.
Explore valid-night averages, medians, weekday and weekend patterns, daily variation, weekly and monthly change, overnight hours, directional differences and unusually busy nights.
Grouped monitored-location passings on valid corridor nights, with a seven-calendar-day rolling average.
Friday night means Friday 22:00 through Saturday 05:59.
Complete weeks require at least five valid corridor nights. A four-week moving average is retained.
Average grouped passings per valid night, split into weekday and weekend nights. Partial months are disclosed.
Eight one-hour bands from 22:00 to 05:59.
Darker cells indicate a higher average number of grouped monitored-location truck passings.
Shows which directions and sites contribute to the grouped corridor result.
Highest valid corridor nights relative to the corridor median.
A curated set of defensible visuals showing the scale, persistence, timing and direction of overnight freight on monitored western roads.
These graphs use valid-night and directional-heading rules to prevent roads with more sequential sensors from automatically appearing more exposed. They are designed to answer the questions politicians, advisers, communities and journalists are most likely to ask.
Start here for the clearest road-to-road and time-pattern evidence.
 This graph image could not be loaded. Generate or republish the Version 12.3 dark graph pack.
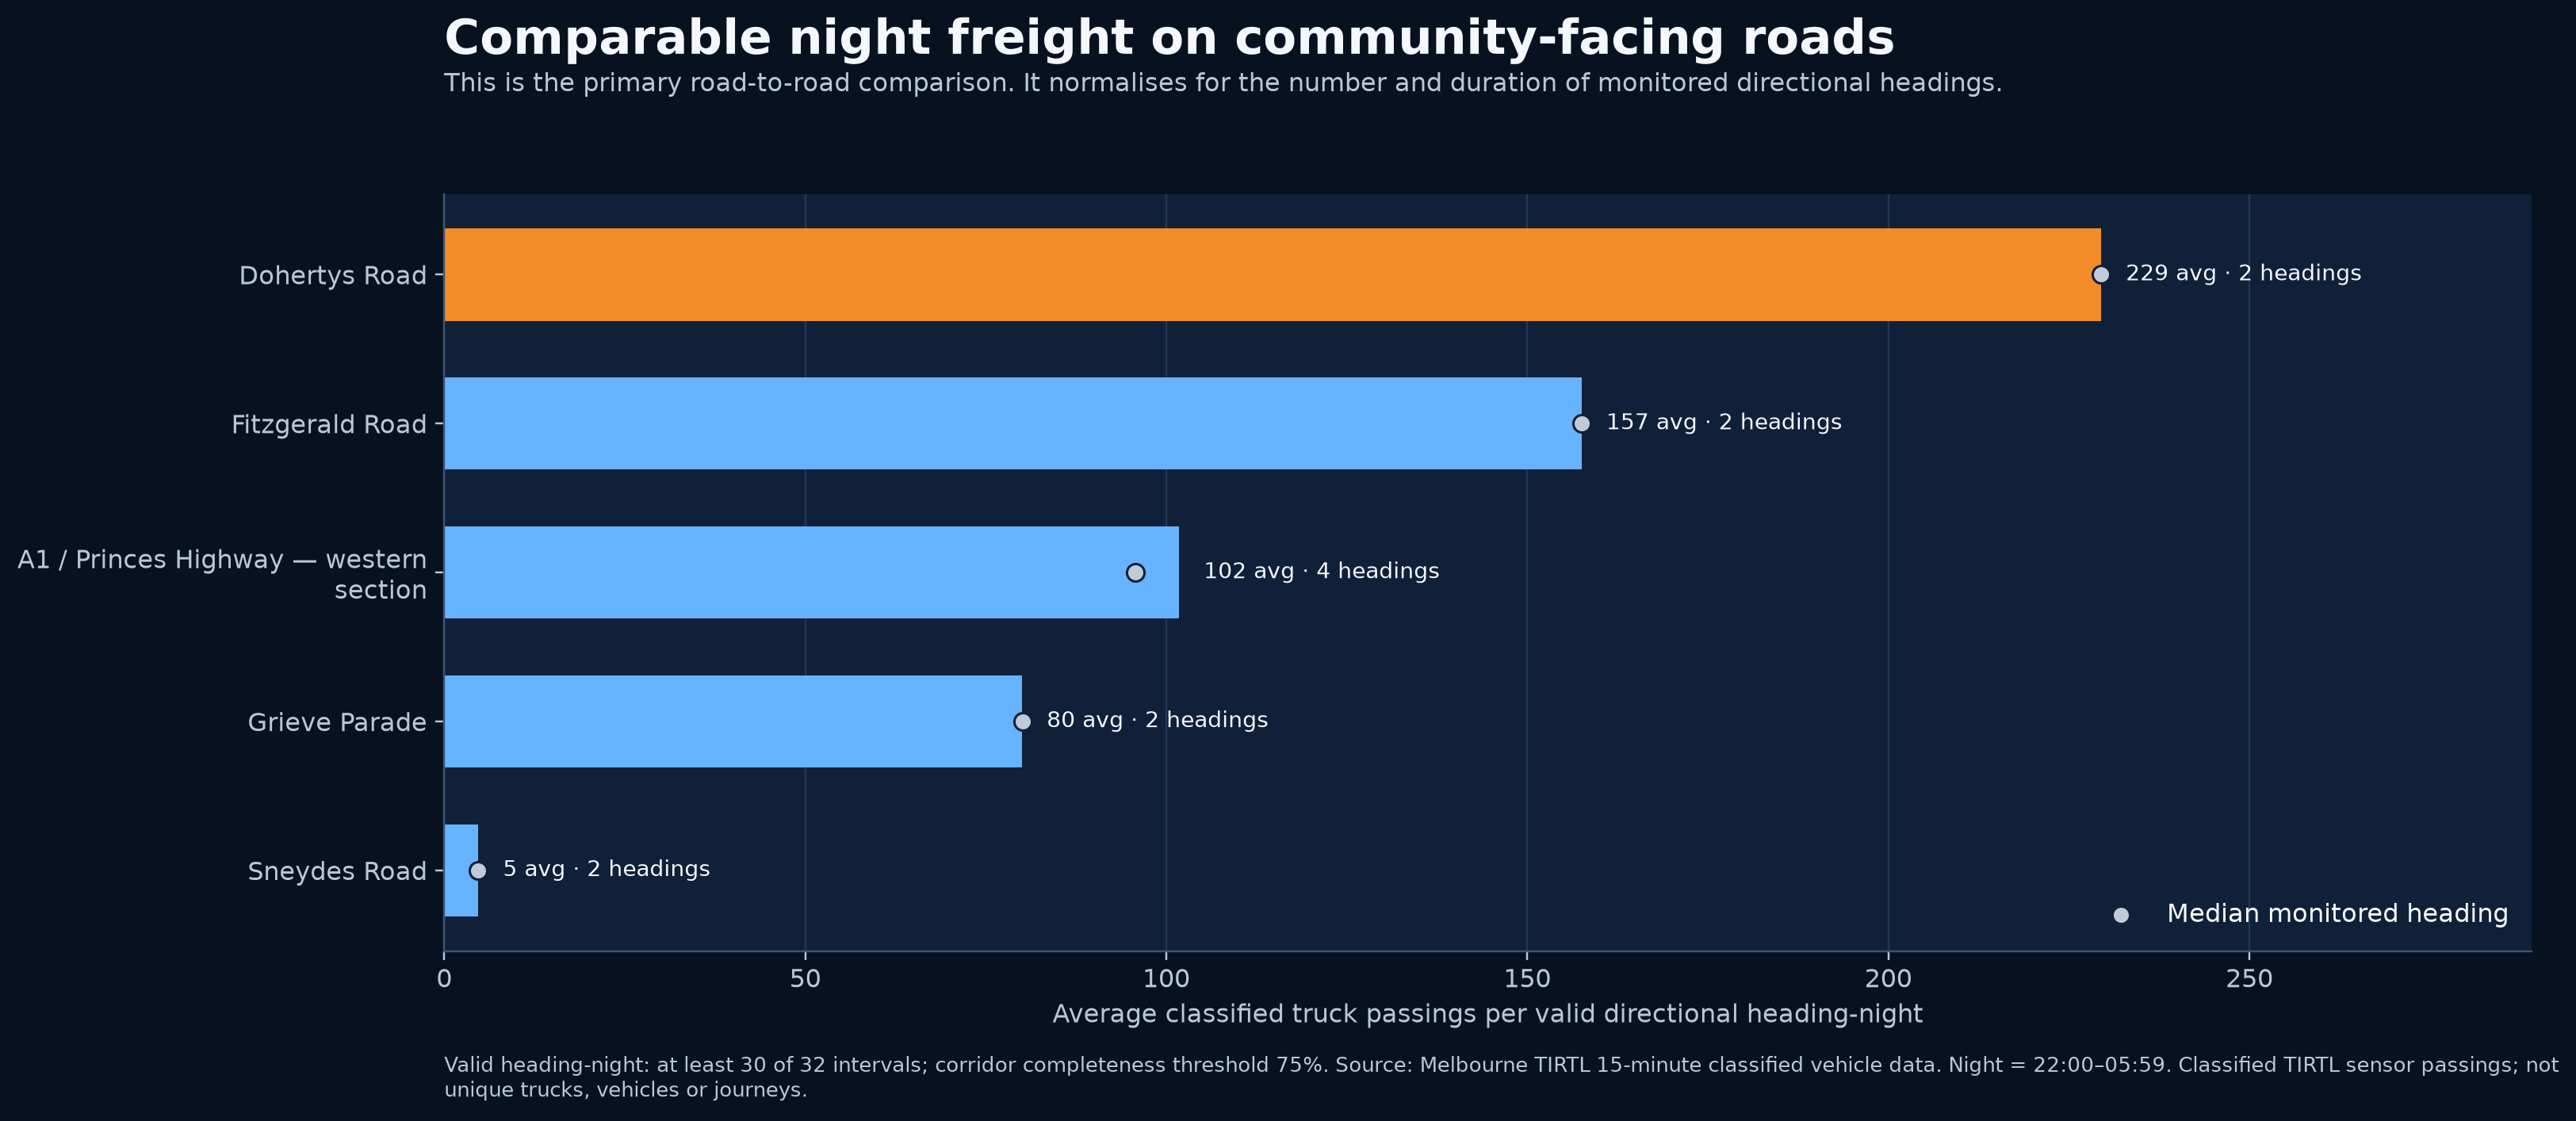
This is the fairest headline road-to-road comparison. It shows average classified truck passings per valid directional heading-night, preventing roads with more sequential sensors from automatically appearing busier.
What it communicates: It communicates where an ordinary monitored direction experiences the greatest recurring overnight freight exposure. Dohertys Road is the clearest high-exposure road in the reviewed western sample.
Interpretation: One value represents an average monitored direction, not unique trucks travelling the whole corridor.
 This graph image could not be loaded. Generate or republish the Version 12.3 dark graph pack.
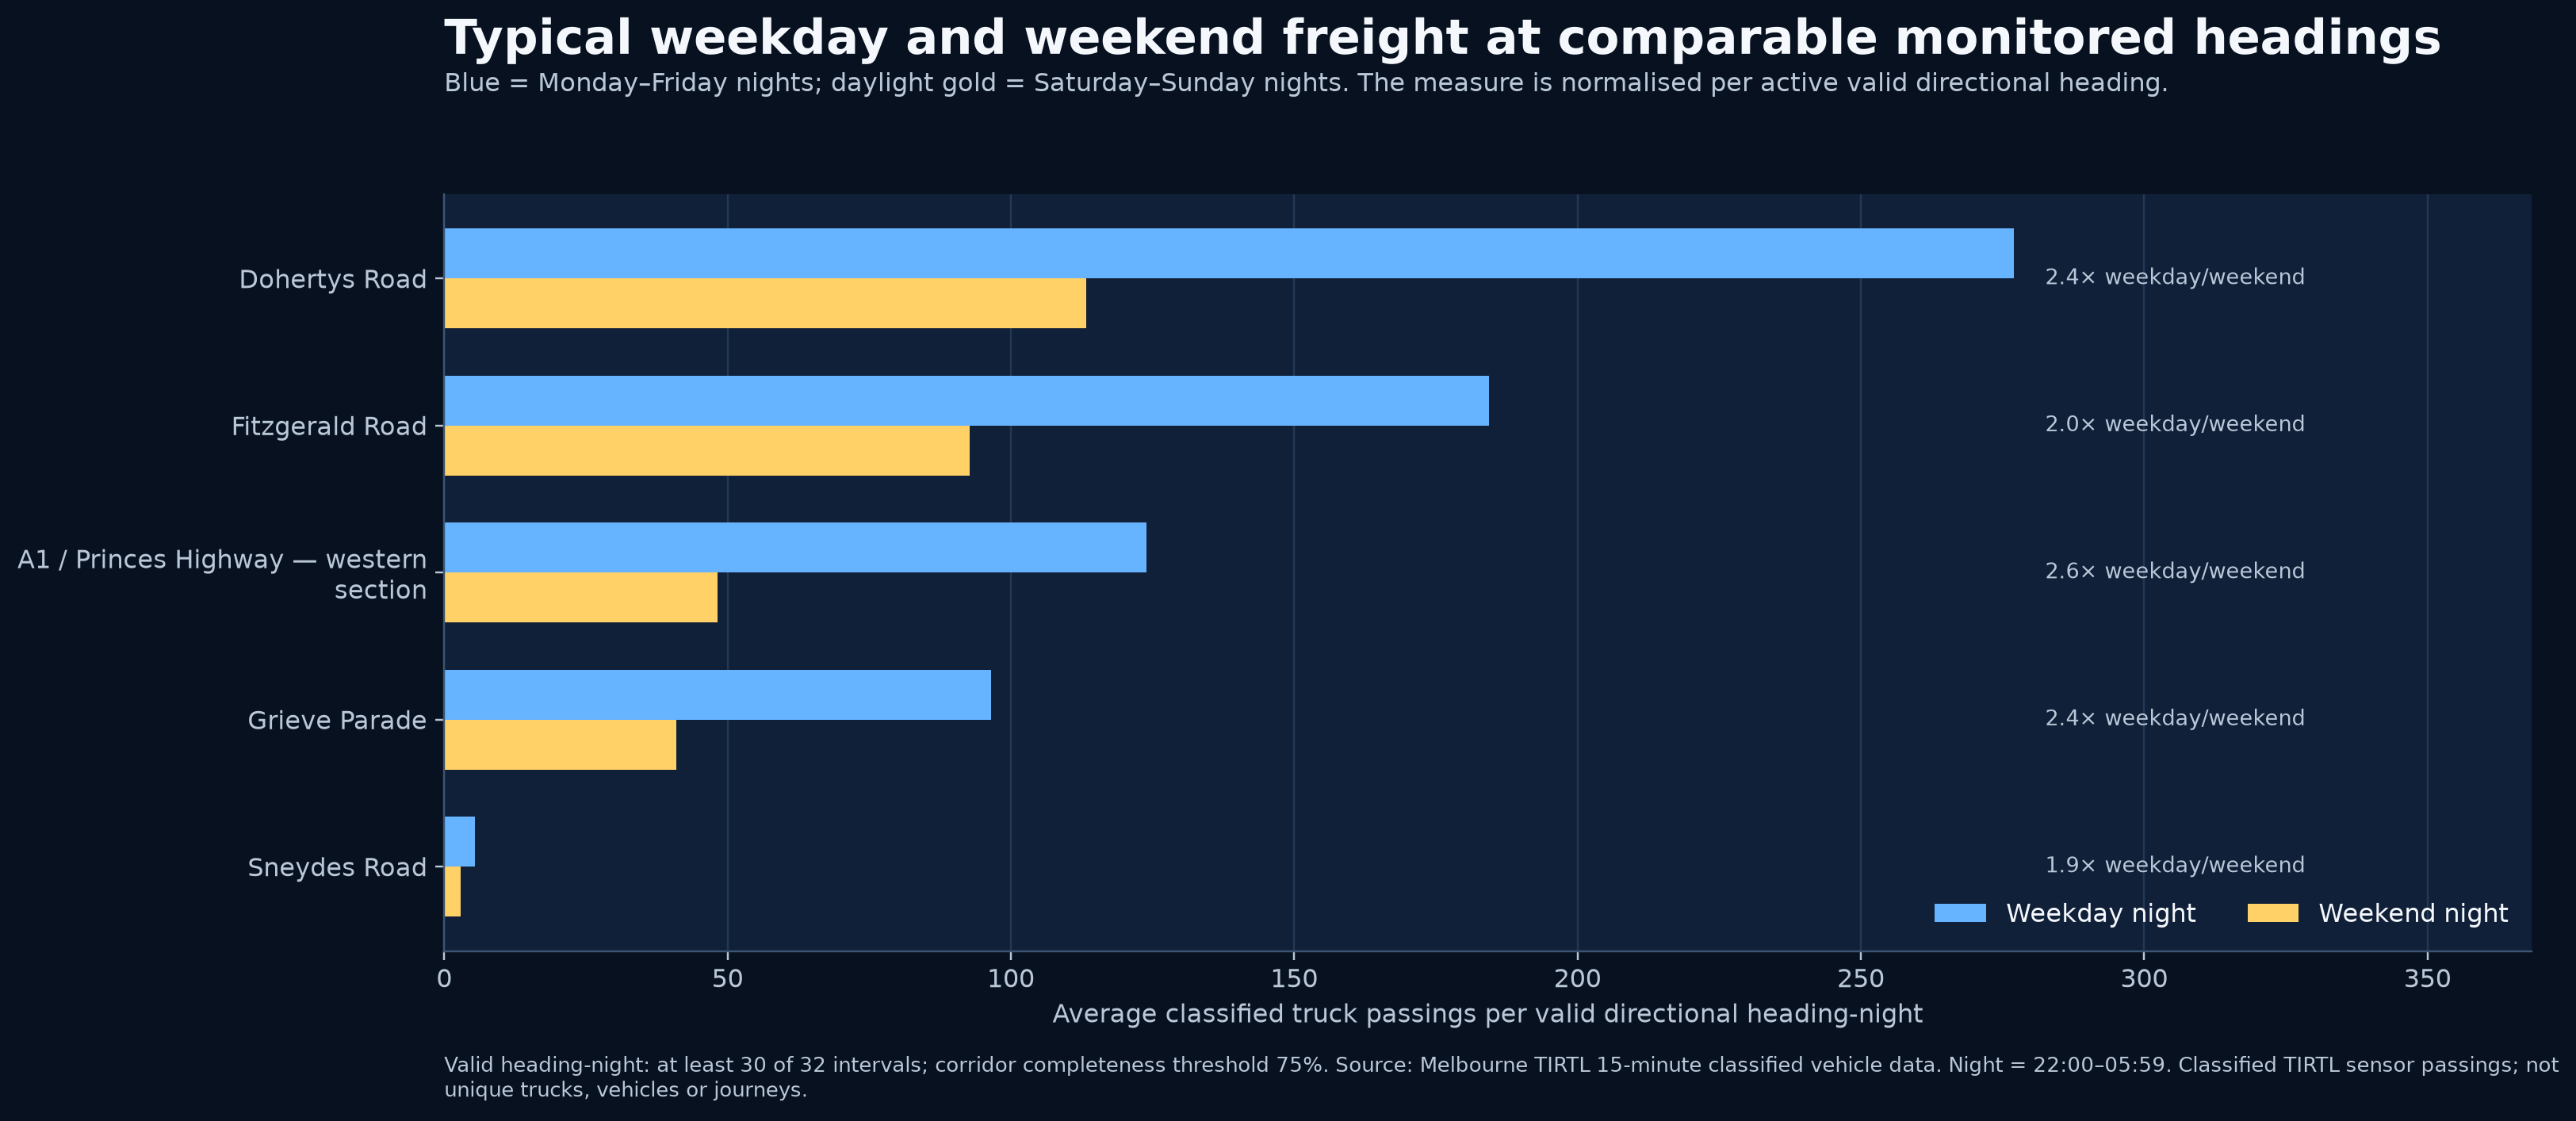
This compares average overnight truck passings on working-week nights with weekend nights using a per-heading measure.
What it communicates: It reveals whether freight pressure is a routine feature of the working week and how sharply it falls on weekends—important for residential amenity, noise, lighting and maintenance discussions.
Interpretation: Monday night means Monday 22:00 through Tuesday 05:59.
 This graph image could not be loaded. Generate or republish the Version 12.3 dark graph pack.
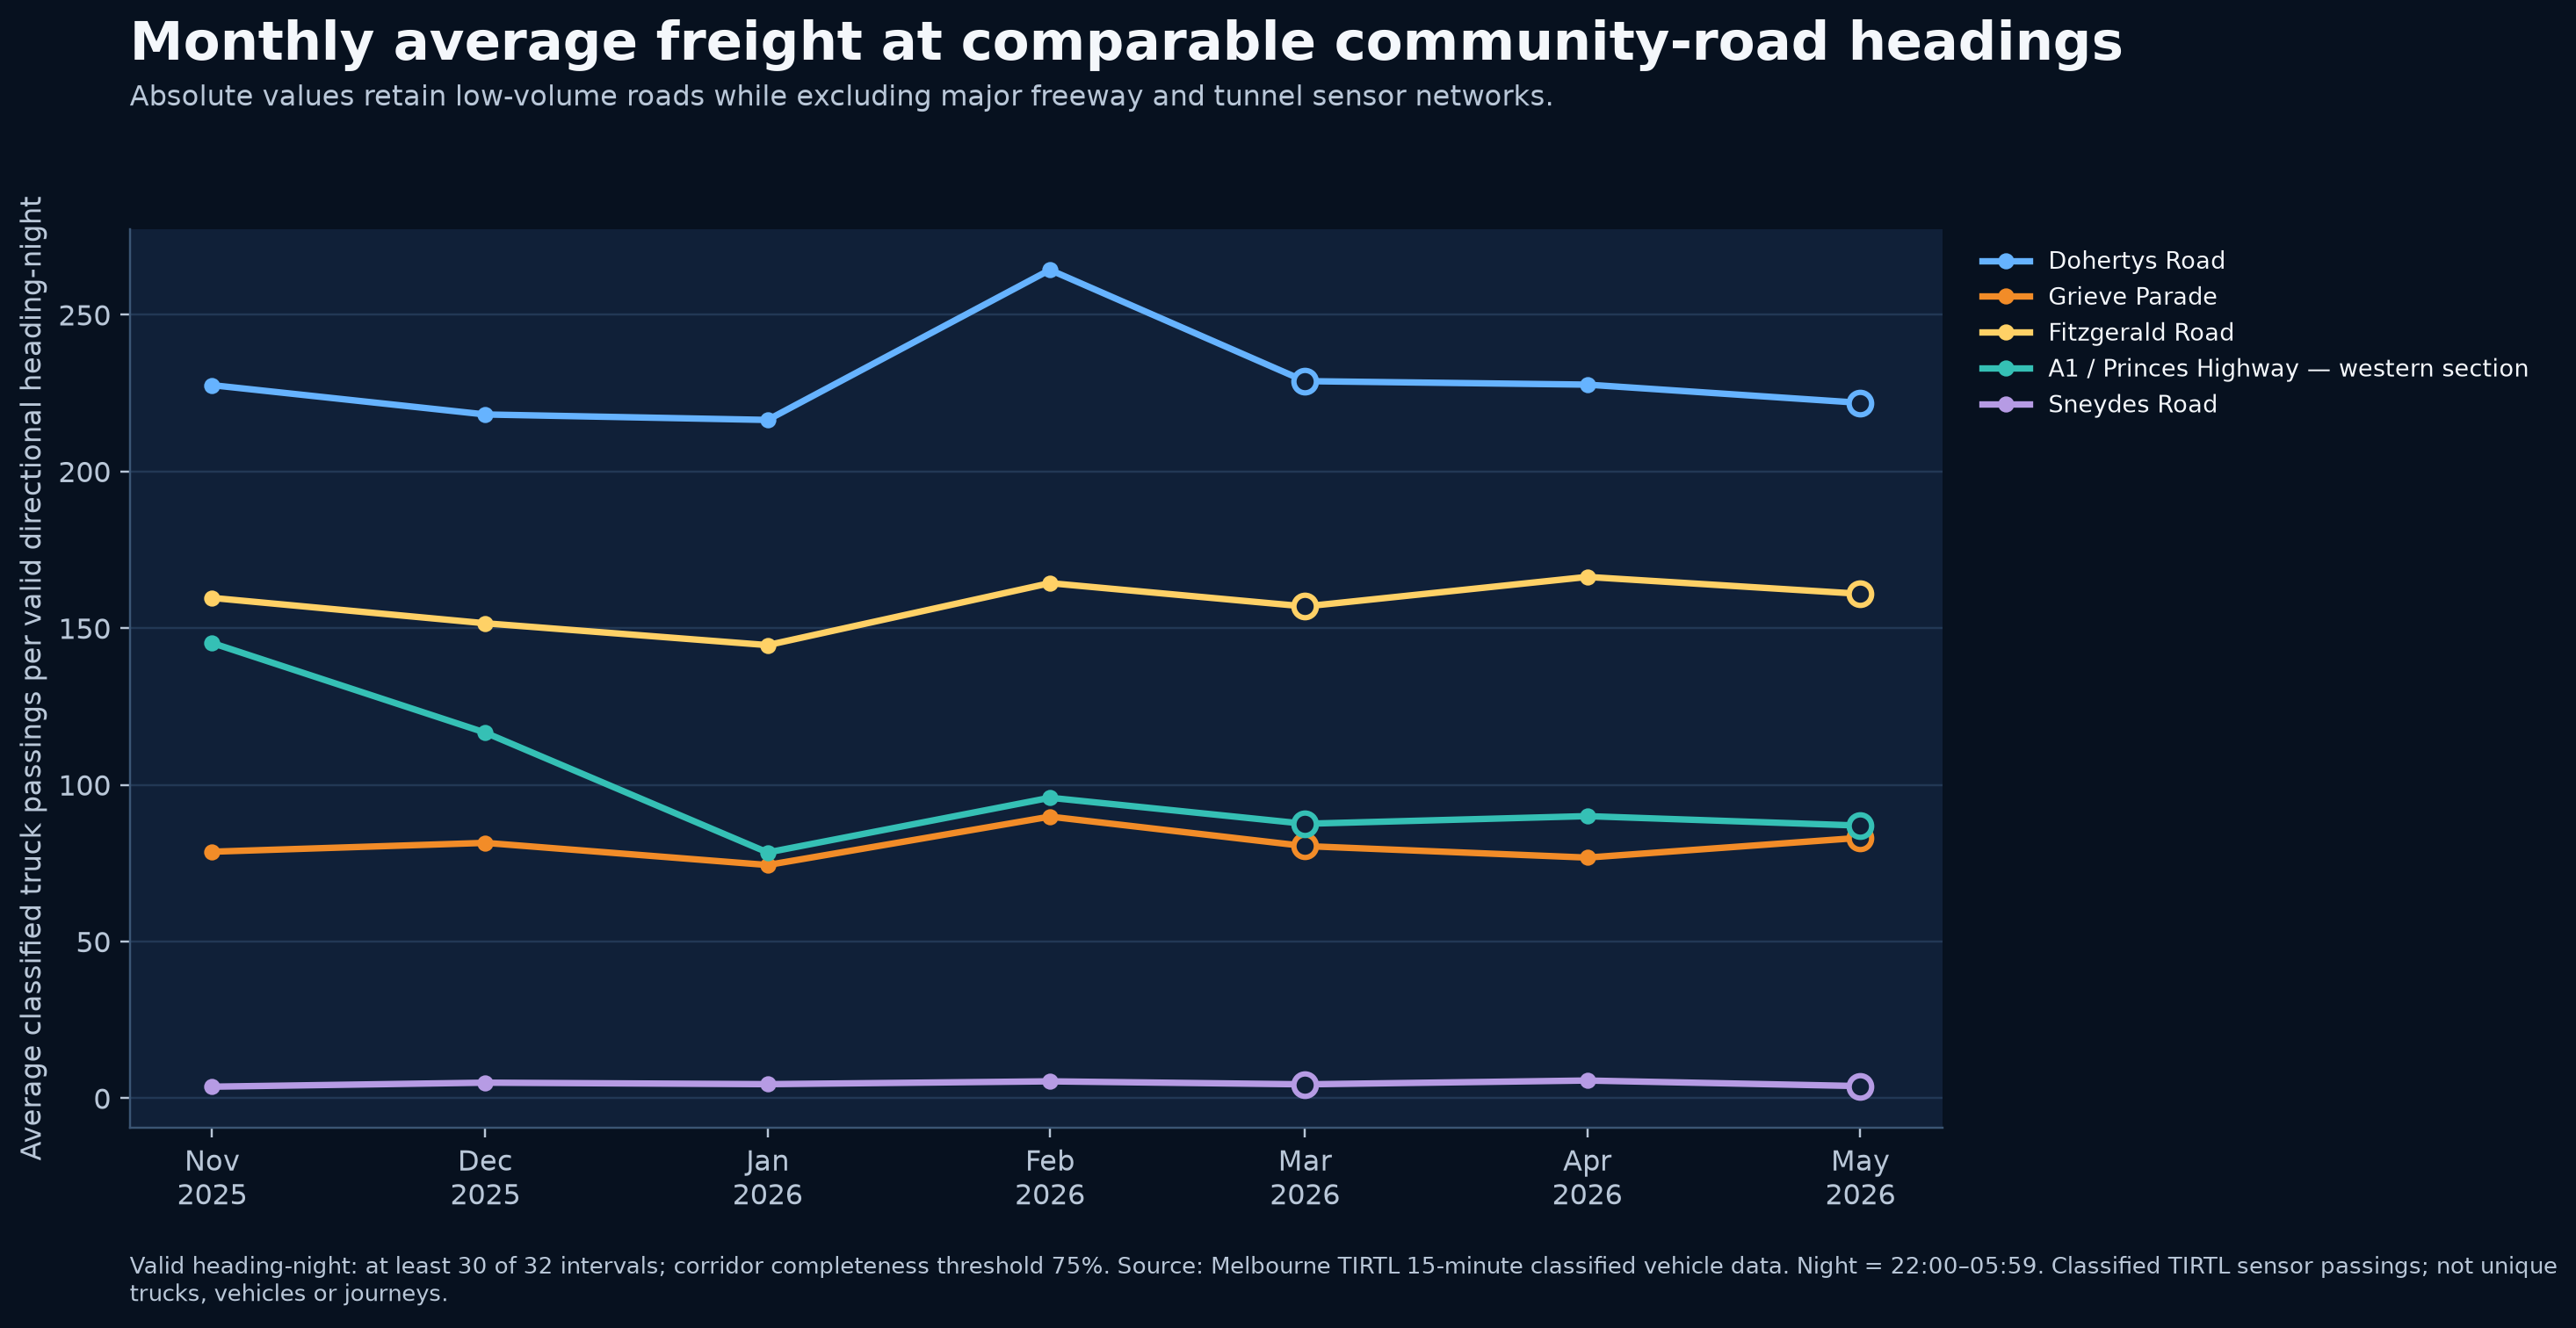
This displays the actual average overnight truck passings per valid directional heading-night in each month for comparable community-facing roads.
What it communicates: It shows both the scale of the burden and whether a road was busier or quieter in particular months. It is the preferred monthly graph when discussing actual monitored activity rather than percentage change.
Interpretation: Partial months and periods without sufficient monitoring must be read as disclosed on the graph.
 This graph image could not be loaded. Generate or republish the Version 12.3 dark graph pack.
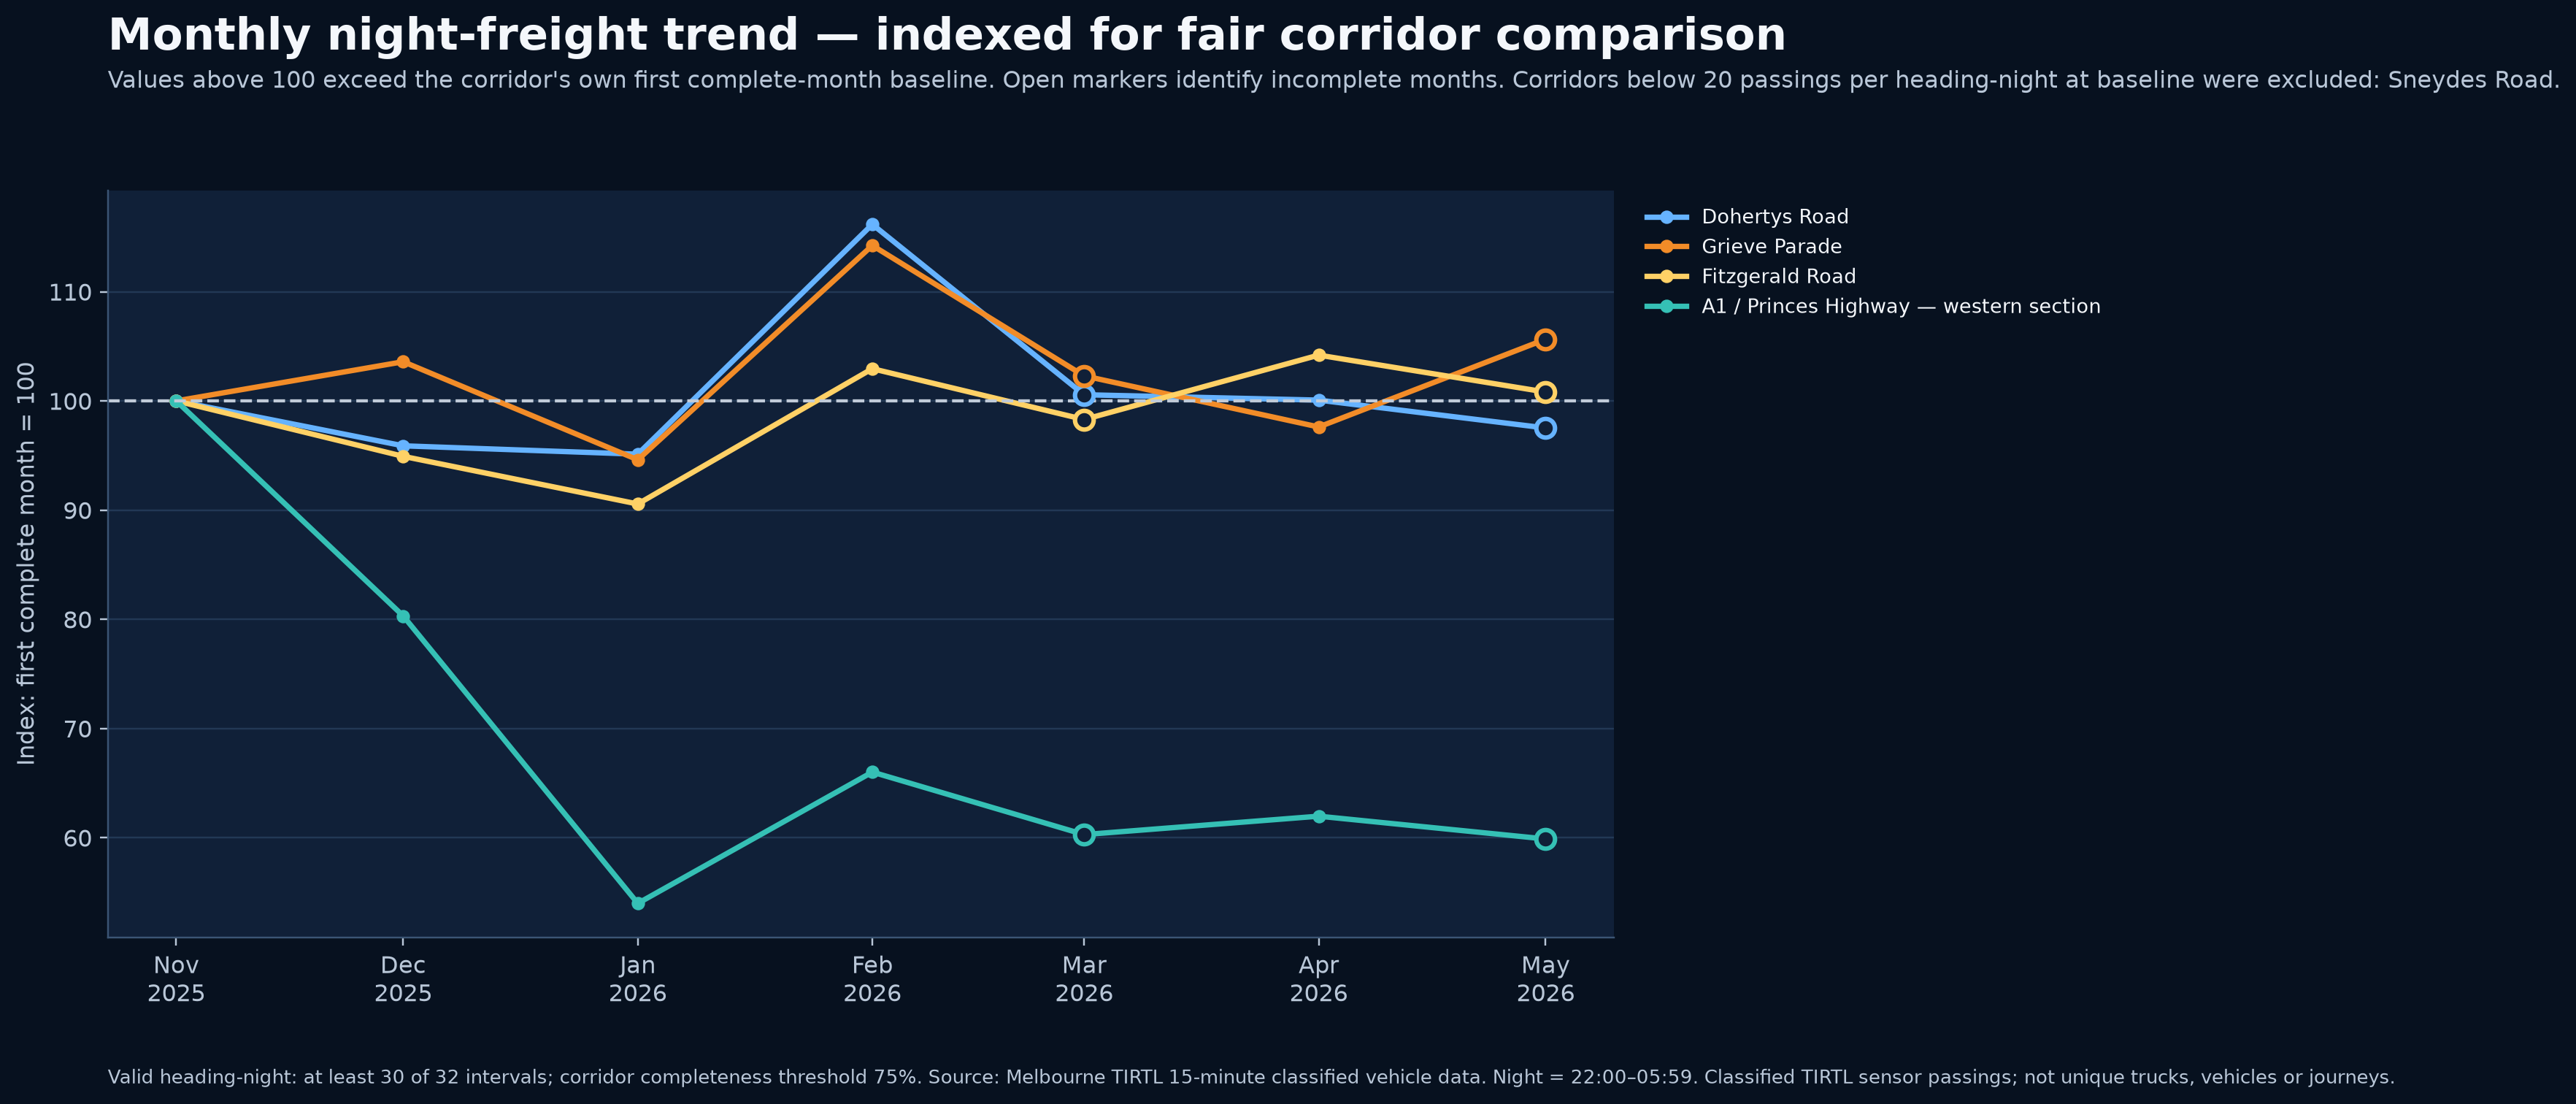
Each eligible road begins at an index of 100, allowing roads with different traffic volumes to be compared by relative movement over time.
What it communicates: It helps identify whether several corridors rose or fell together, and whether a change is isolated to one road. Low-volume roads are excluded to prevent small absolute changes from producing misleading percentages.
Interpretation: An index shows relative change, not the absolute number of truck passings.
 This graph image could not be loaded. Generate or republish the Version 12.3 dark graph pack.
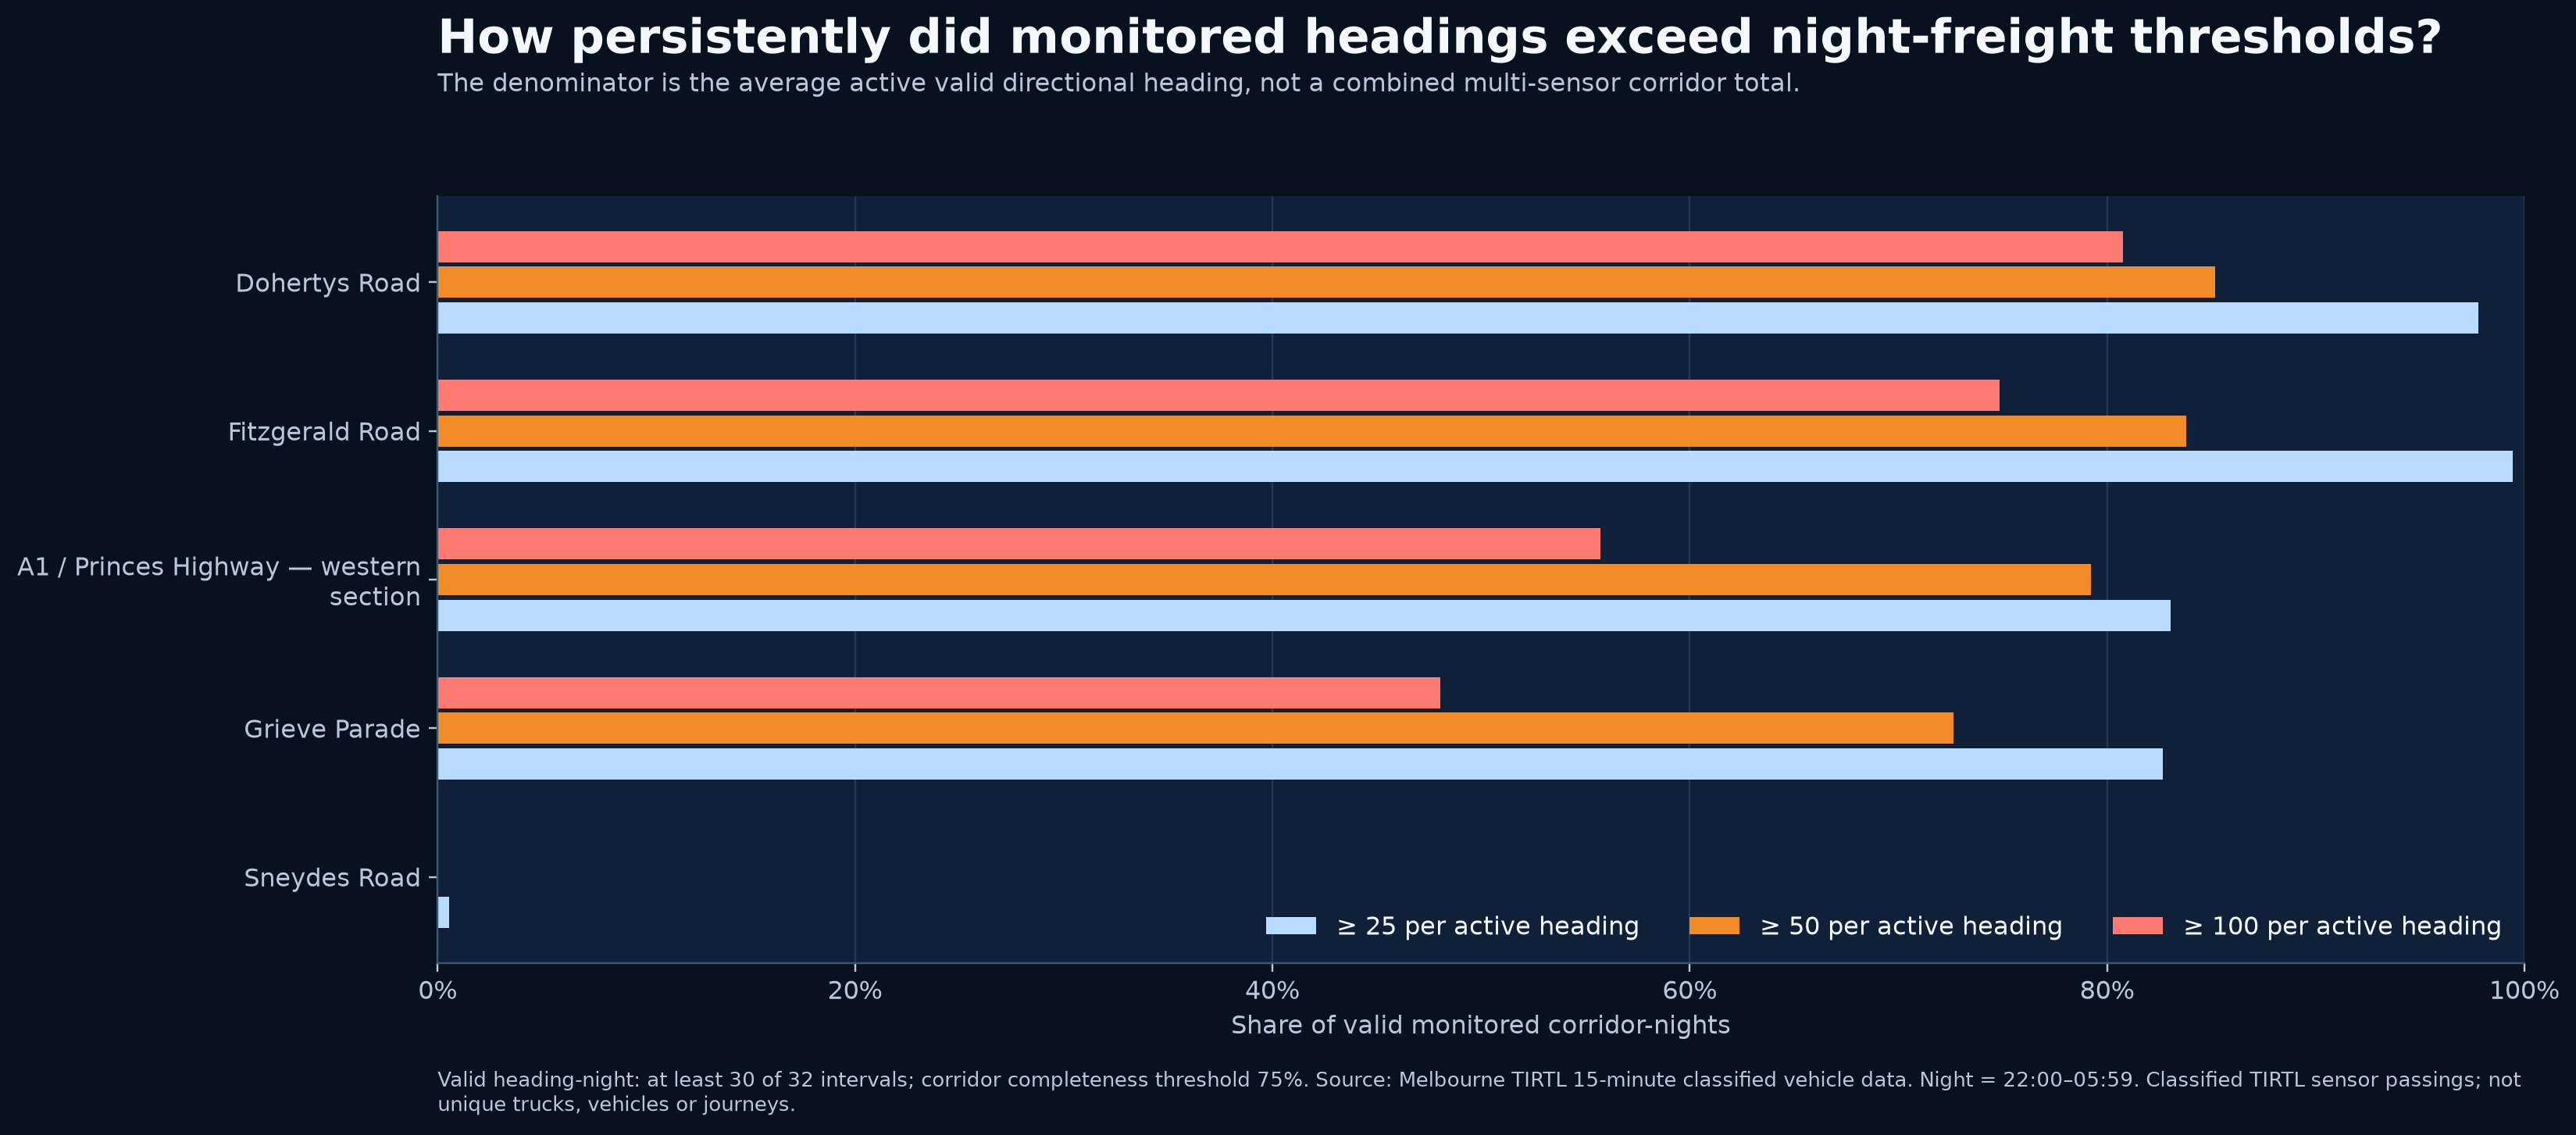
This measures the percentage of valid nights on which the average active directional heading exceeded defined freight thresholds.
What it communicates: It distinguishes a persistent freight burden from a high average caused by only a few extreme nights. A high percentage means elevated freight was routine across the reporting period.
Interpretation: Thresholds apply to active valid directional headings, not combined multi-sensor corridor totals.
 This graph image could not be loaded. Generate or republish the Version 12.3 dark graph pack.
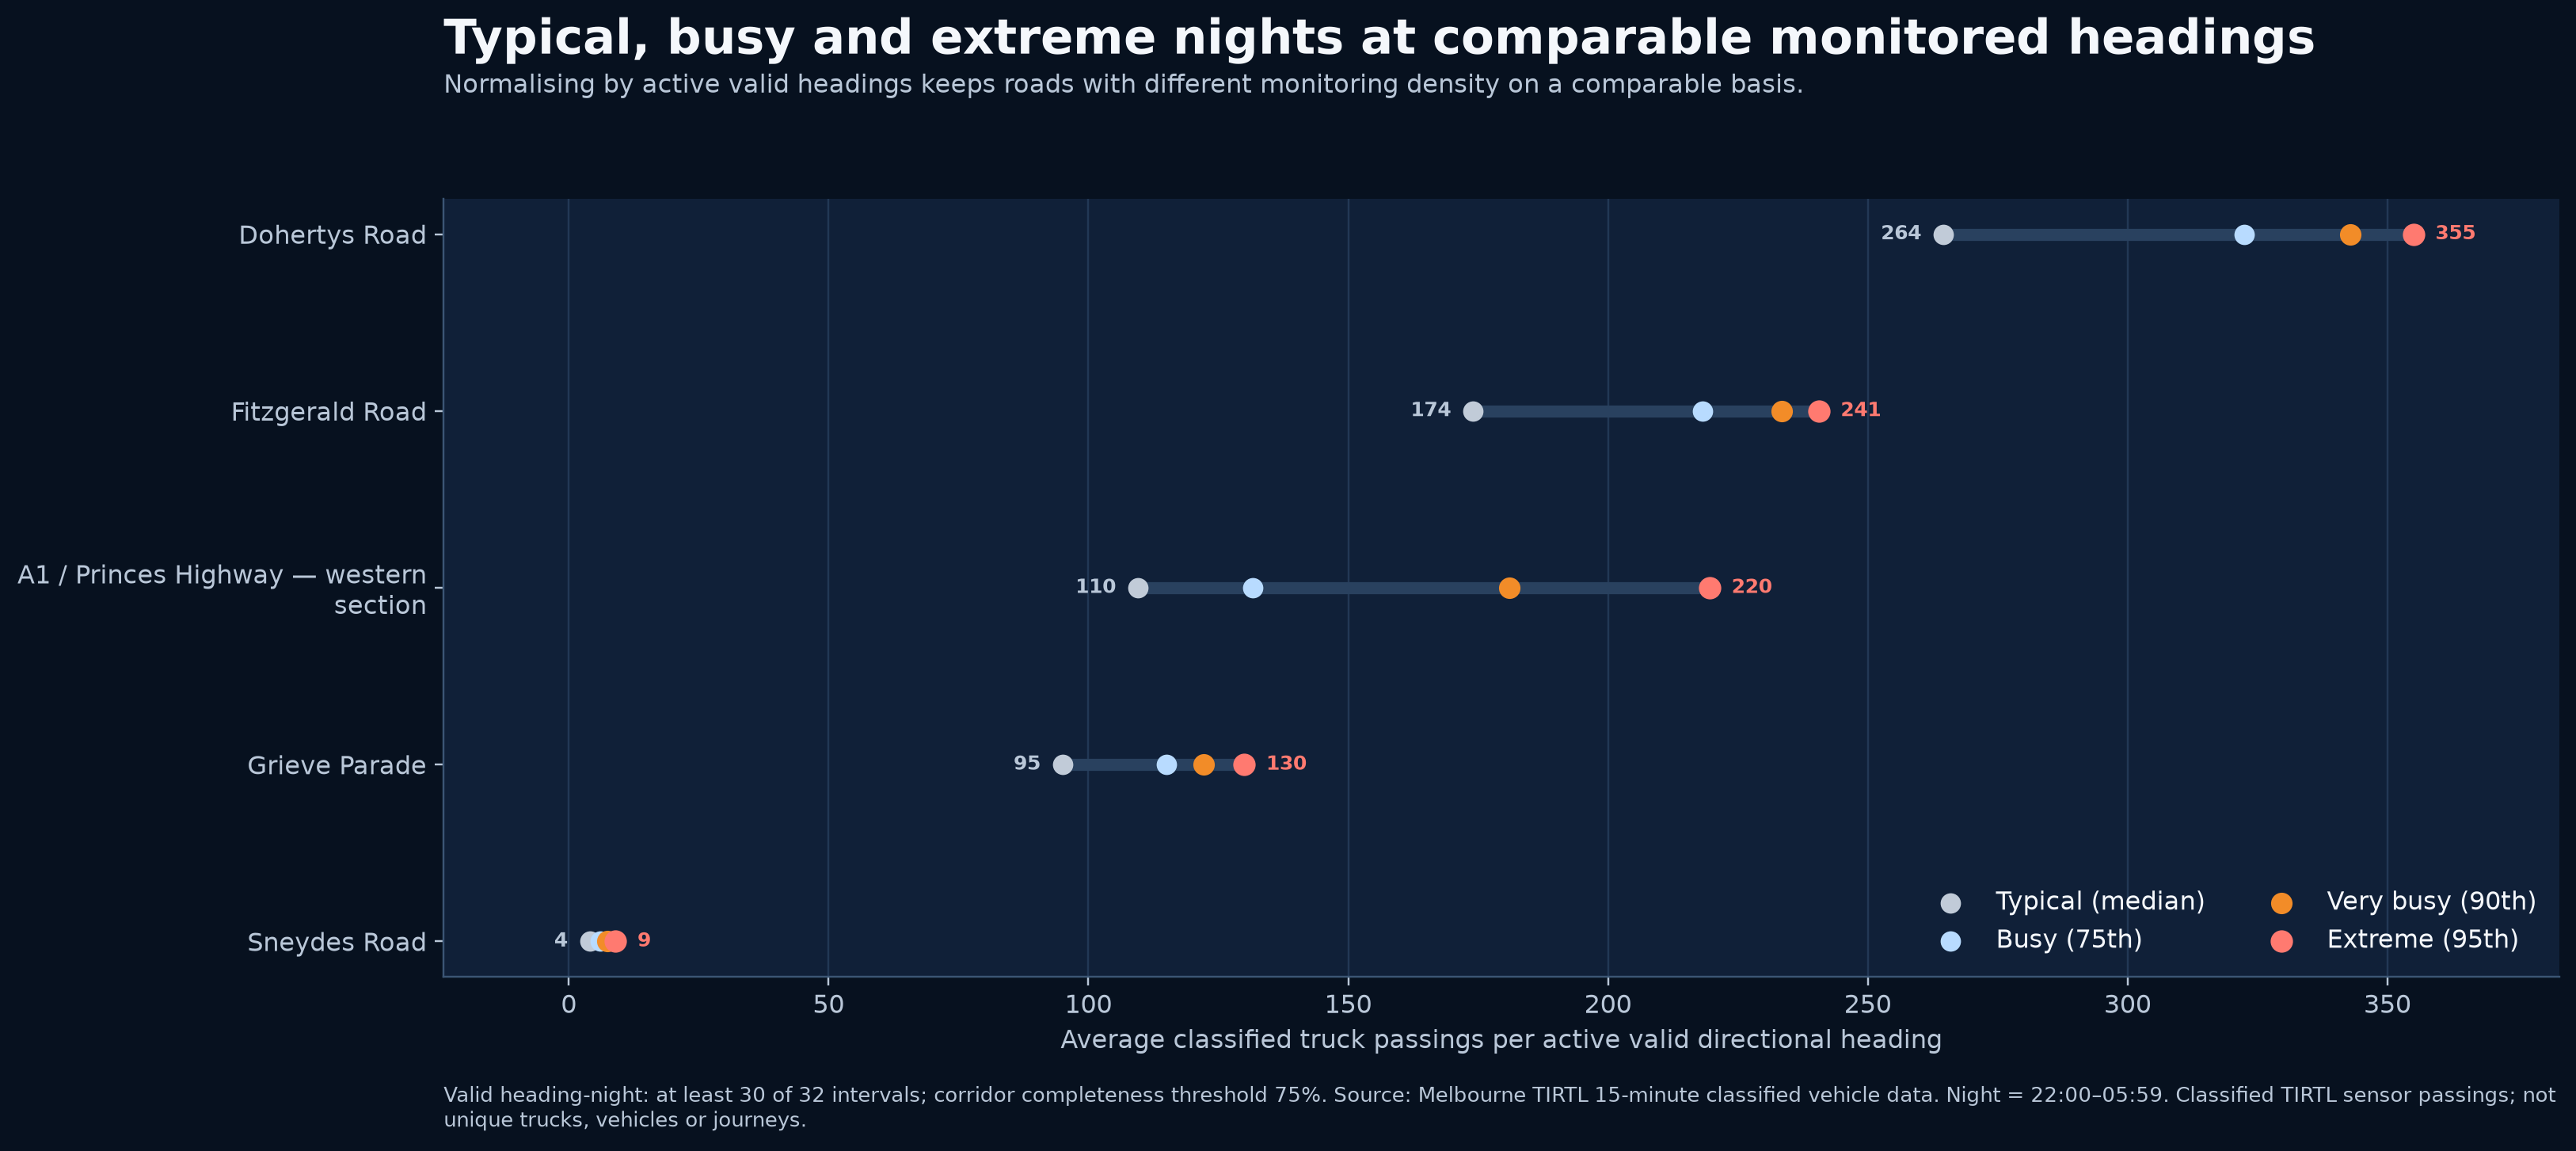
Median, 75th-, 90th- and 95th-percentile results show the distribution of monitored overnight freight rather than relying on a single average or maximum.
What it communicates: It communicates the normal burden and how much pressure rises on unusually busy nights. The labelled median and 95th percentile make the ordinary-versus-extreme difference immediately visible.
Interpretation: Percentiles describe valid monitored nights and are not unique-vehicle counts.
 This graph image could not be loaded. Generate or republish the Version 12.3 dark graph pack.
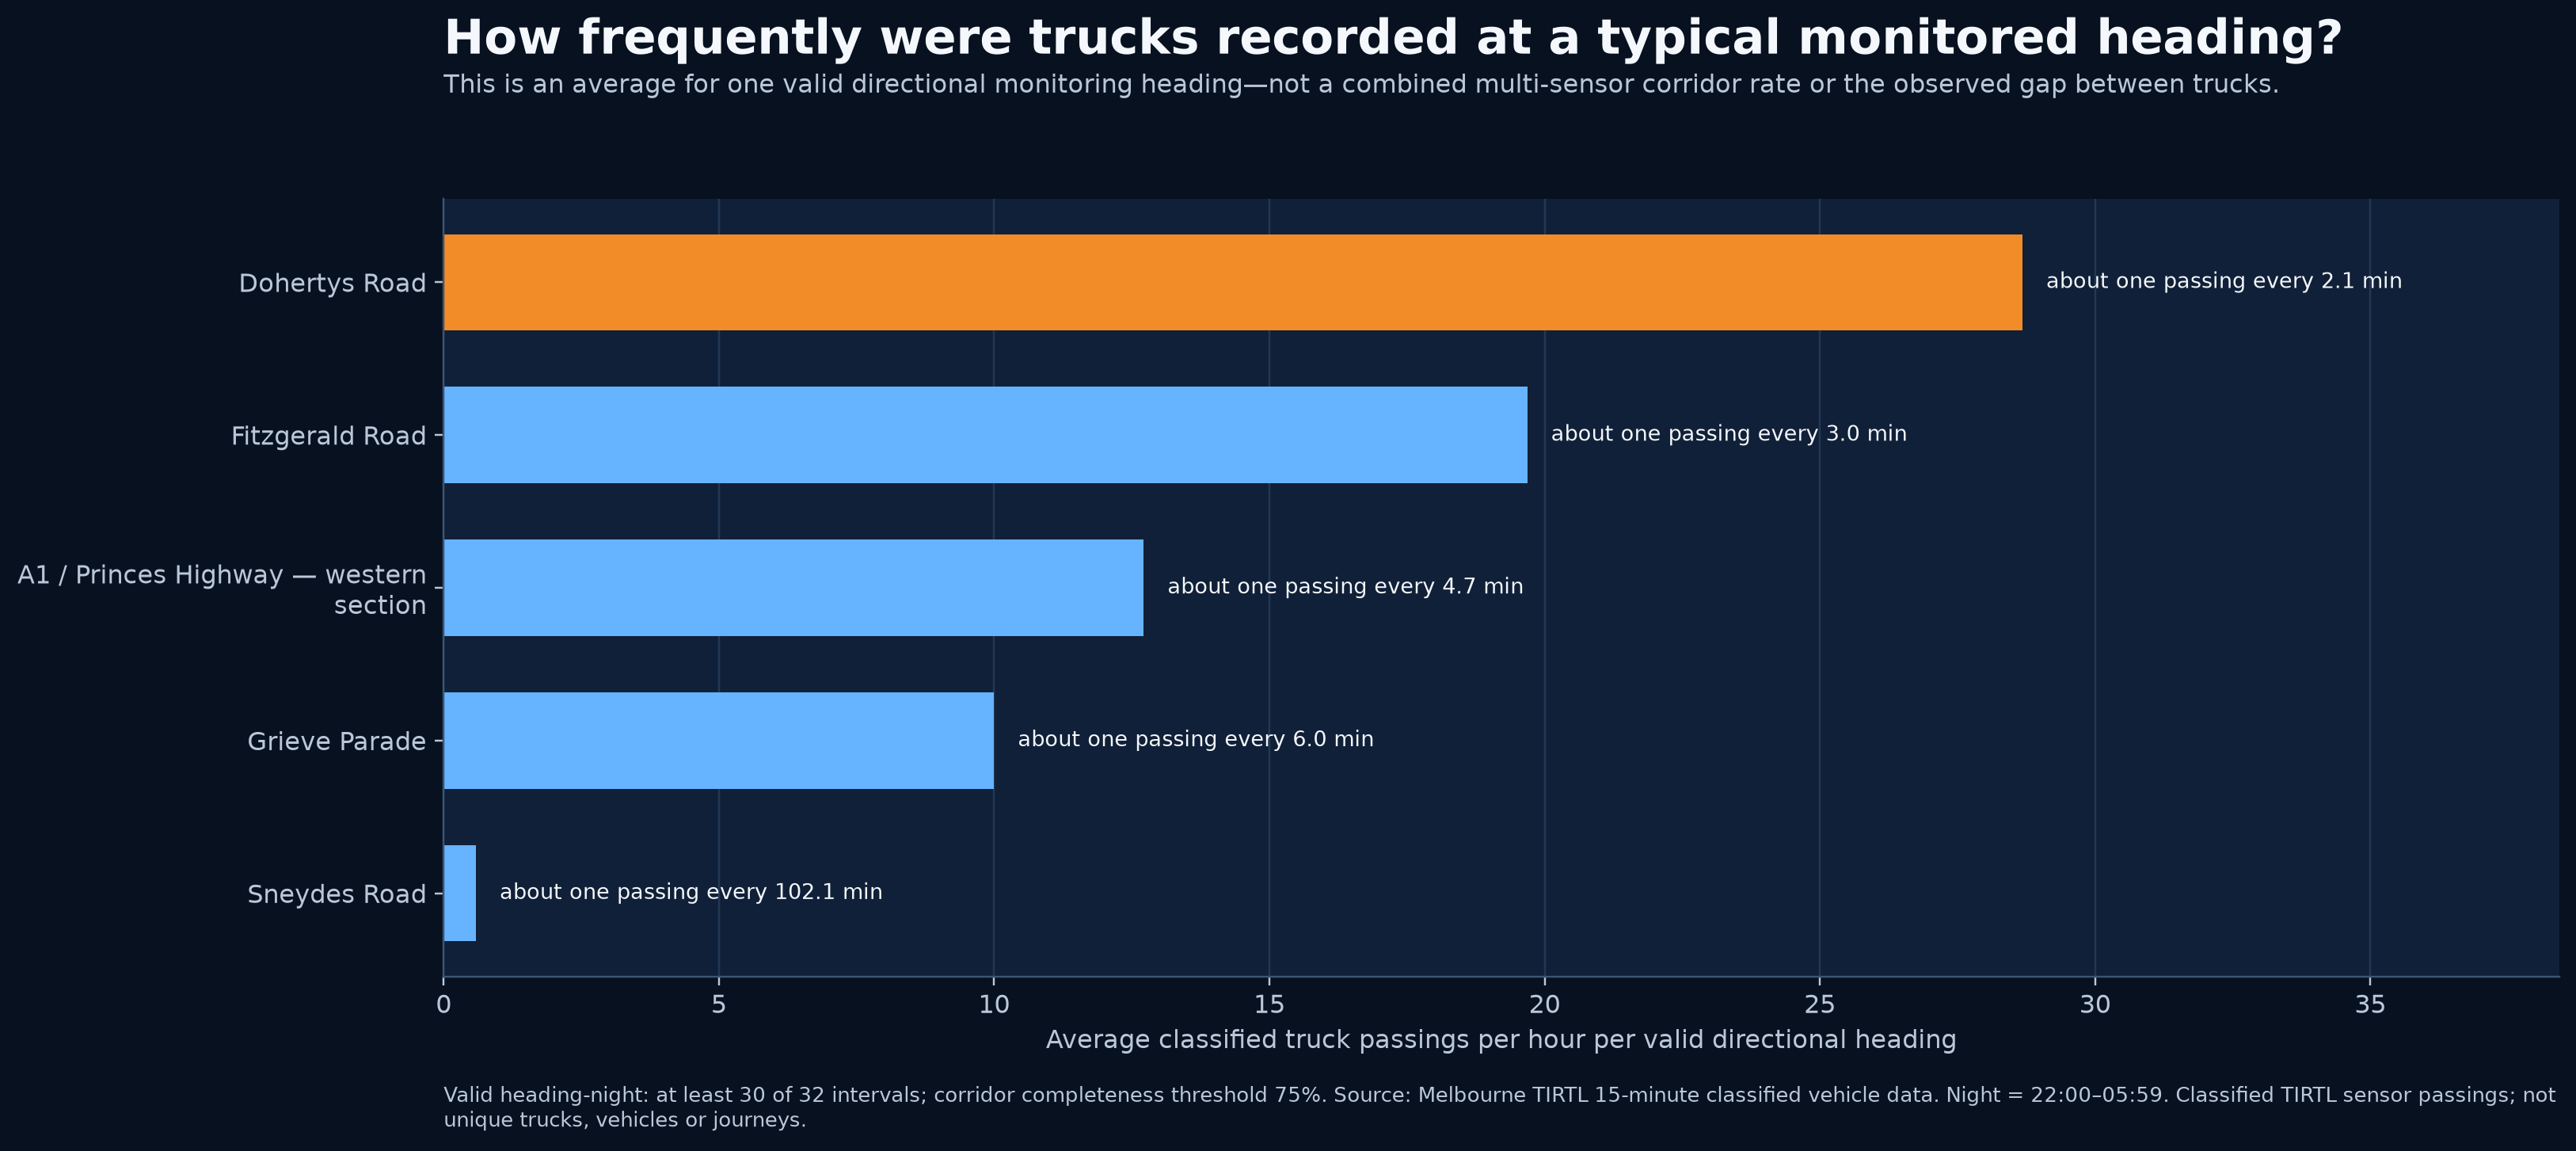
This translates average passings at one valid directional heading into the approximate number of minutes per recorded truck passing across the eight-hour night.
What it communicates: It gives politicians and residents an intuitive sense of freight intensity. A shorter interval means trucks were recorded more frequently at the monitored direction.
Interpretation: This is an eight-hour average—not the literal uninterrupted gap between every pair of trucks.
 This graph image could not be loaded. Generate or republish the Version 12.3 dark graph pack.
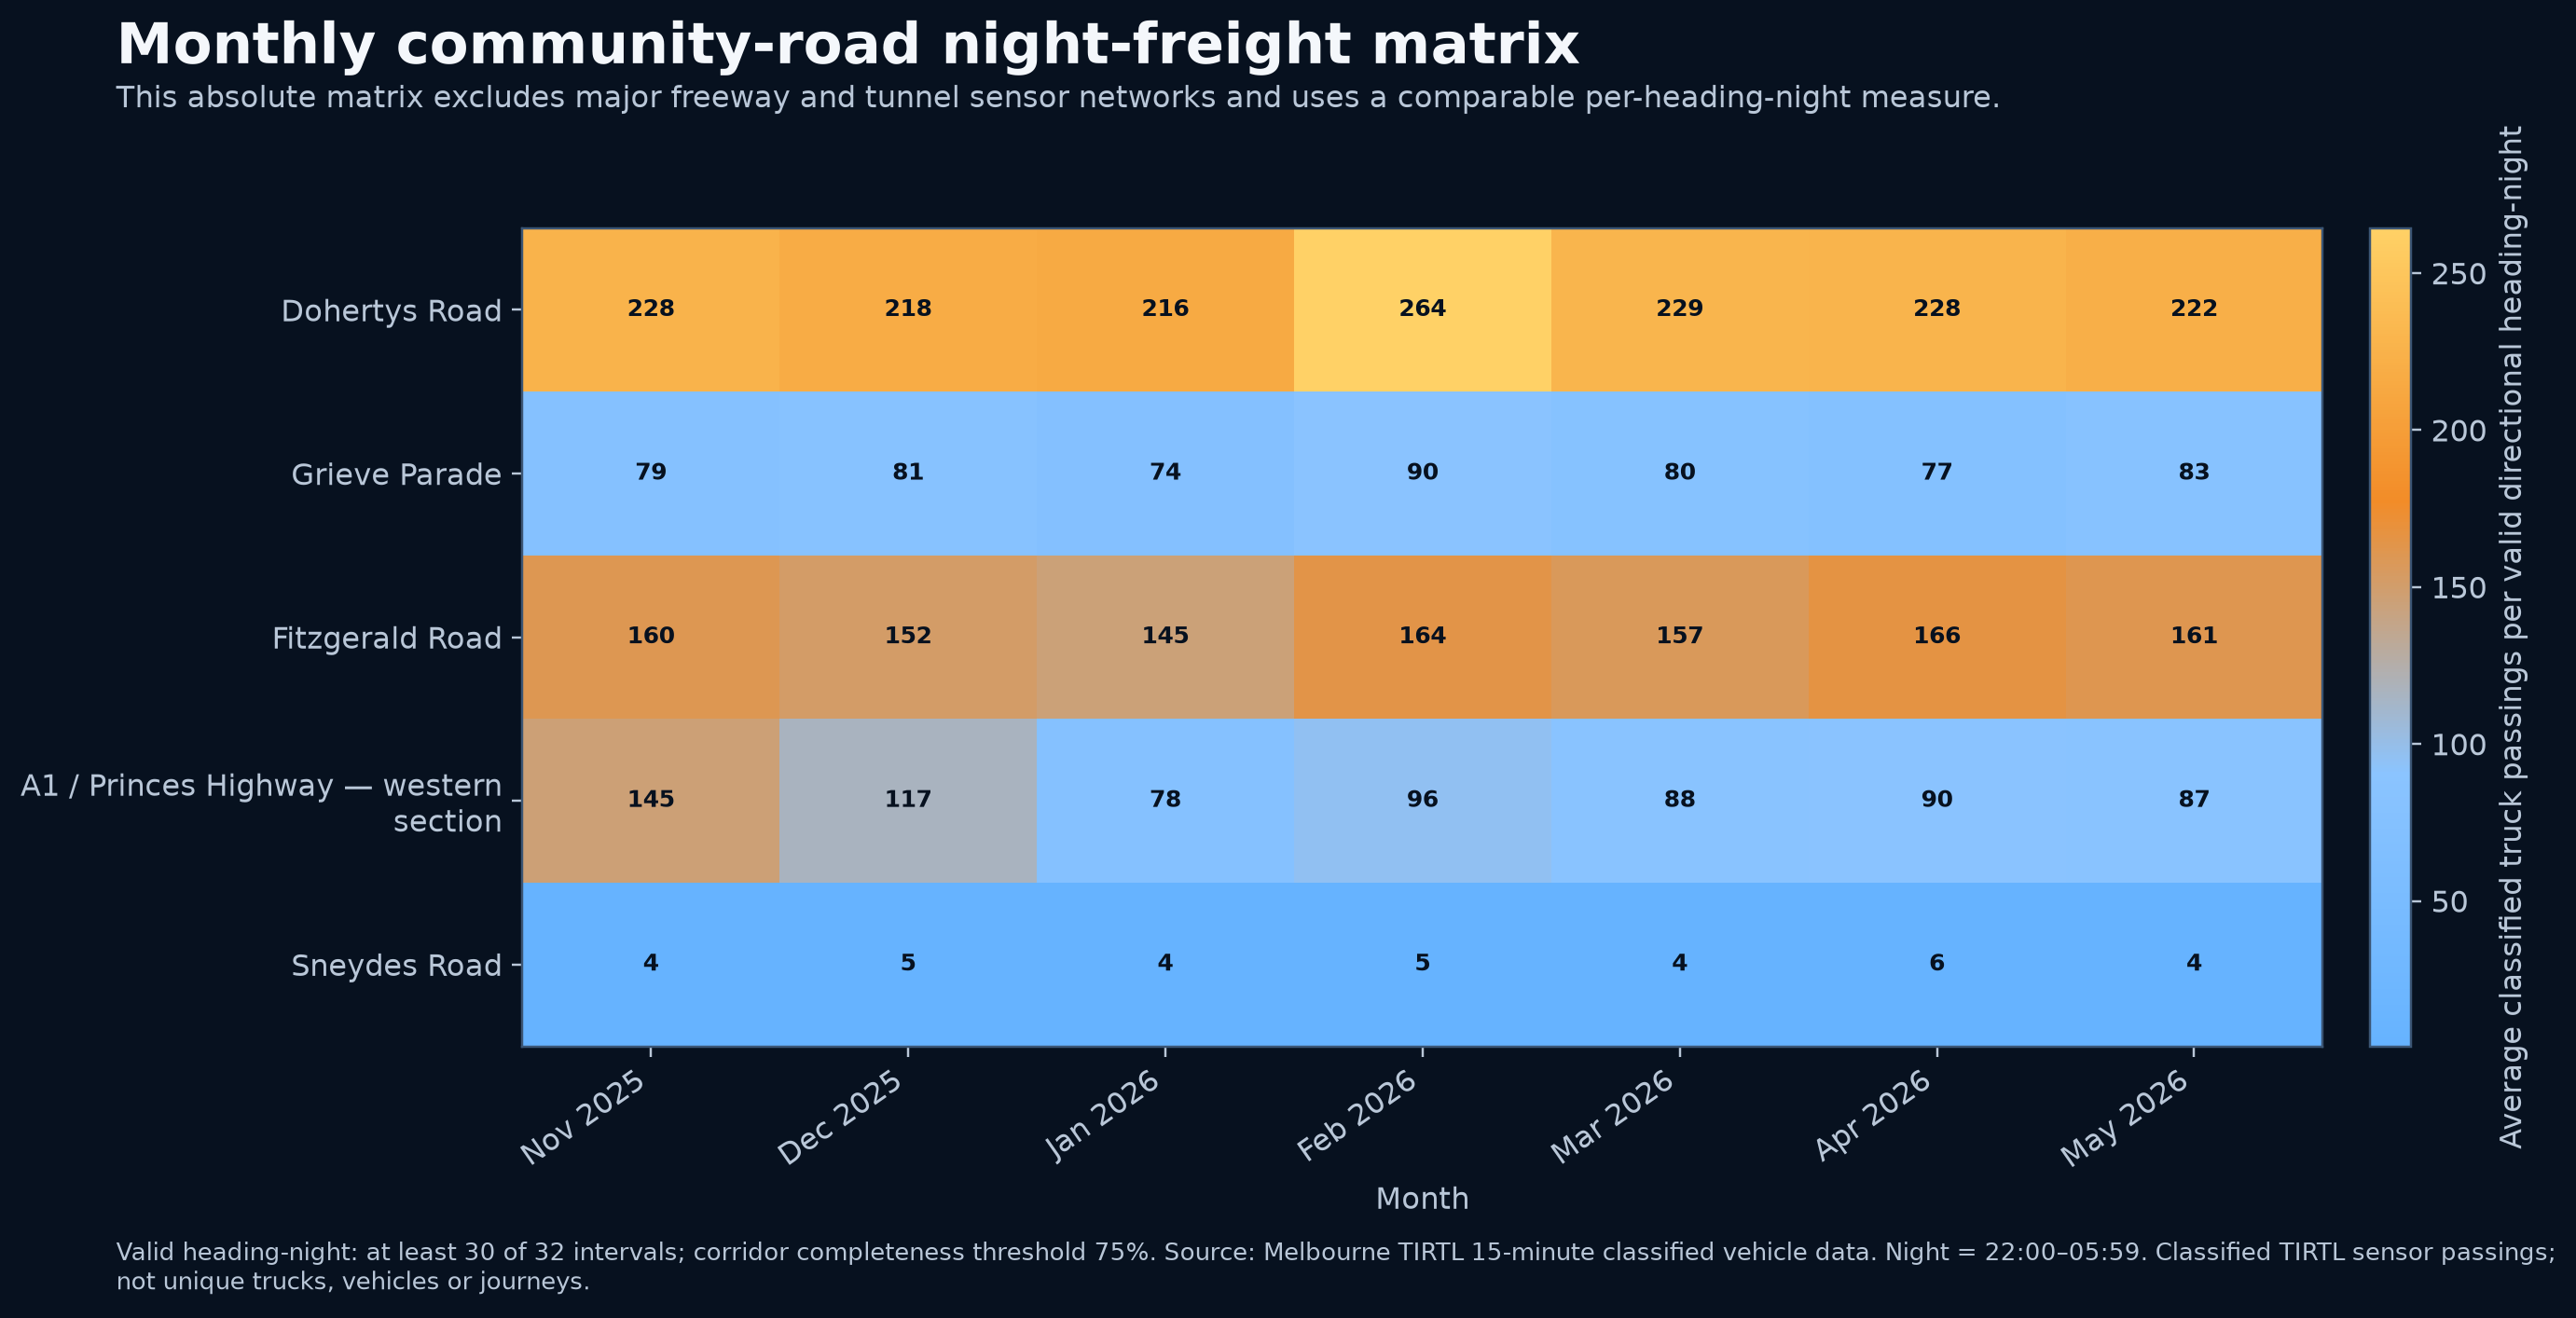
The matrix compares actual monthly average passings per valid heading-night across several roads at once.
What it communicates: It makes the overall hierarchy and month-to-month changes easy to scan. Darker or stronger cells identify higher absolute freight exposure.
Interpretation: Grey or blank cells mean no qualifying result—not zero freight activity.
 This graph image could not be loaded. Generate or republish the Version 12.3 dark graph pack.
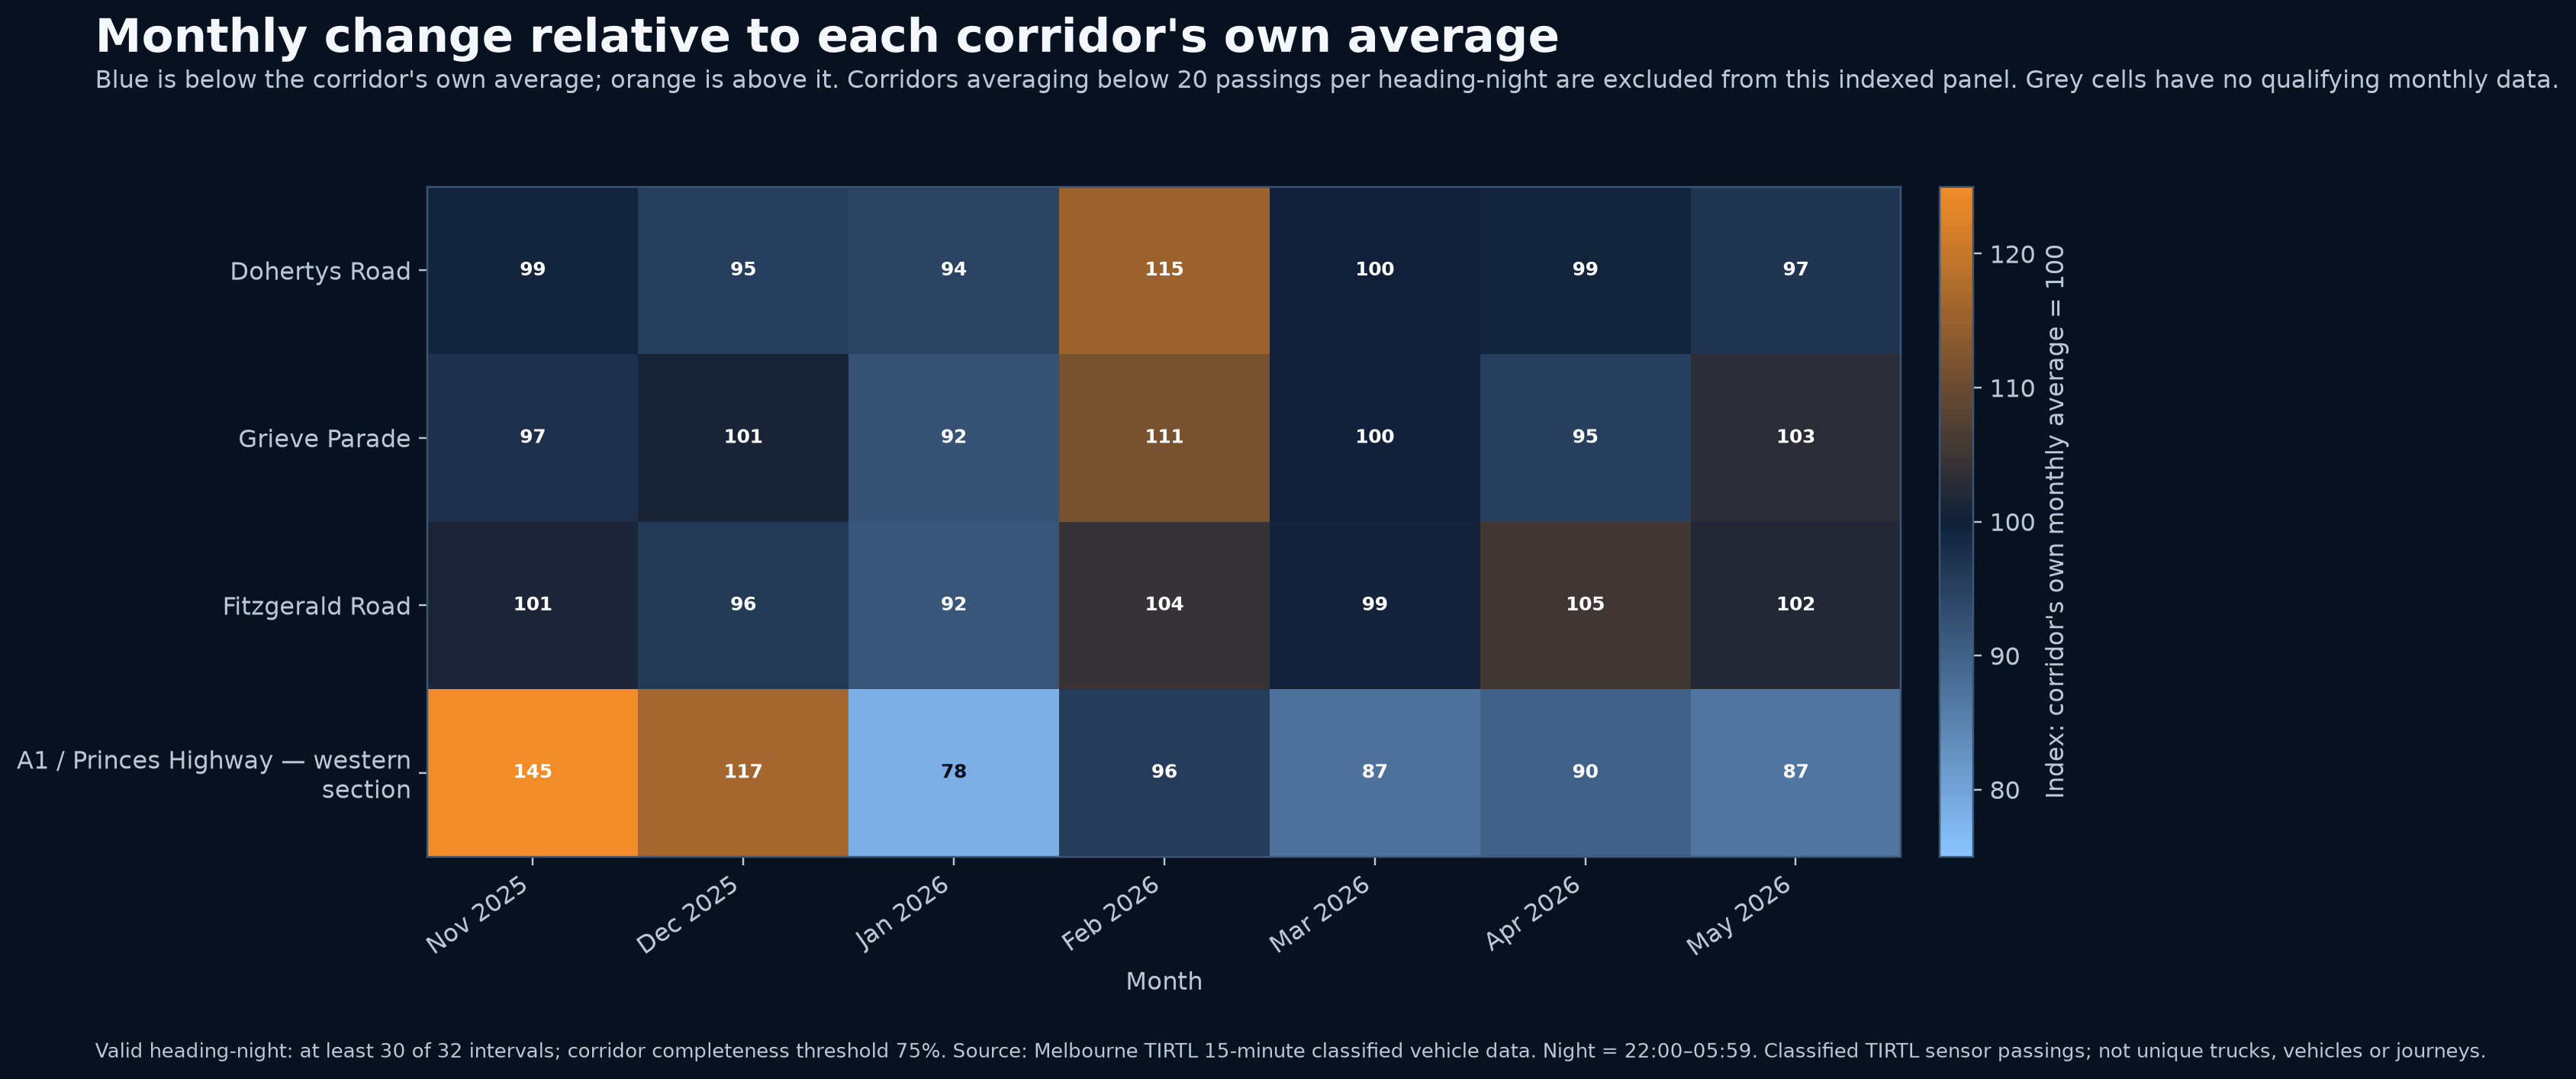
Each road is compared with its own reporting-period monthly average, so the matrix highlights unusual months without allowing higher-volume roads to dominate the colour scale.
What it communicates: It is useful for spotting shared network-wide changes, isolated corridor shifts and months that warrant investigation against disruptions, works or freight activity.
Interpretation: Low-volume roads are excluded from indexed comparisons to avoid exaggerated percentage movements.
Select a road and switch between six publication-ready views.
 This road graph could not be loaded. Check that the Version 12.3 dark graph pack is published.
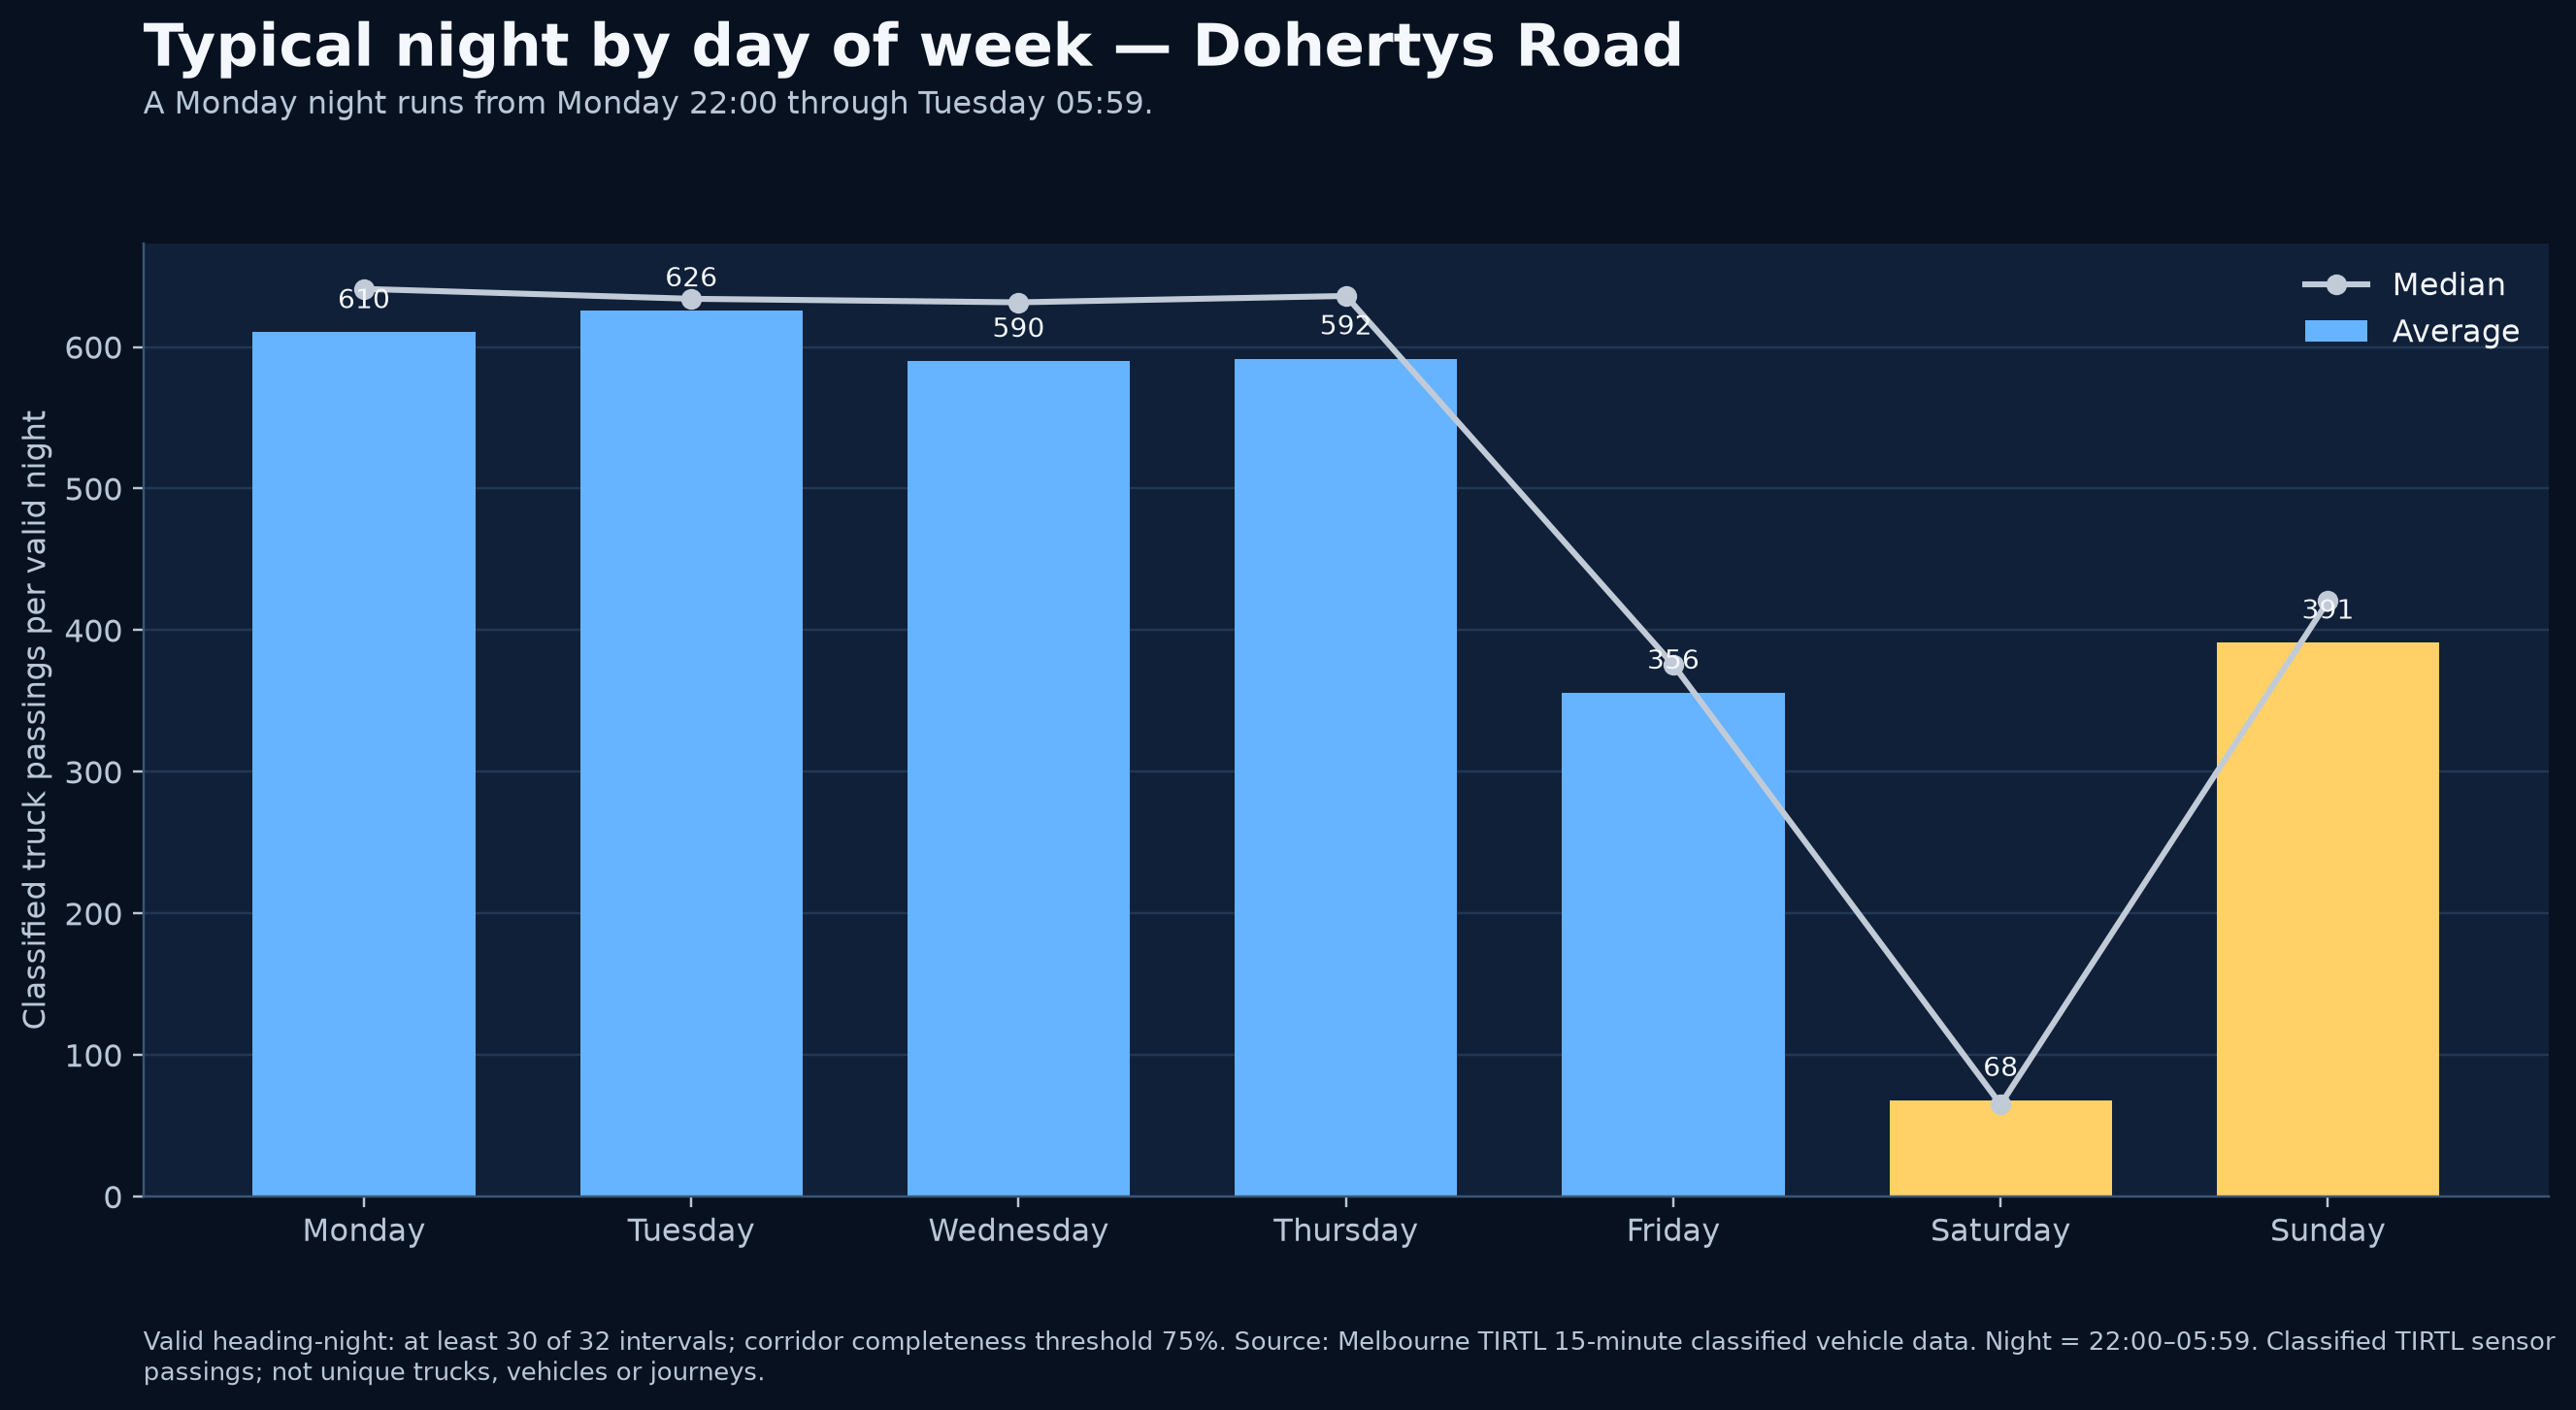
This graph compares average and median truck passings for nights beginning Monday through Sunday. It reveals the recurring working-week pattern and the scale of the weekend reduction.
Policy relevance: Use it to identify whether overnight freight is a routine weekday burden and which nights should be prioritised for lighting, noise, safety or enforcement questions.
Interpretation: Friday night means Friday 22:00 through Saturday 05:59.
The primary comparison uses reviewed non-freeway site-headings so dense freeway sensor coverage does not dominate the regional result.
Total truck movements divided by total classified movements across reviewed non-freeway monitoring locations.
Source: reviewed non-freeway monitored site-headings. This is a monitored-location comparison, not a complete road census.
A coverage-adjusted intensity measure that reduces distortion from unequal monitoring duration.
Source: reviewed non-freeway monitored site-headings. The denominator is monitored heading-days.
| Region | Included monitored localities | Monitored headings | Coverage days | Truck movements | Weighted truck share | Median site truck share | Trucks / heading-day | Sites above 15% |
|---|
Source: reviewed non-freeway TIRTL site-headings. Monitored-heading and coverage-day counts are integral to interpretation.
Validated findings from the published freight analysis.
Each circle is one monitored direction of travel. Use the freight metrics to compare qualifying monitored locations, and use the coverage tools to see where monitoring exists, where filters hide it and where the current release has no qualifying TIRTL evidence.
| Road | Rank | Truck share | Overnight traffic truck share | Truck passings | Exposure score |
|---|
Road comparison uses reviewed corridor-level exposure results. Sequential monitoring sites are not treated as unique journeys.
Use this table to identify both monitored samples and evidence gaps. Click a row to select and zoom to that government area.
| Government area | Area type | Physical sites | Directional headings | Distinct monitored roads | Heading-days | Monitoring footprint |
|---|---|---|---|---|---|---|
| Boundary layers and monitoring data are loading… | ||||||
The footprint classification describes the amount of qualifying TIRTL evidence available inside the installed polygon. It is not the percentage of roads monitored and must not be interpreted as complete geographic coverage.
The live report contains an interactive site-heading map. For printed copies, refer to the corridor rankings and downloadable map-layer data.
Map data: data/western_freight_map_layer.json.
The freight analysis identifies exposure. The next evidence joins determine whether infrastructure condition and investment are proportionate.
| Measured finding | What it may indicate | Evidence still required |
|---|---|---|
| Dohertys Road recorded the highest reviewed western non-freeway truck share. | Exceptional dependence on a community-facing industrial arterial. | Pavement-condition scores, resurfacing history, defect records and funded renewal works. |
| Trucks form a substantial share of overnight traffic on the highest-exposure corridors. | Potential night-time visibility, safety, noise and residential-amenity pressure. | Lighting audit, crash history, noise evidence and heavy-vehicle route-management records. |
| Western non-freeway monitored locations show concentrated freight exposure. | A case for testing whether maintenance and upgrade priorities reflect freight use. | Corridor-level maintenance, renewal and upgrade expenditure over a defined period. |
Interpretive statements are hypotheses for further testing, not findings of pavement failure or government neglect.
These questions convert the analytical findings into a clear accountability and evidence-gathering agenda.
The freight data identifies where the greatest exposure exists; this section records what additional evidence is needed before making asset-condition claims.
Truck volume, truck share, time-of-day patterns, overnight concentration and coverage-adjusted freight intensity.
Pavement-condition scores, resurfacing dates, defect records, lighting inventory, crash history and maintenance interventions.
Compare exposure rankings with corridor-level maintenance, renewal and upgrade expenditure over a defined period.
The analysis is designed to remain reproducible, transparent and resistant to selective quotation.