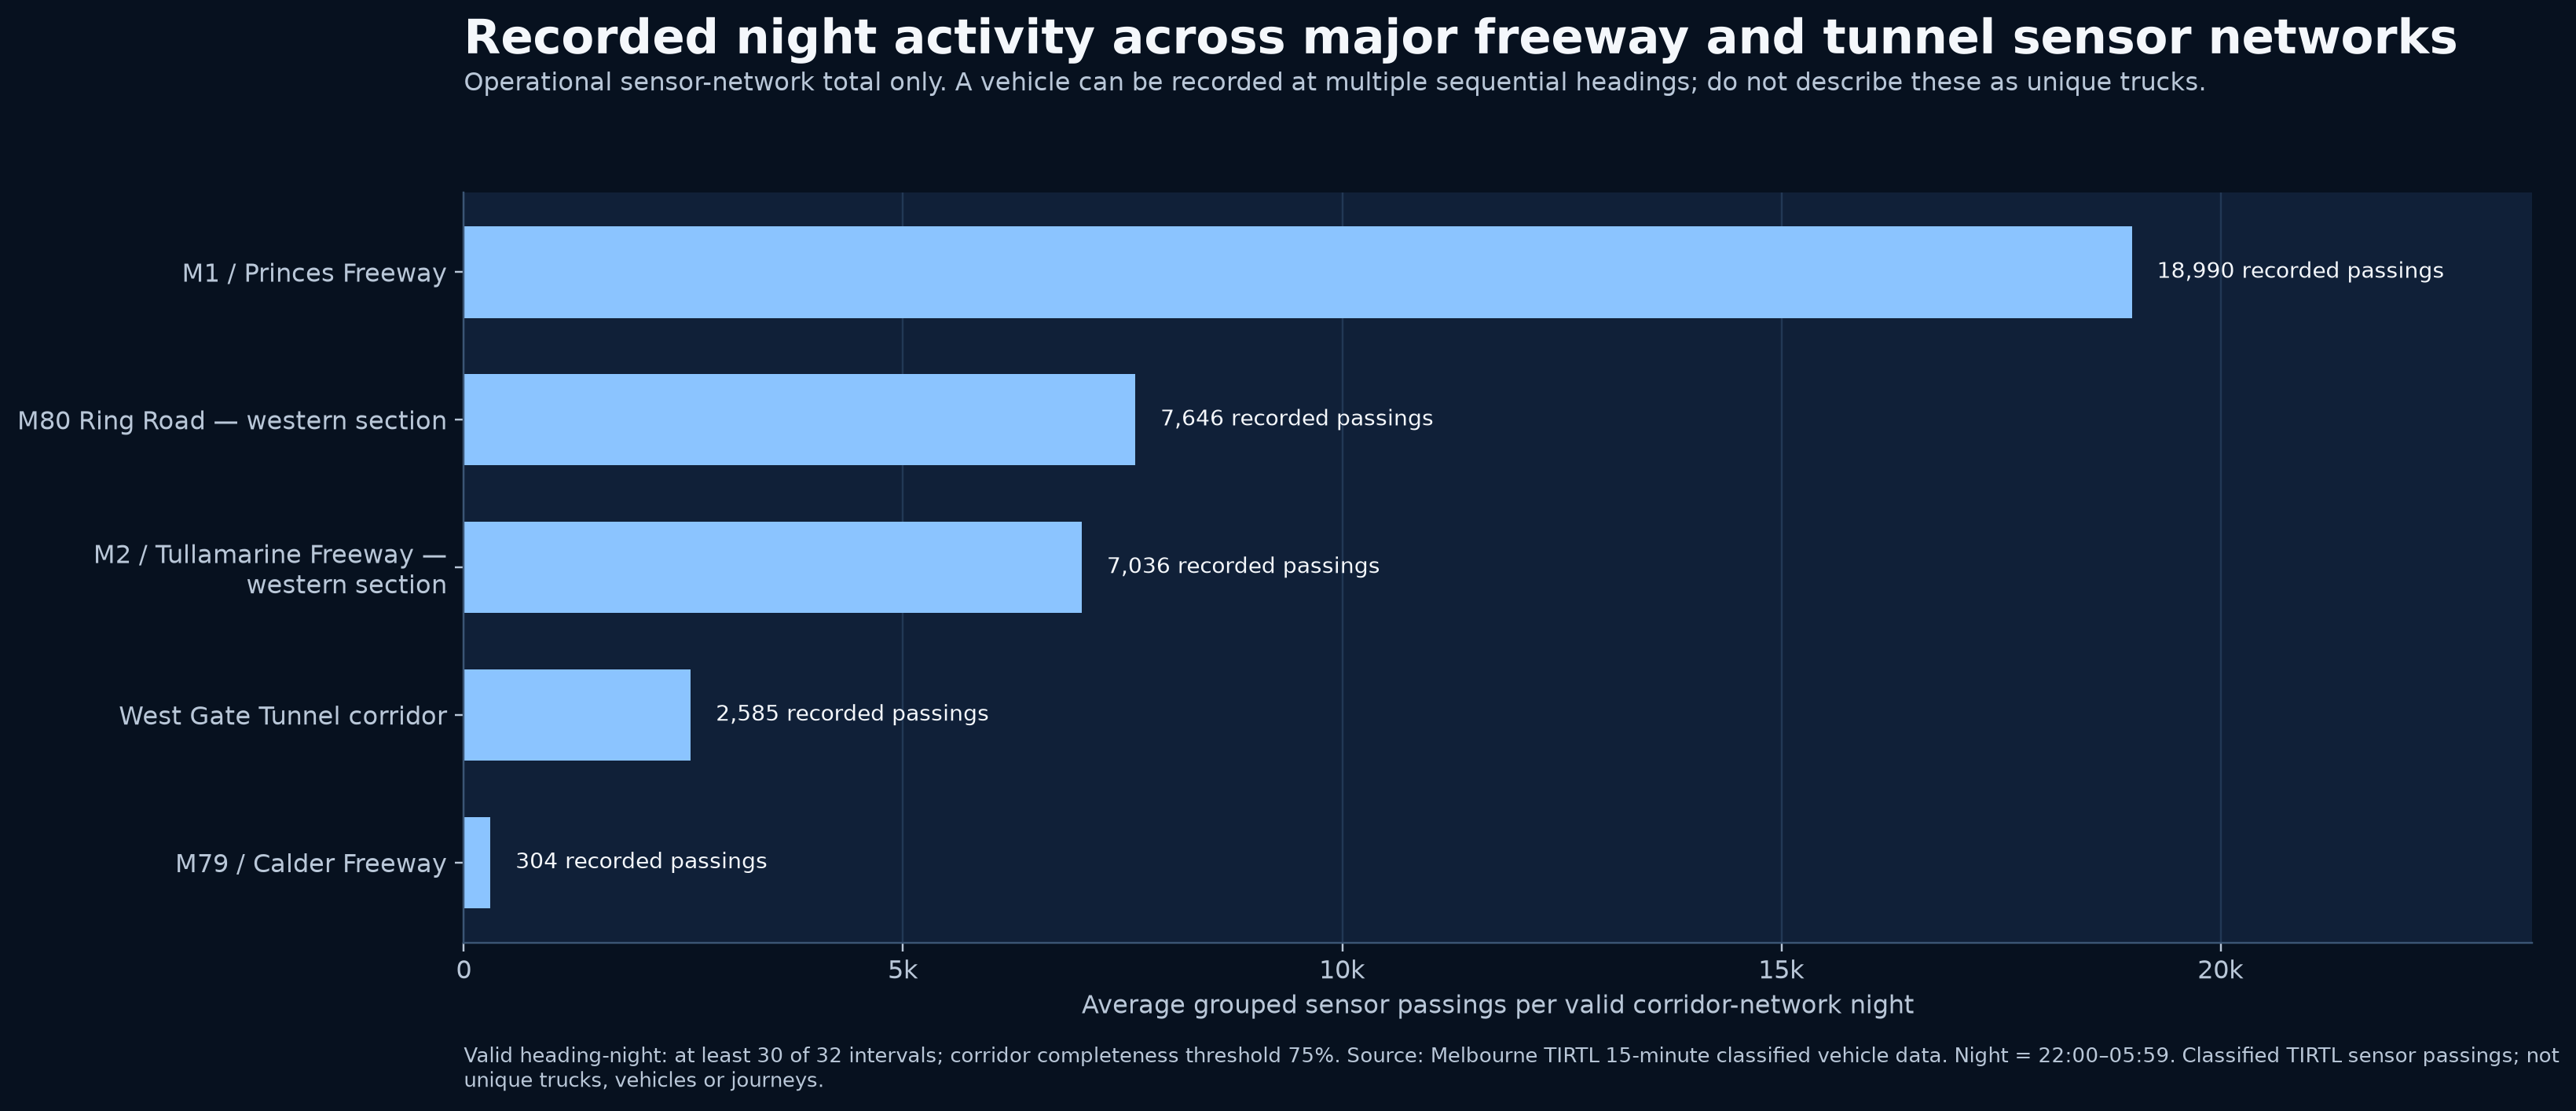
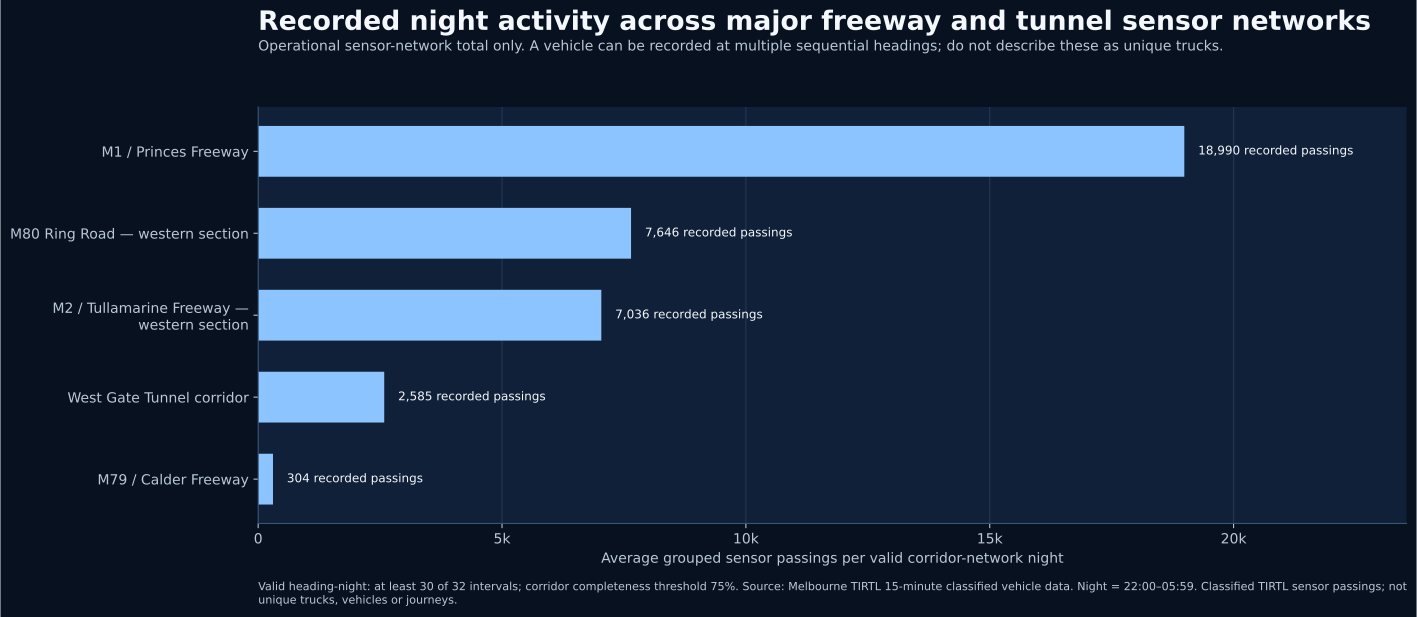
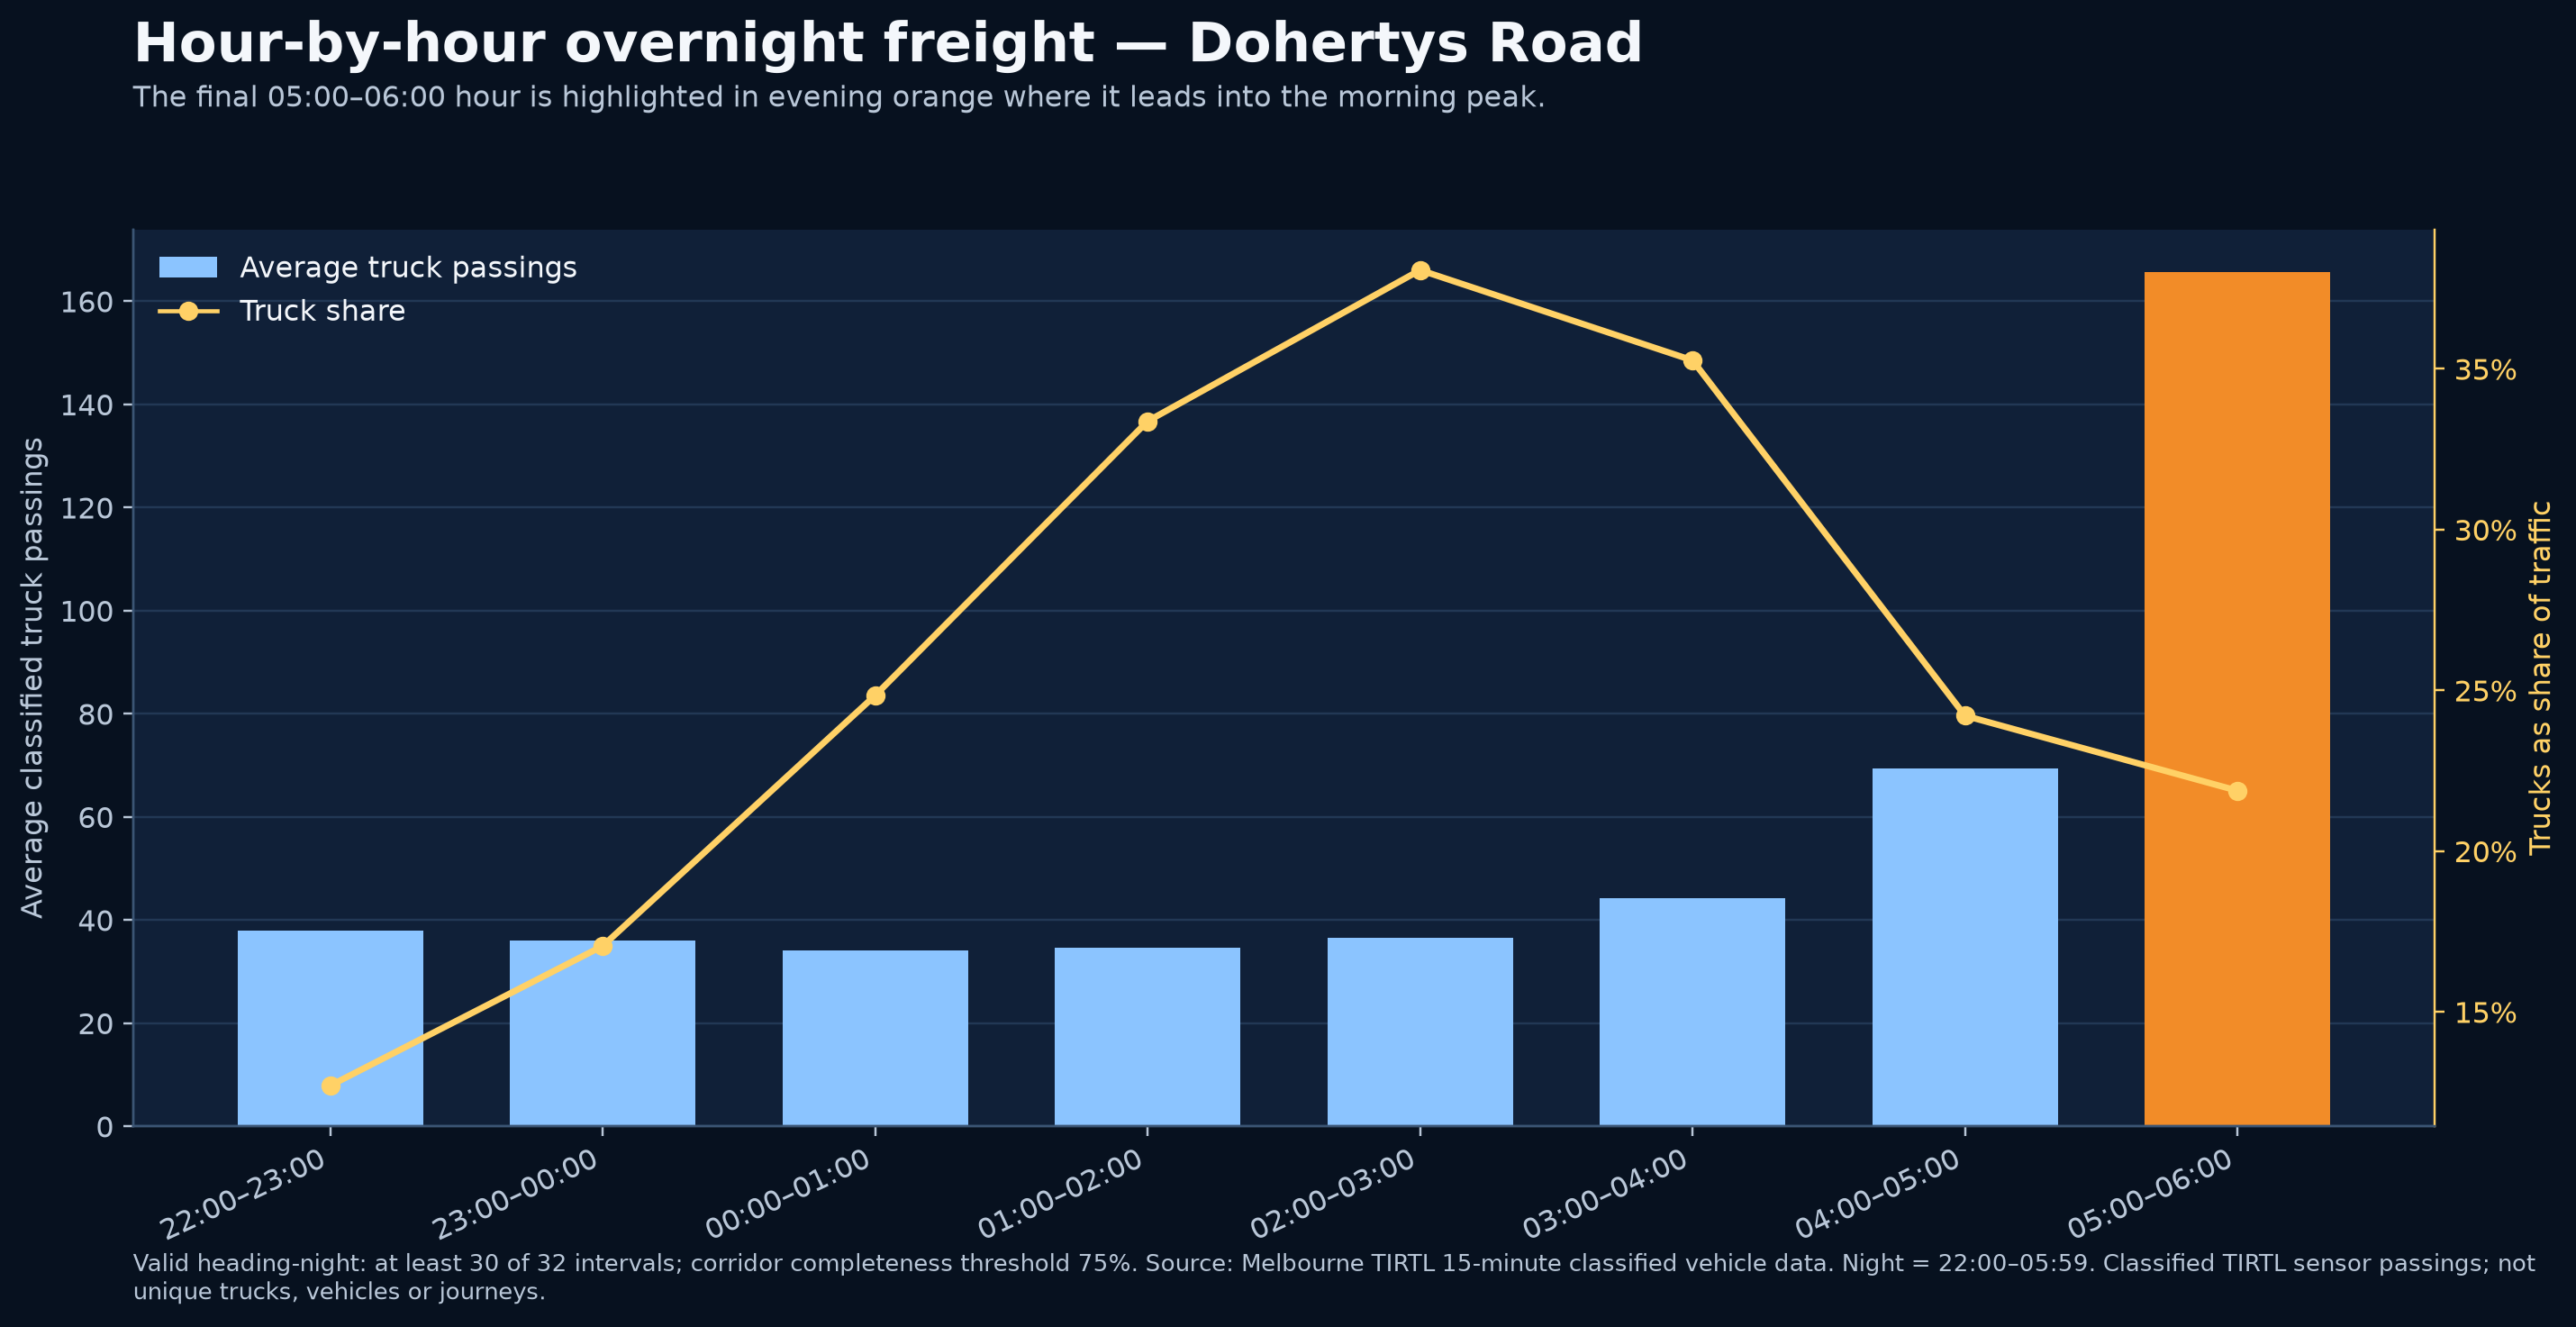
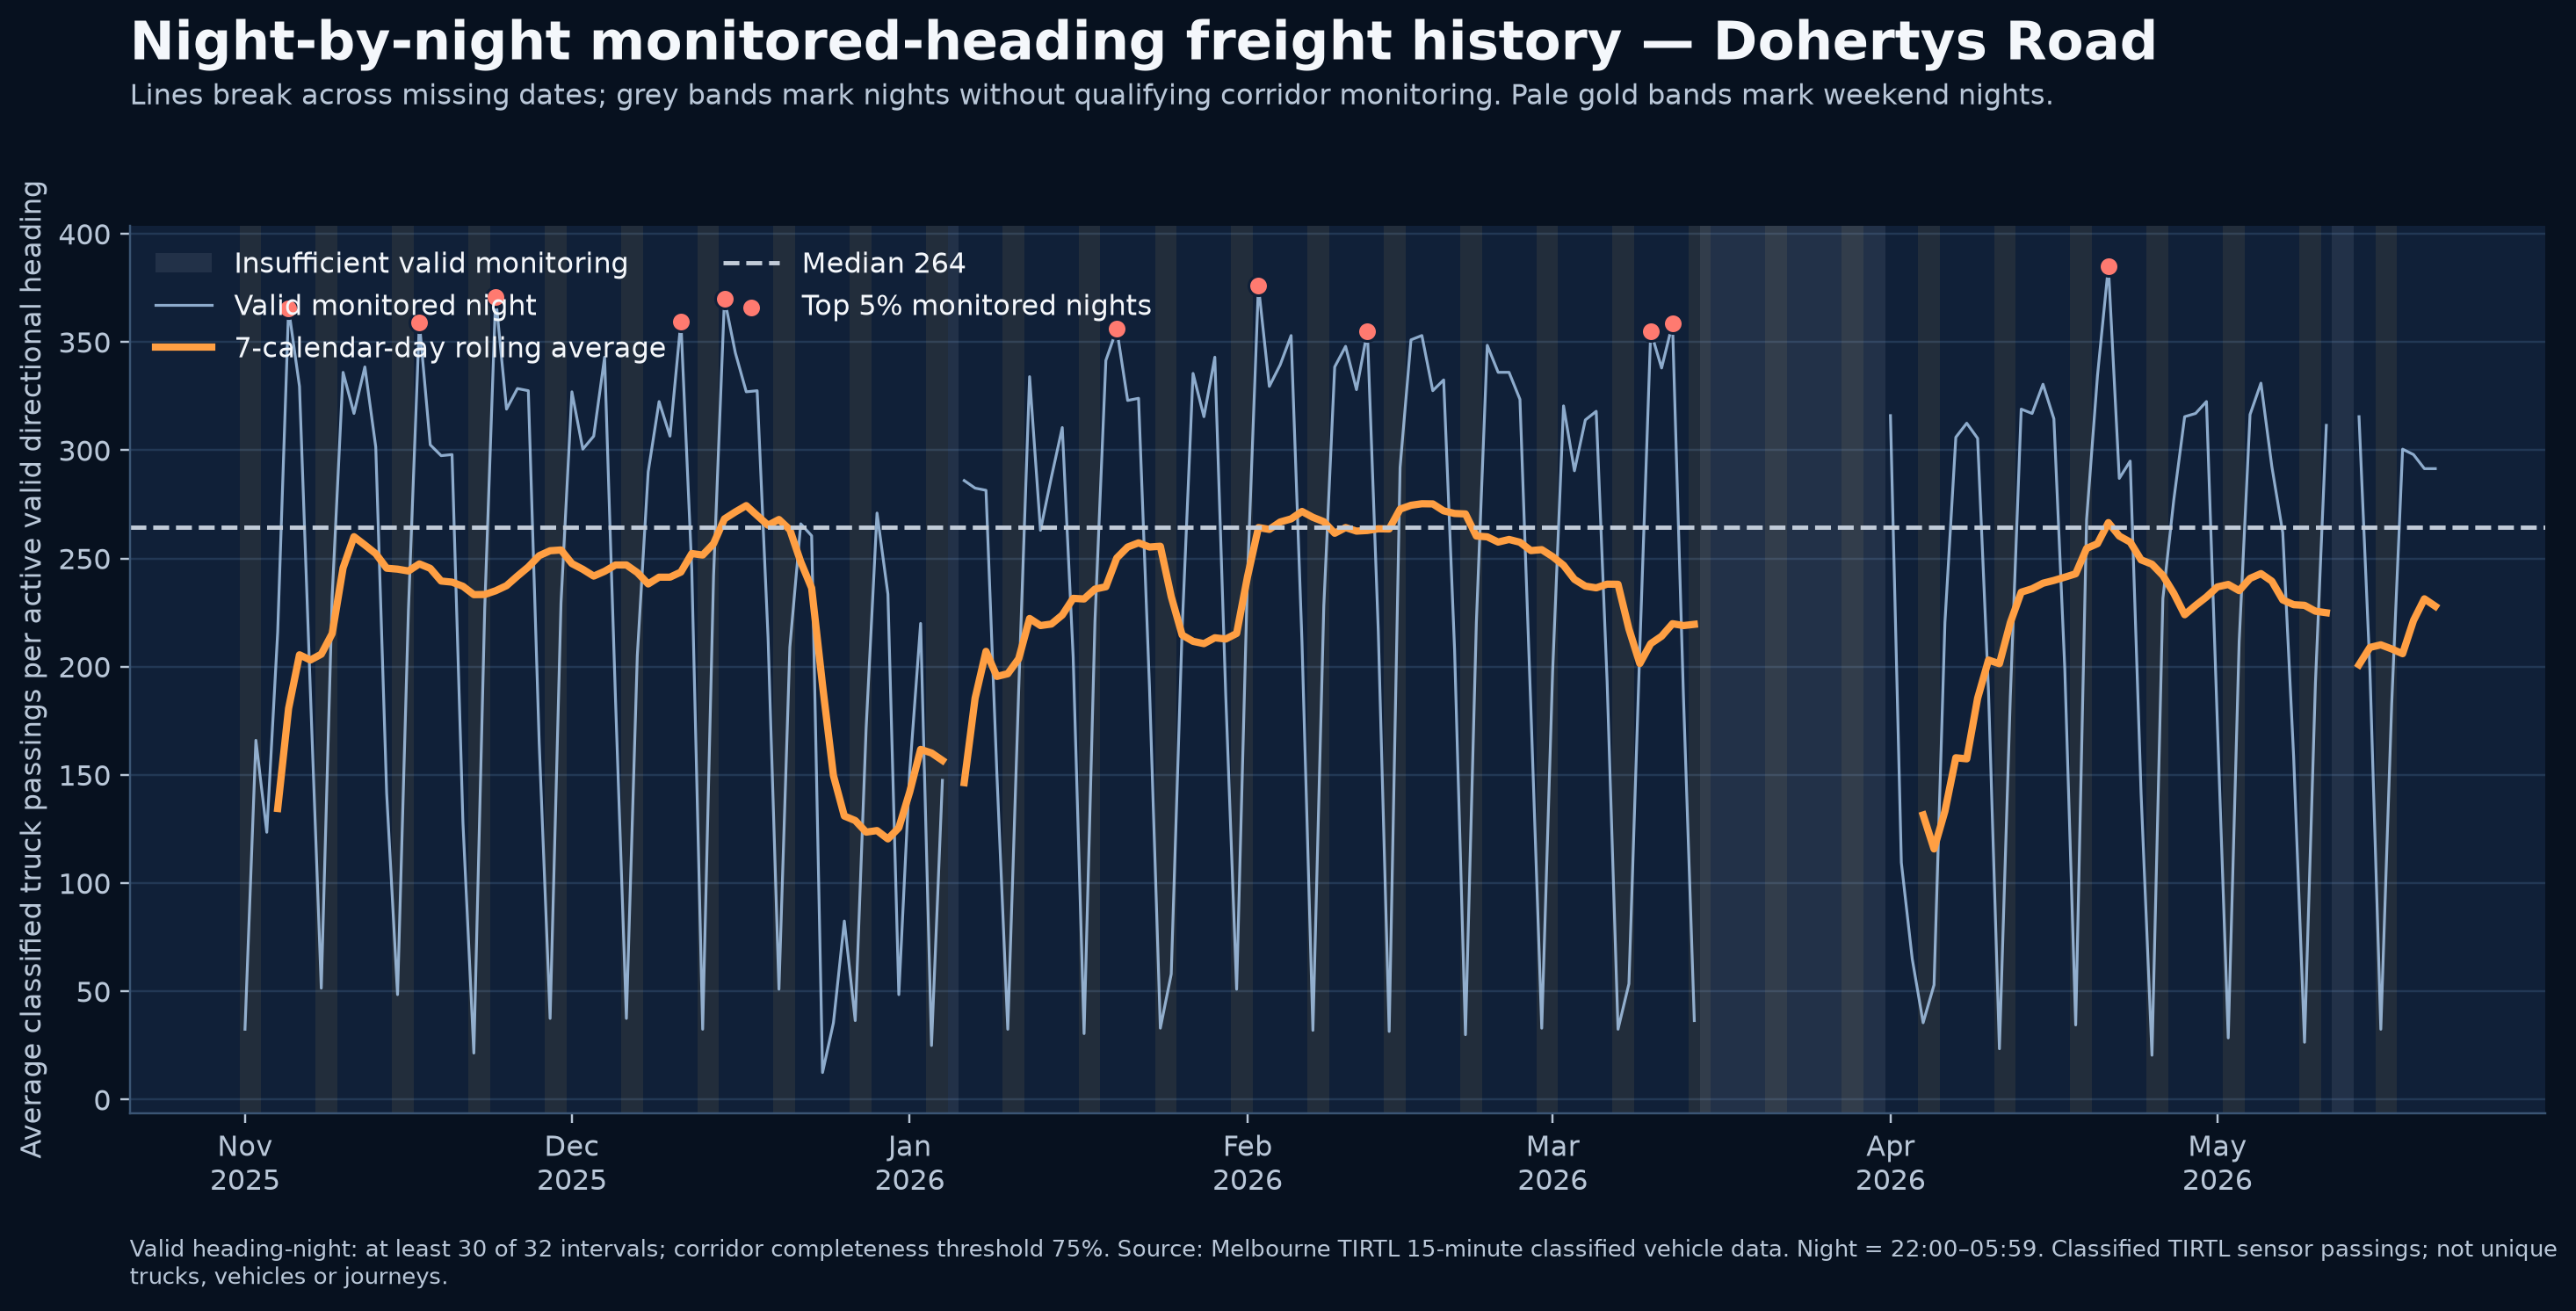
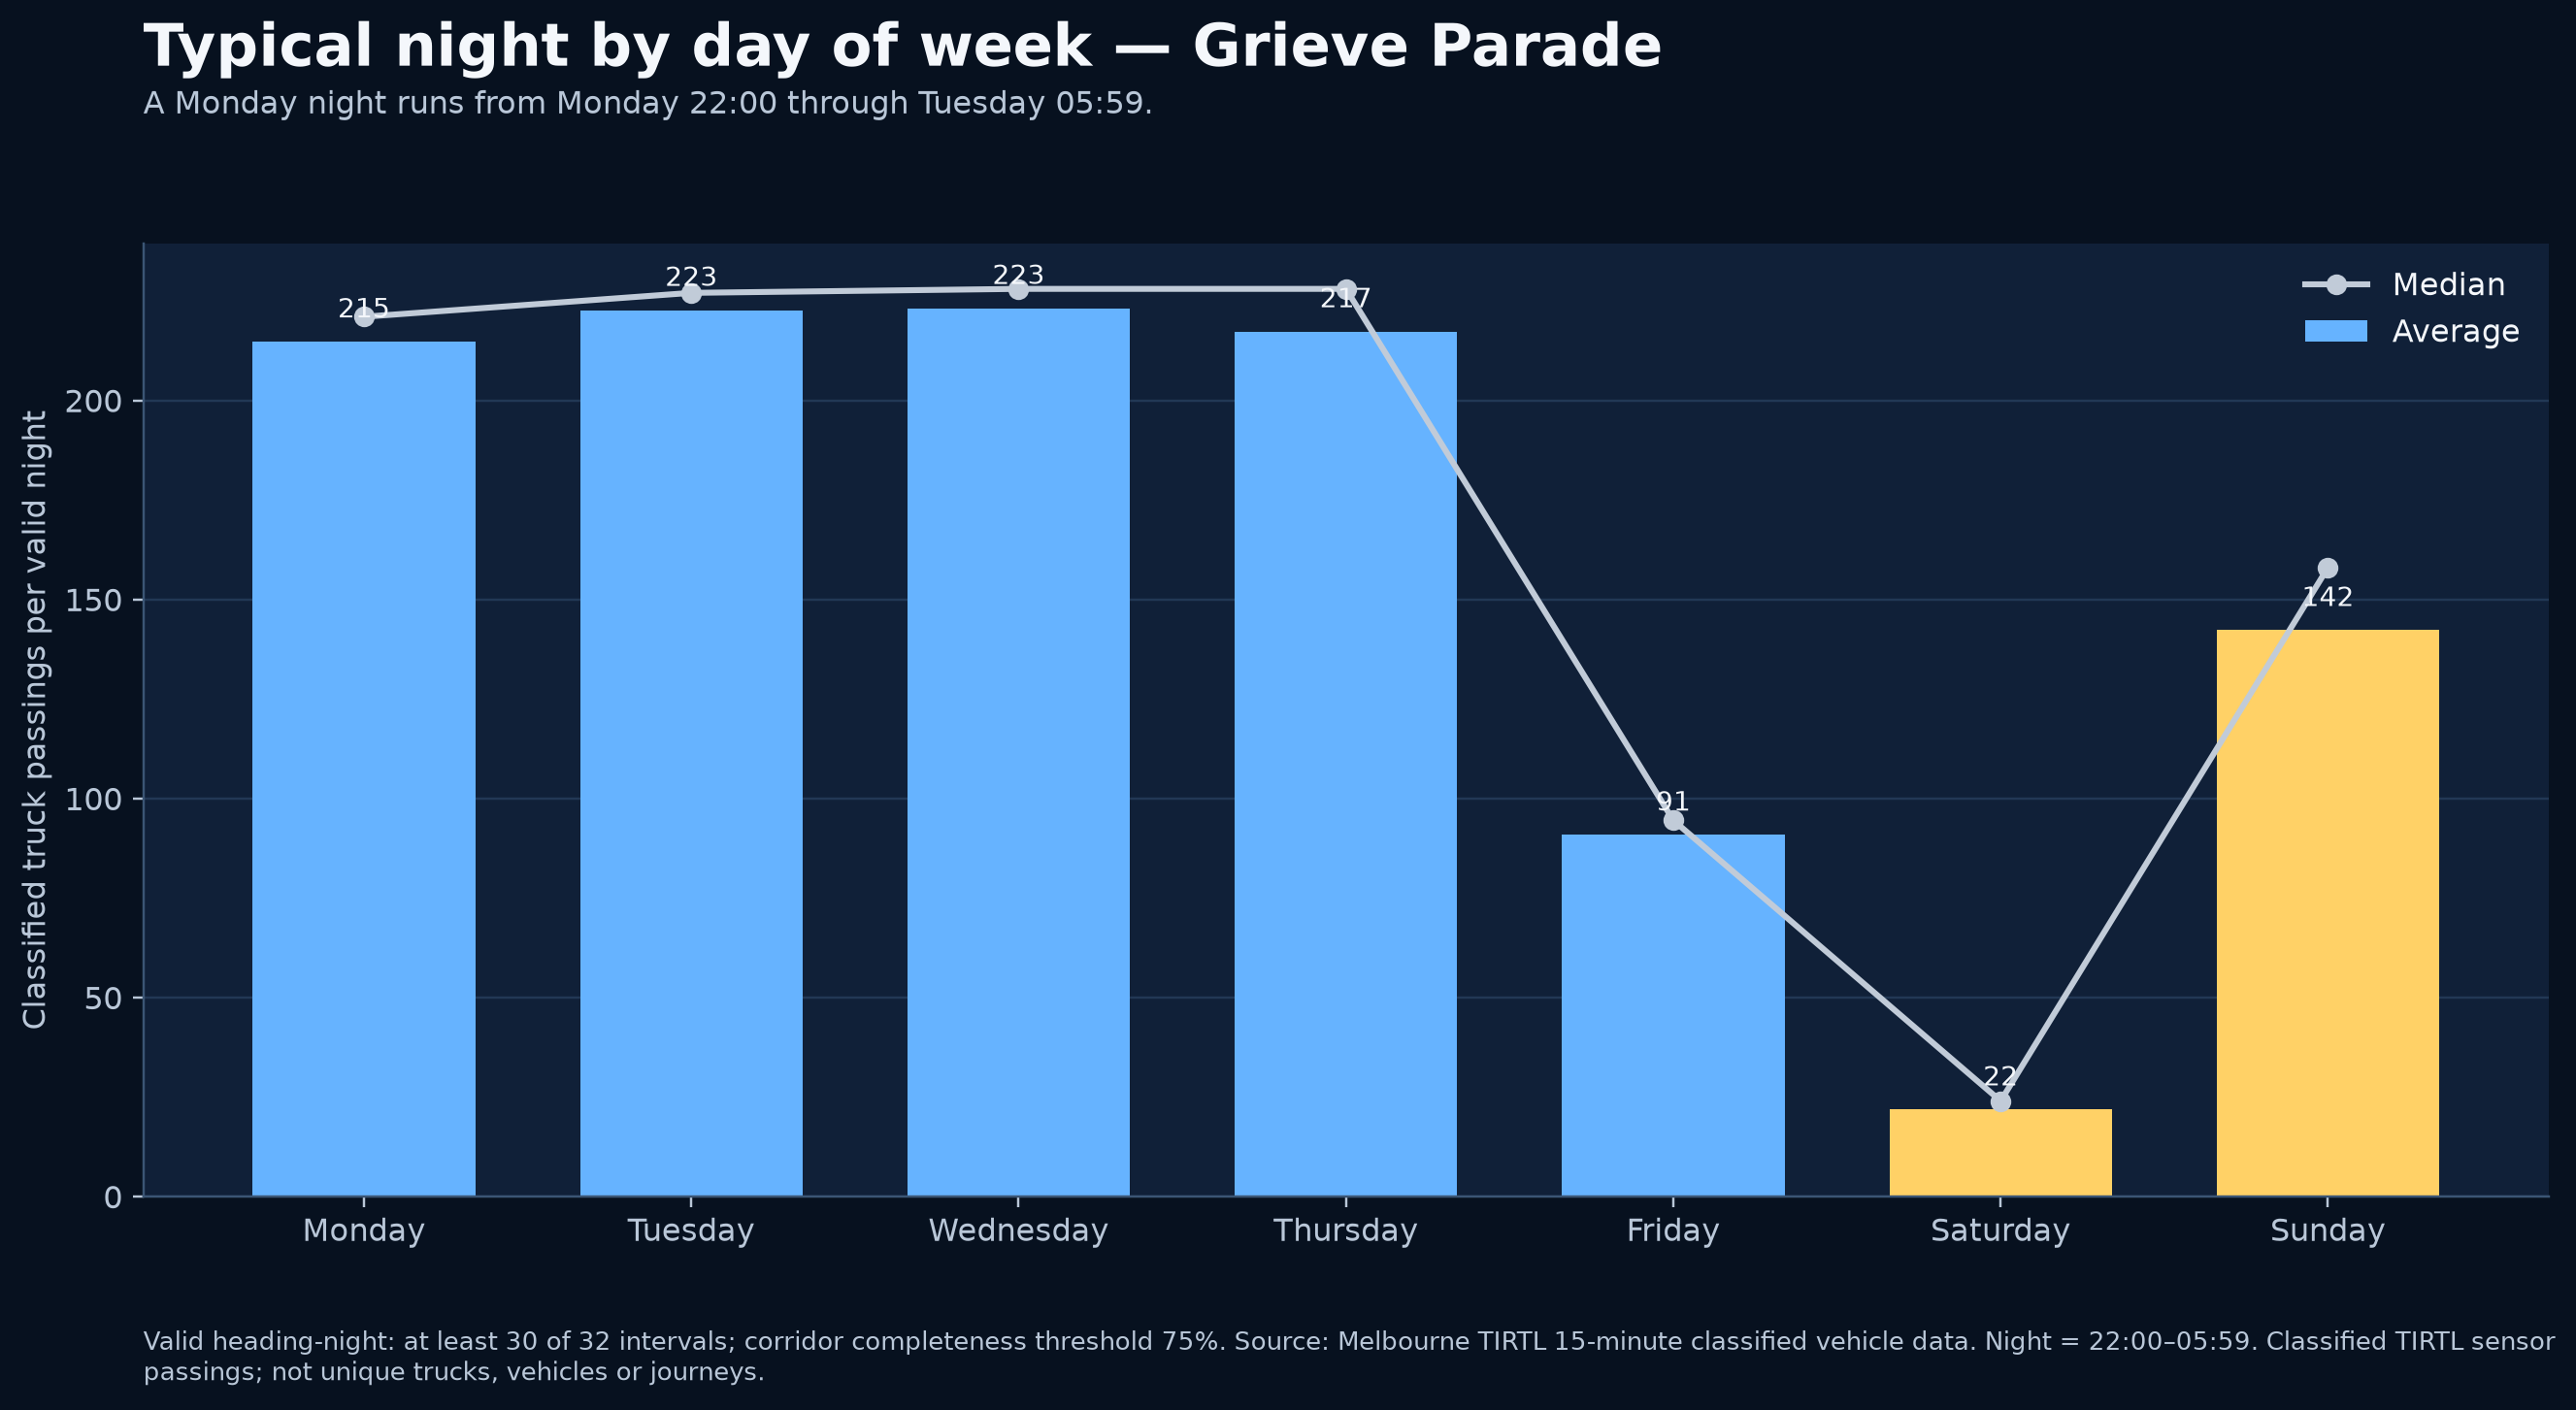
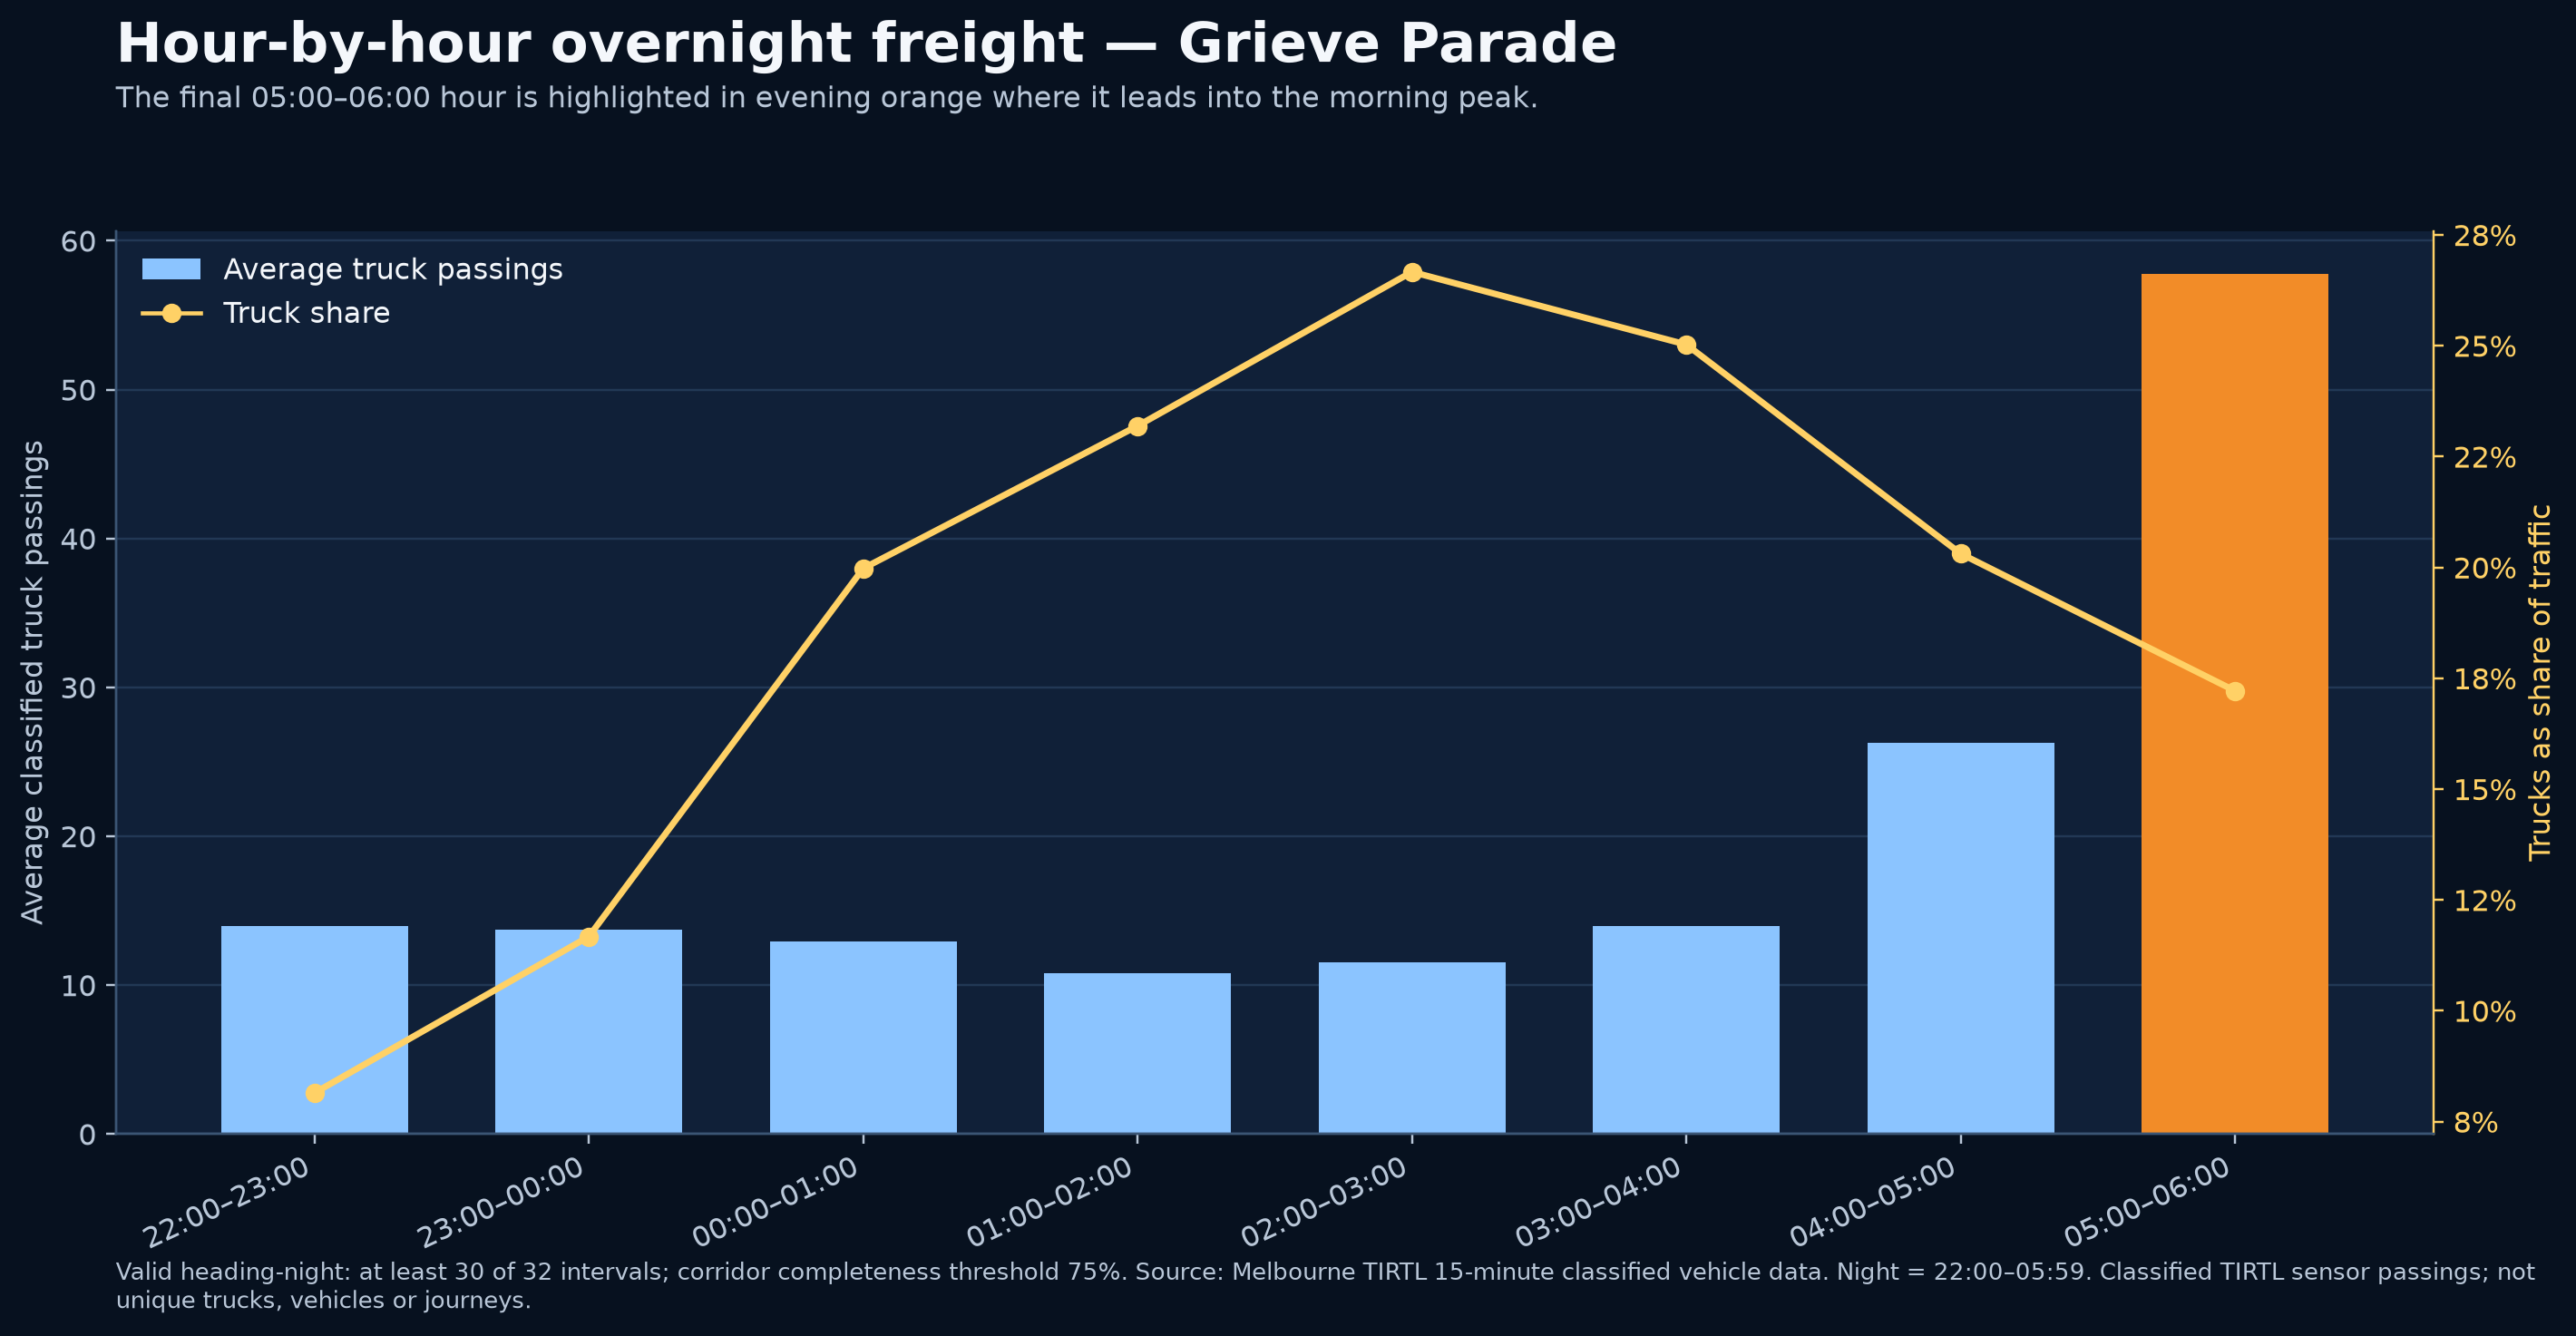
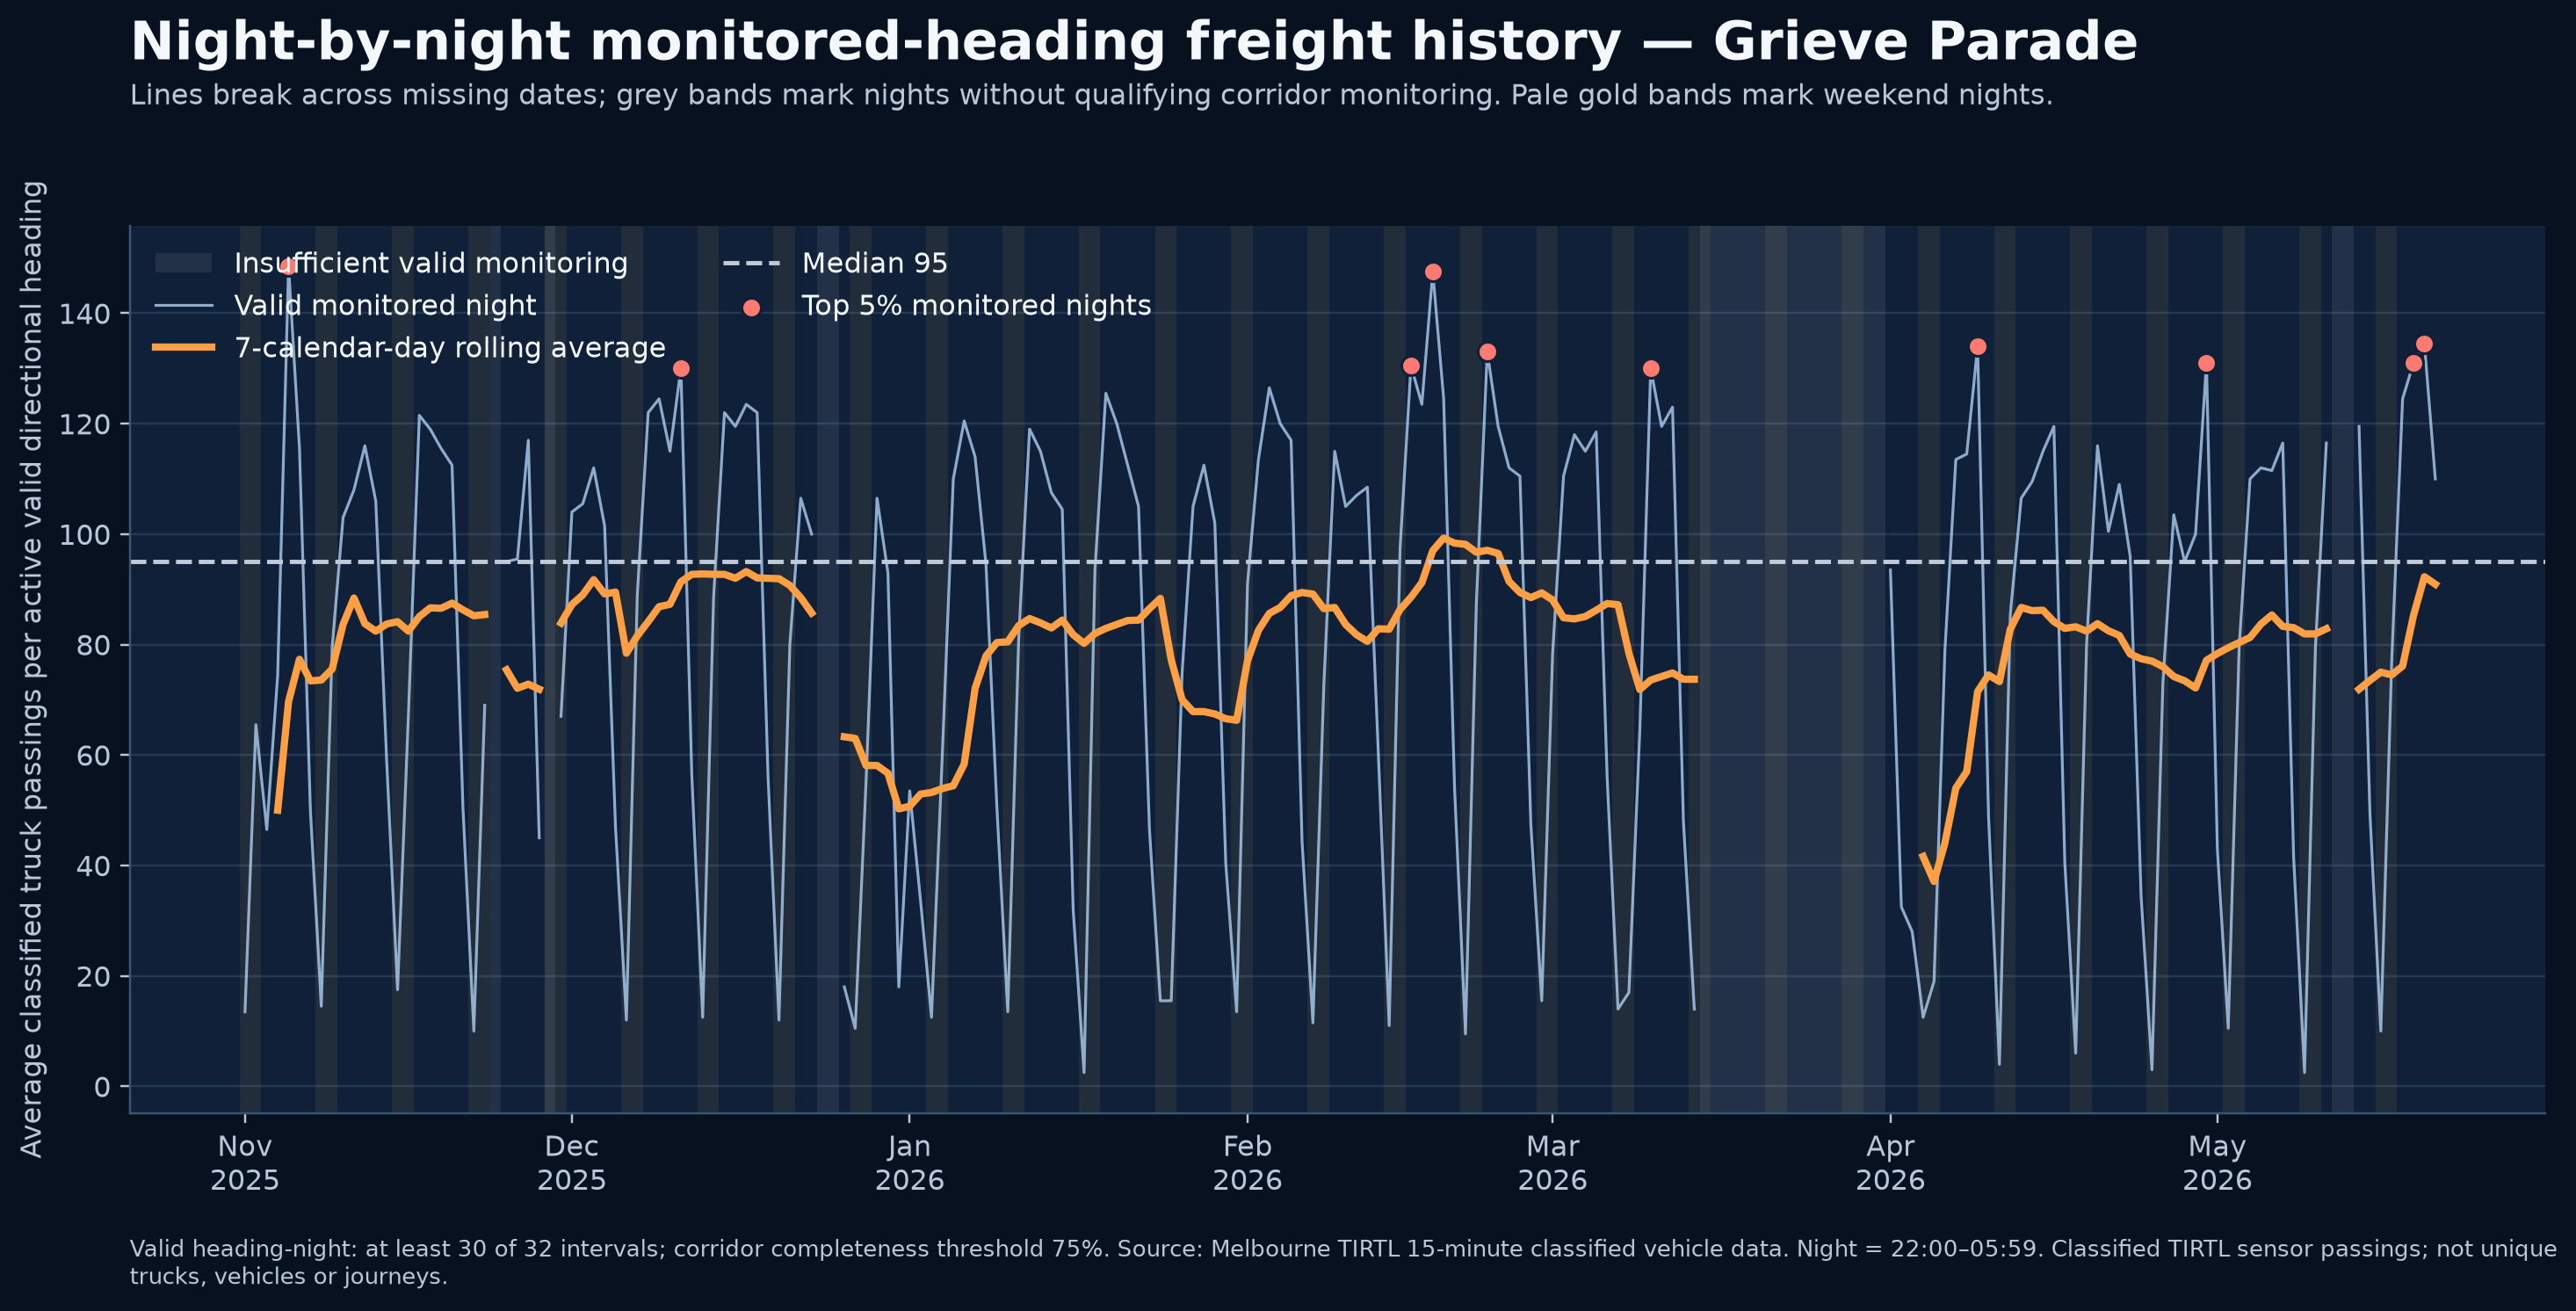
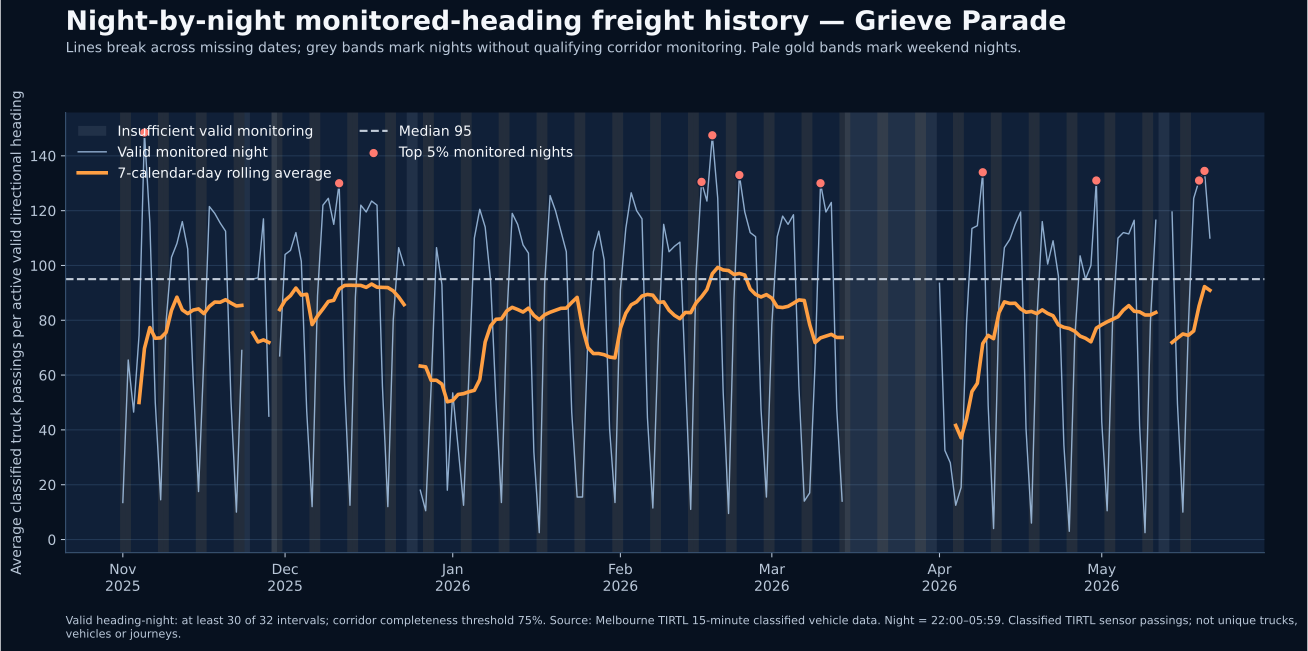
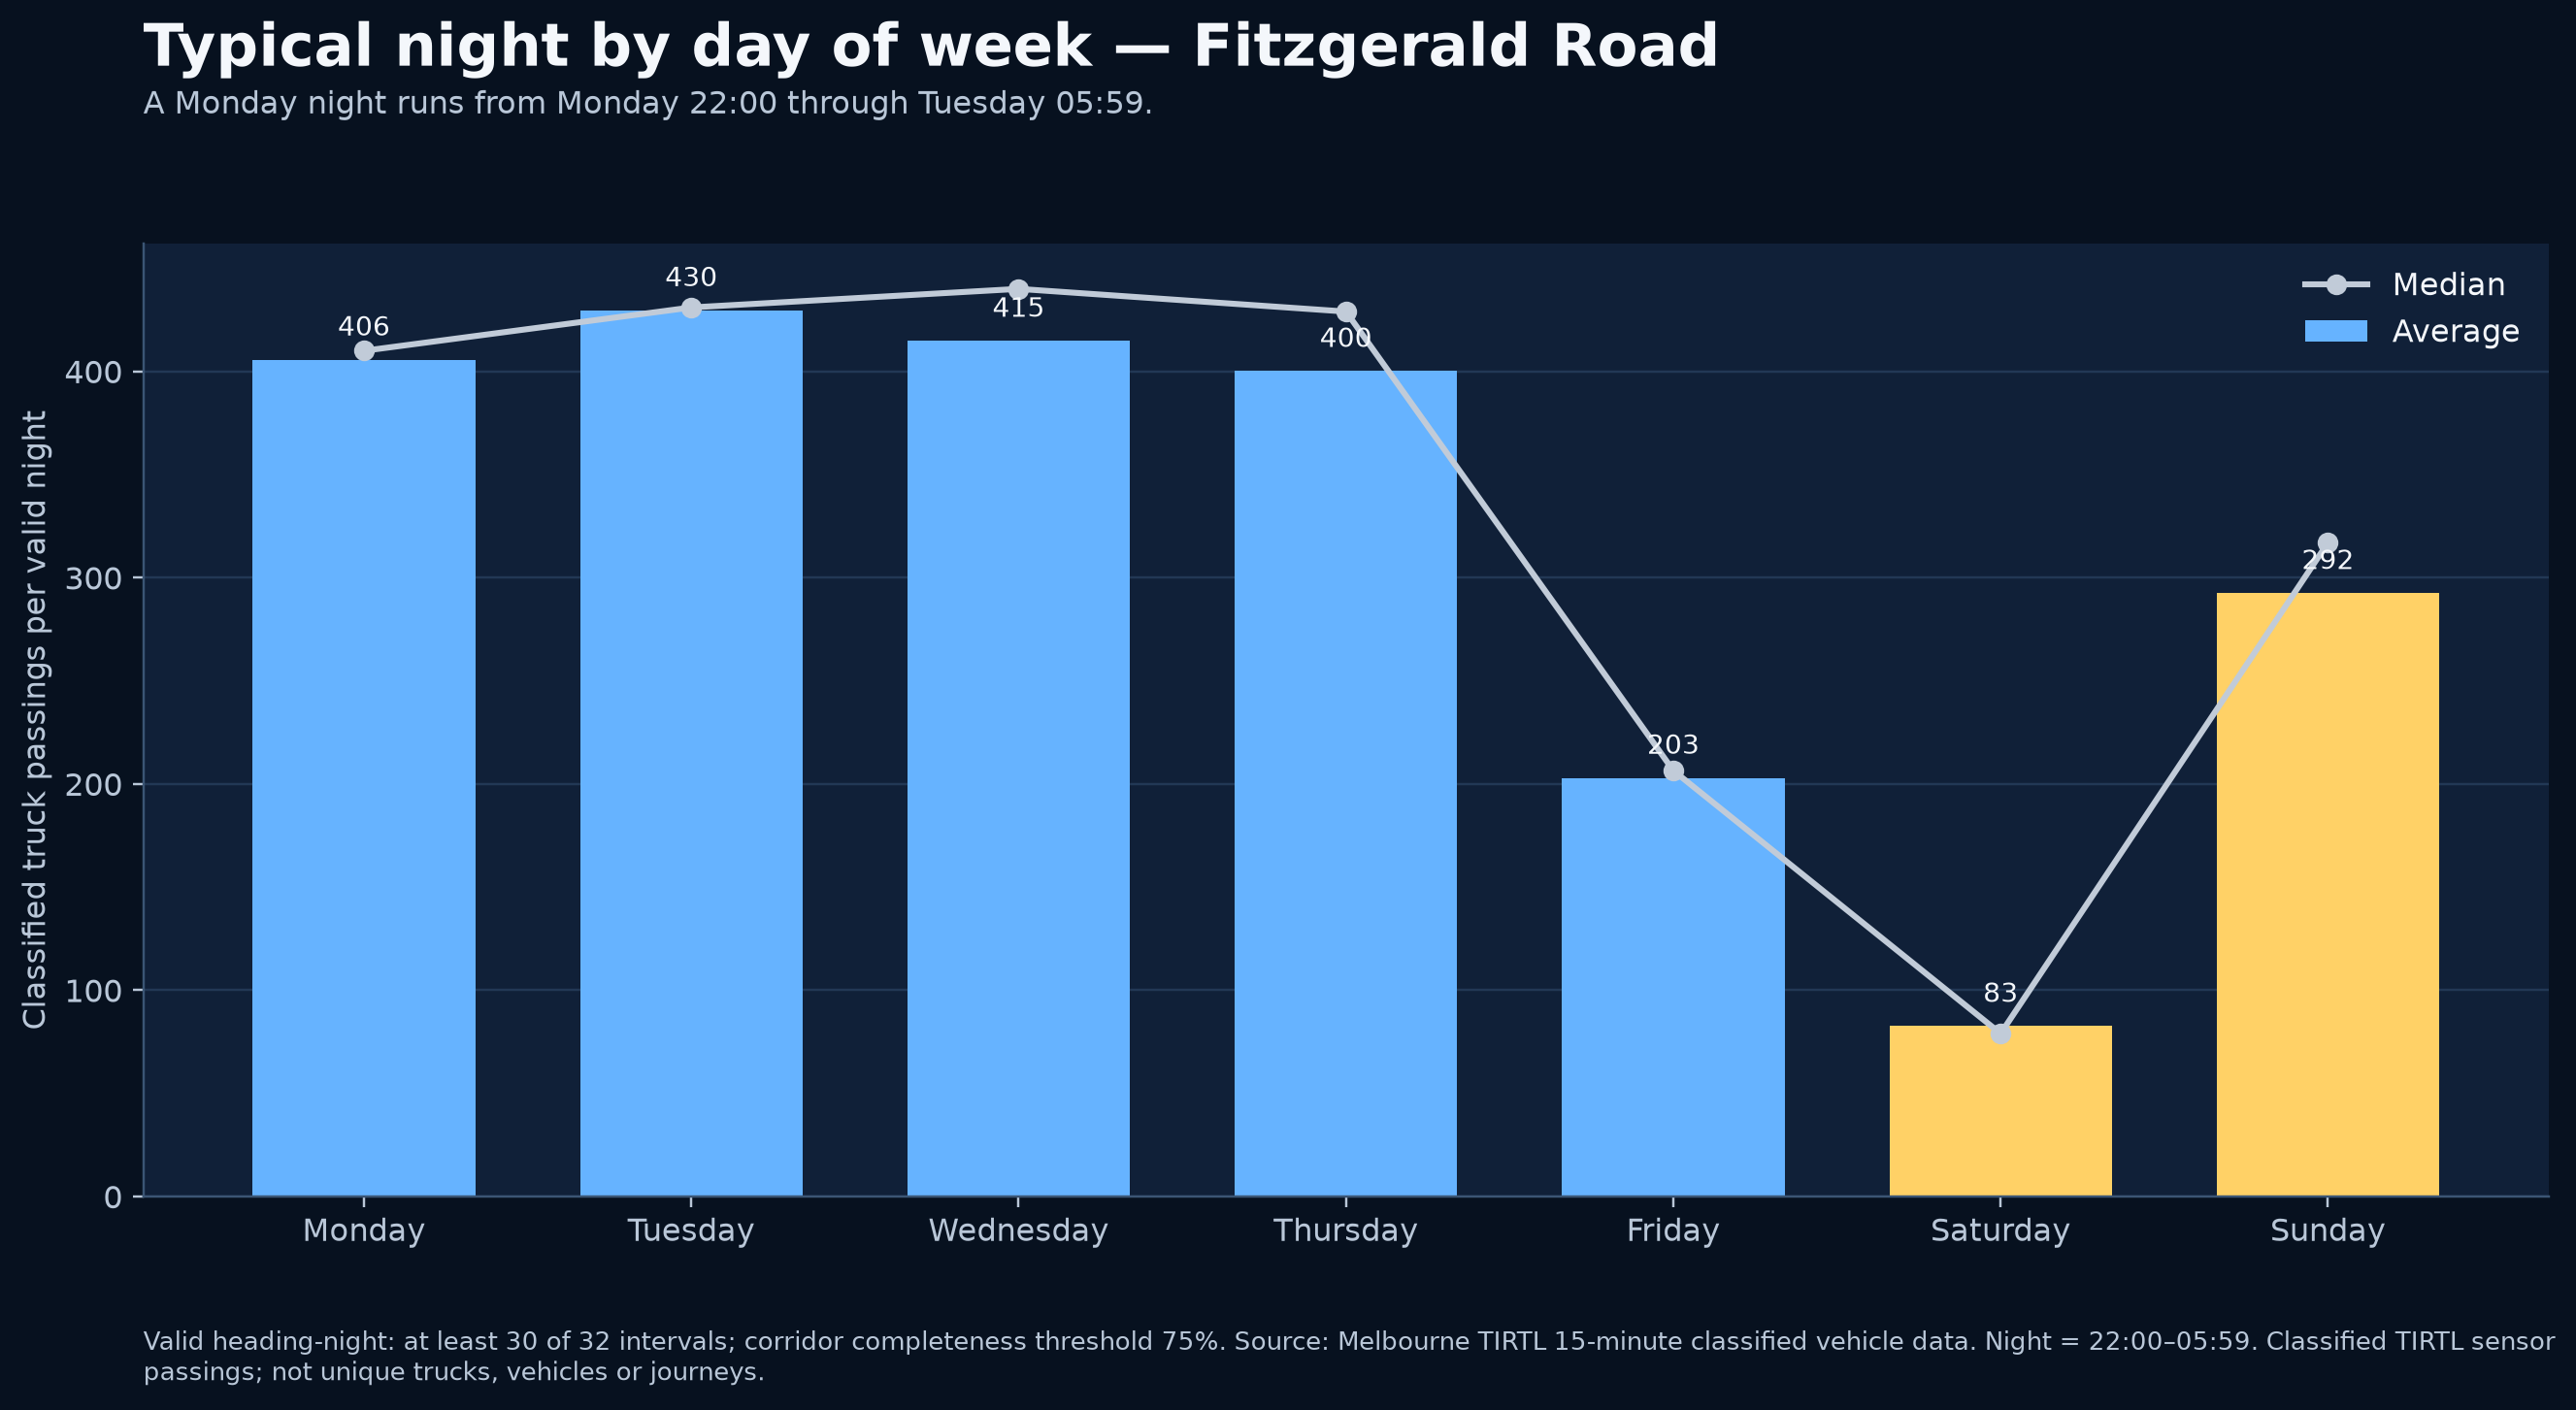
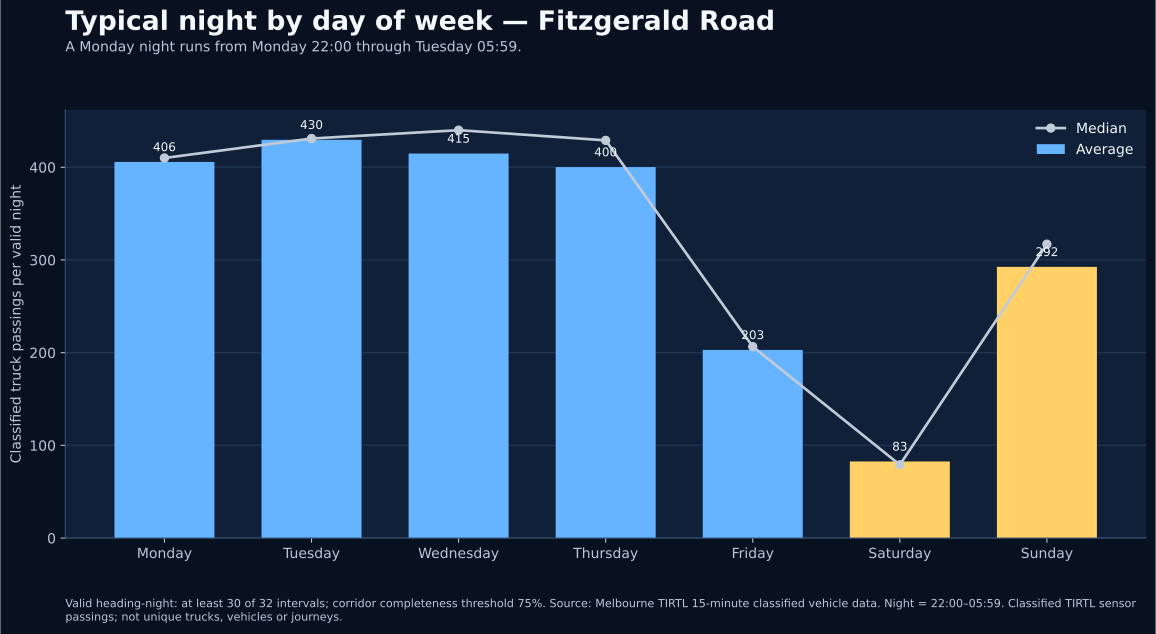
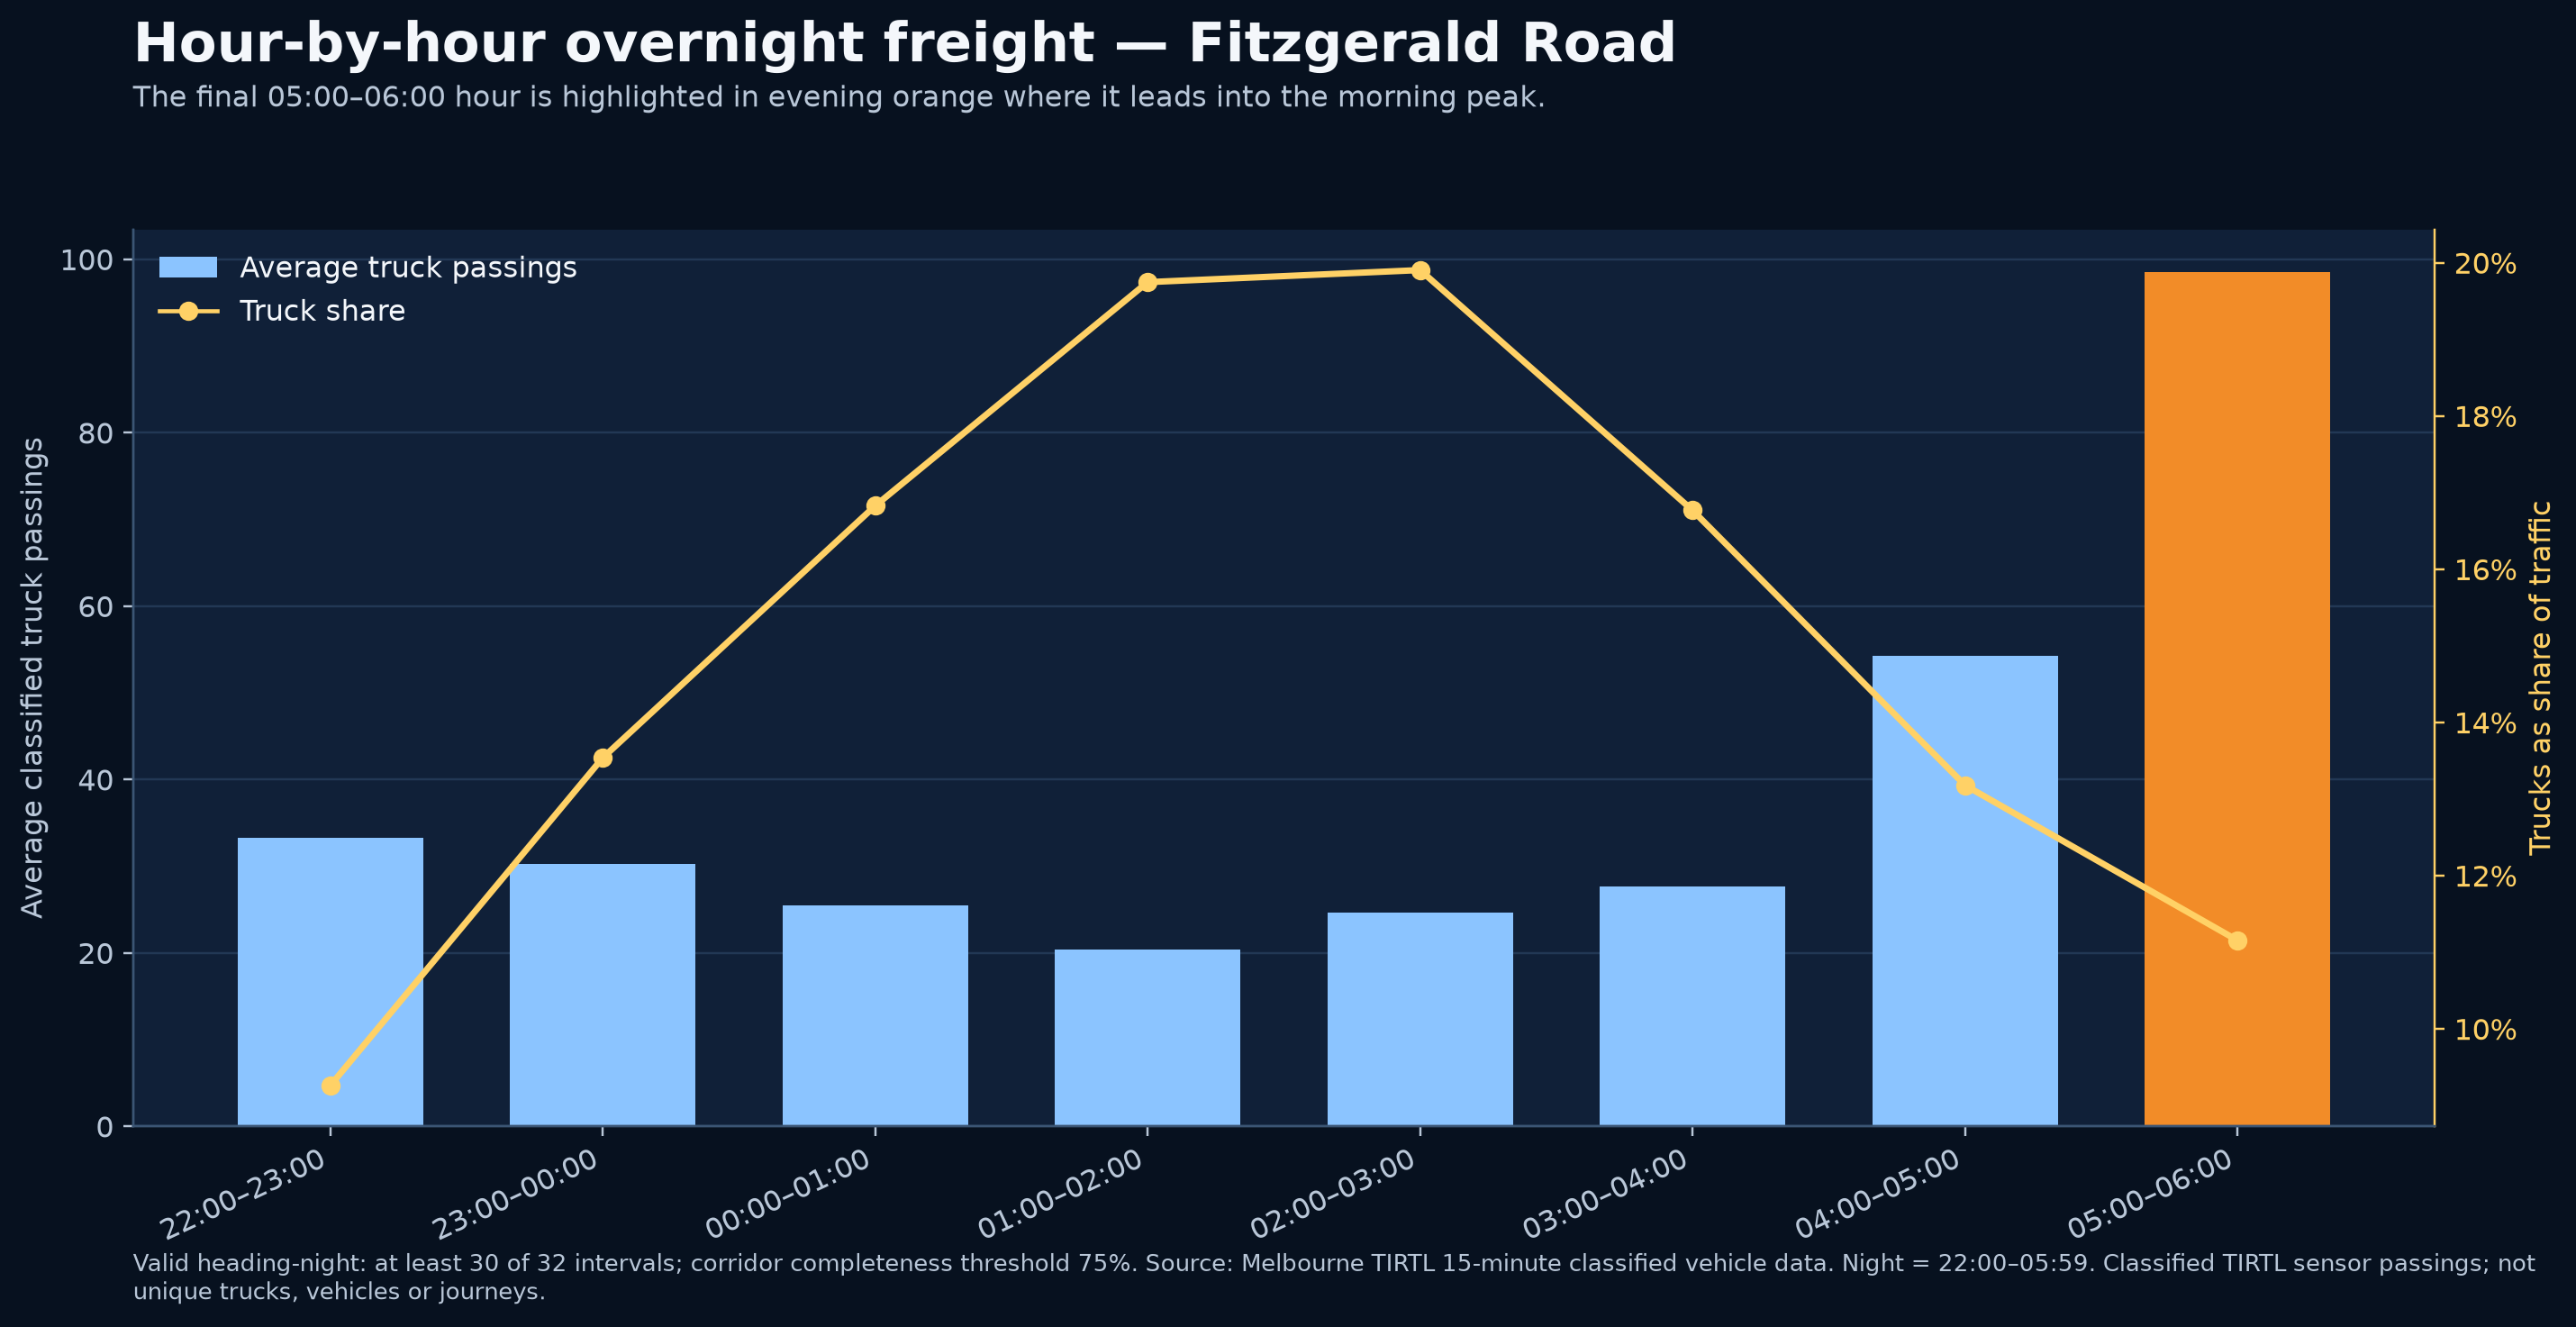
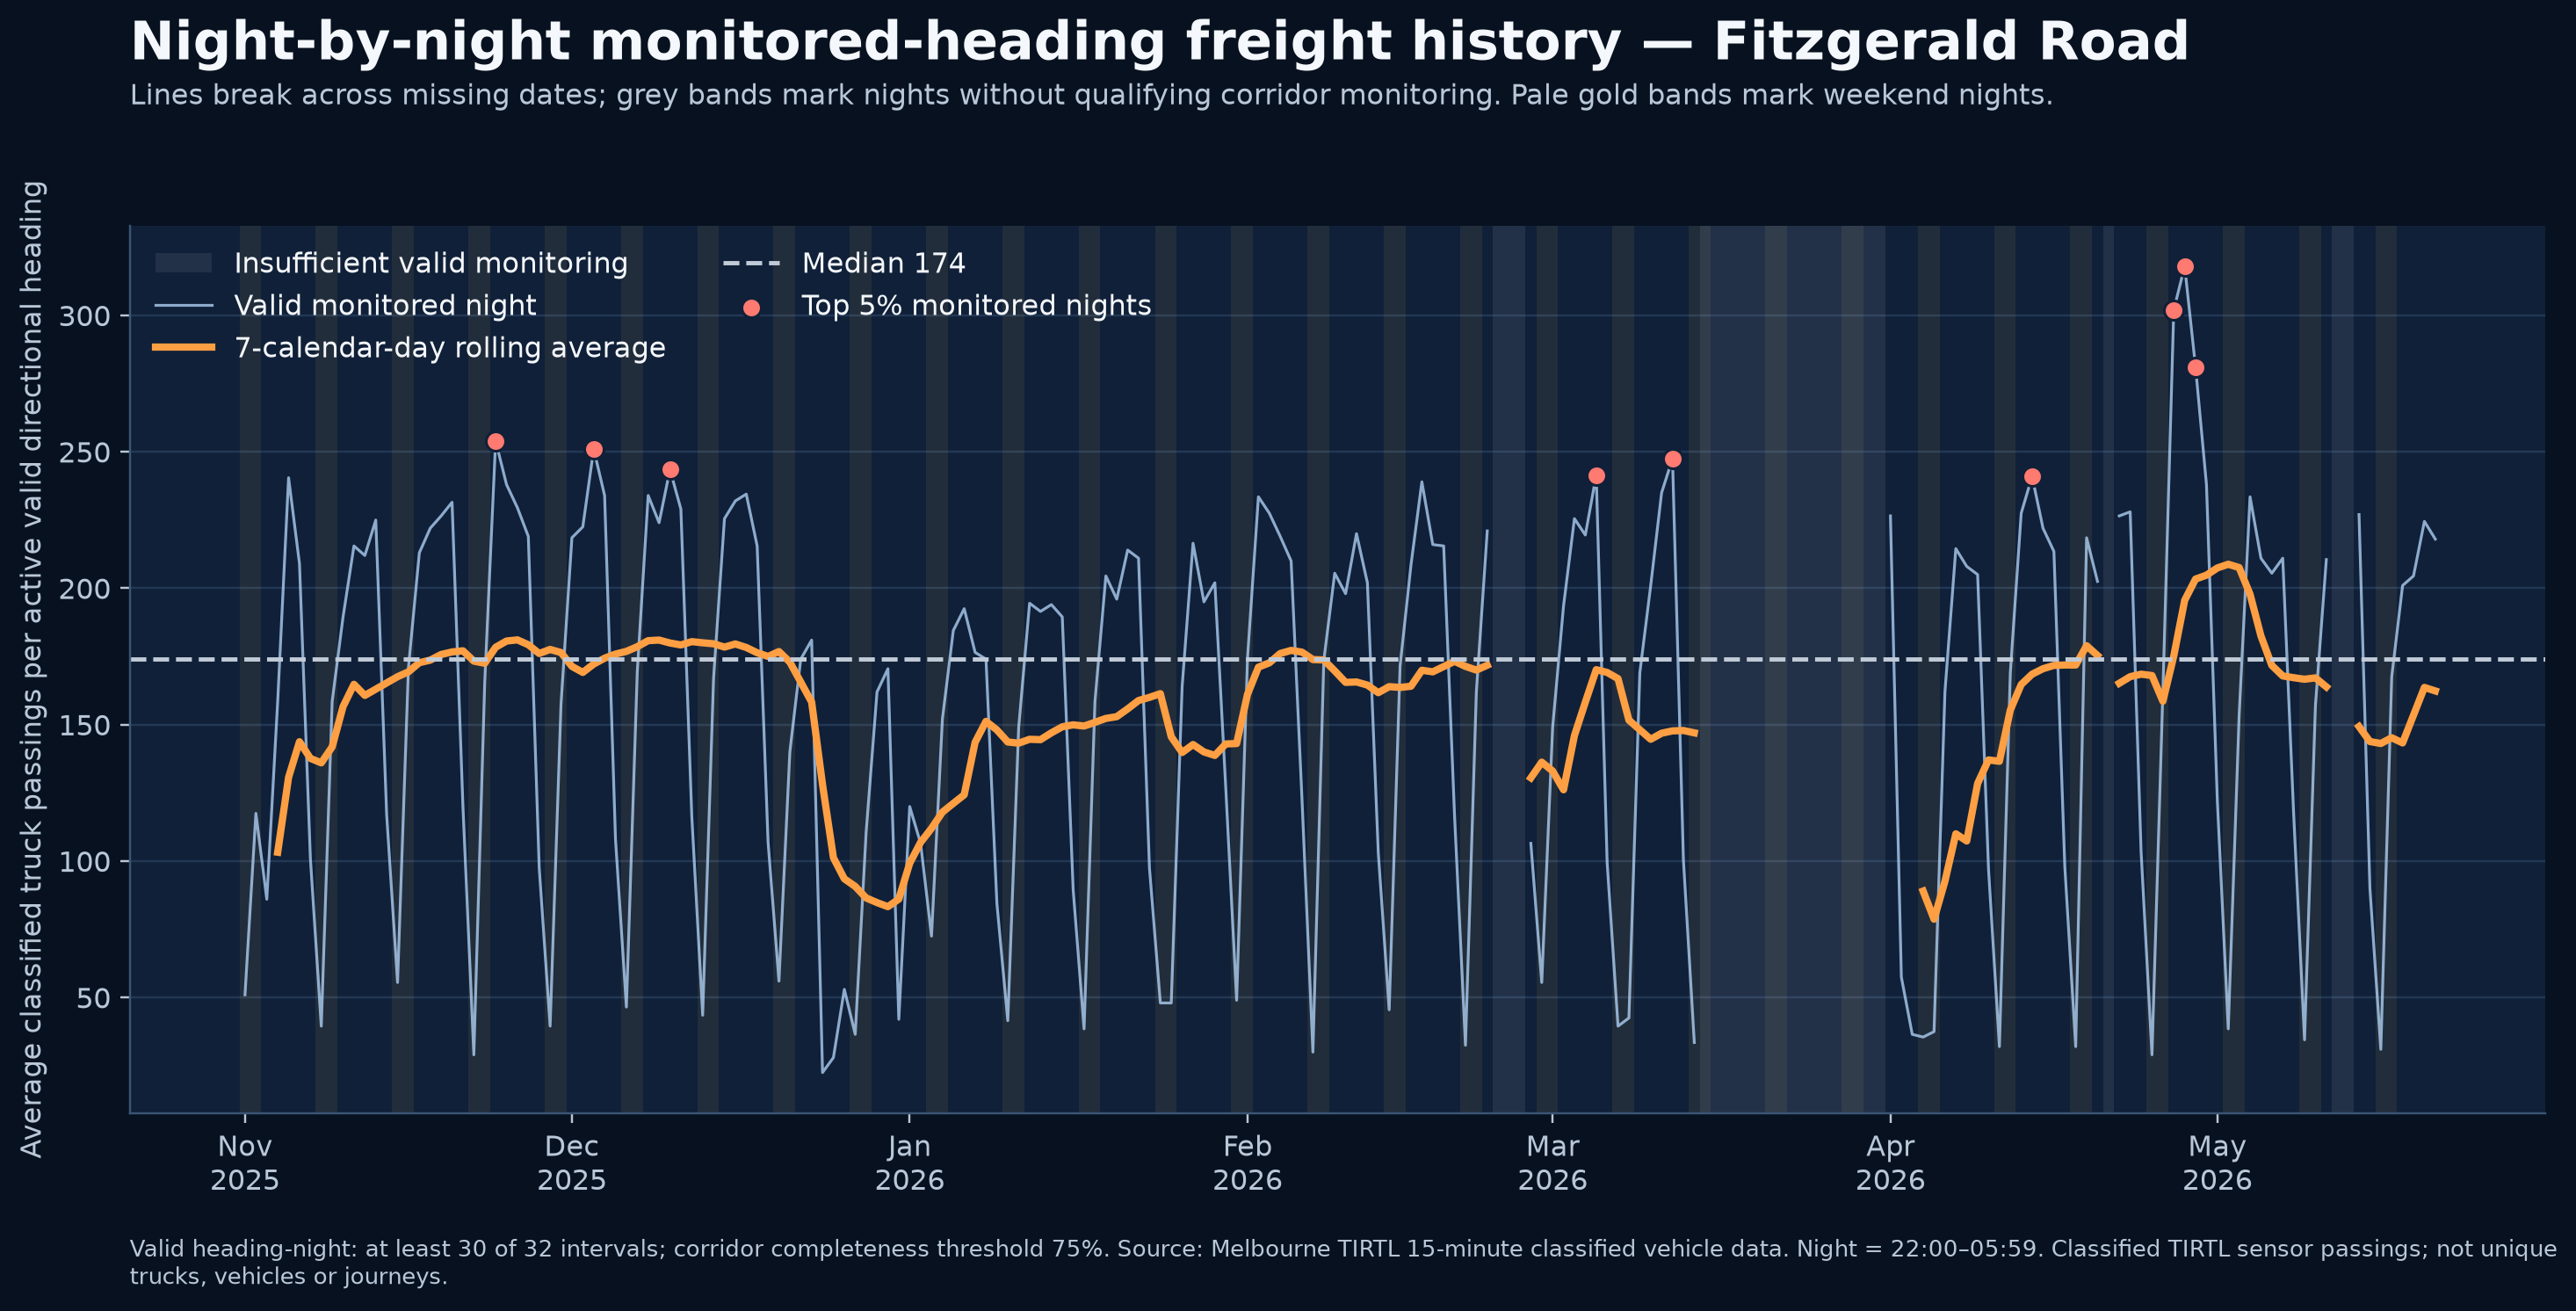
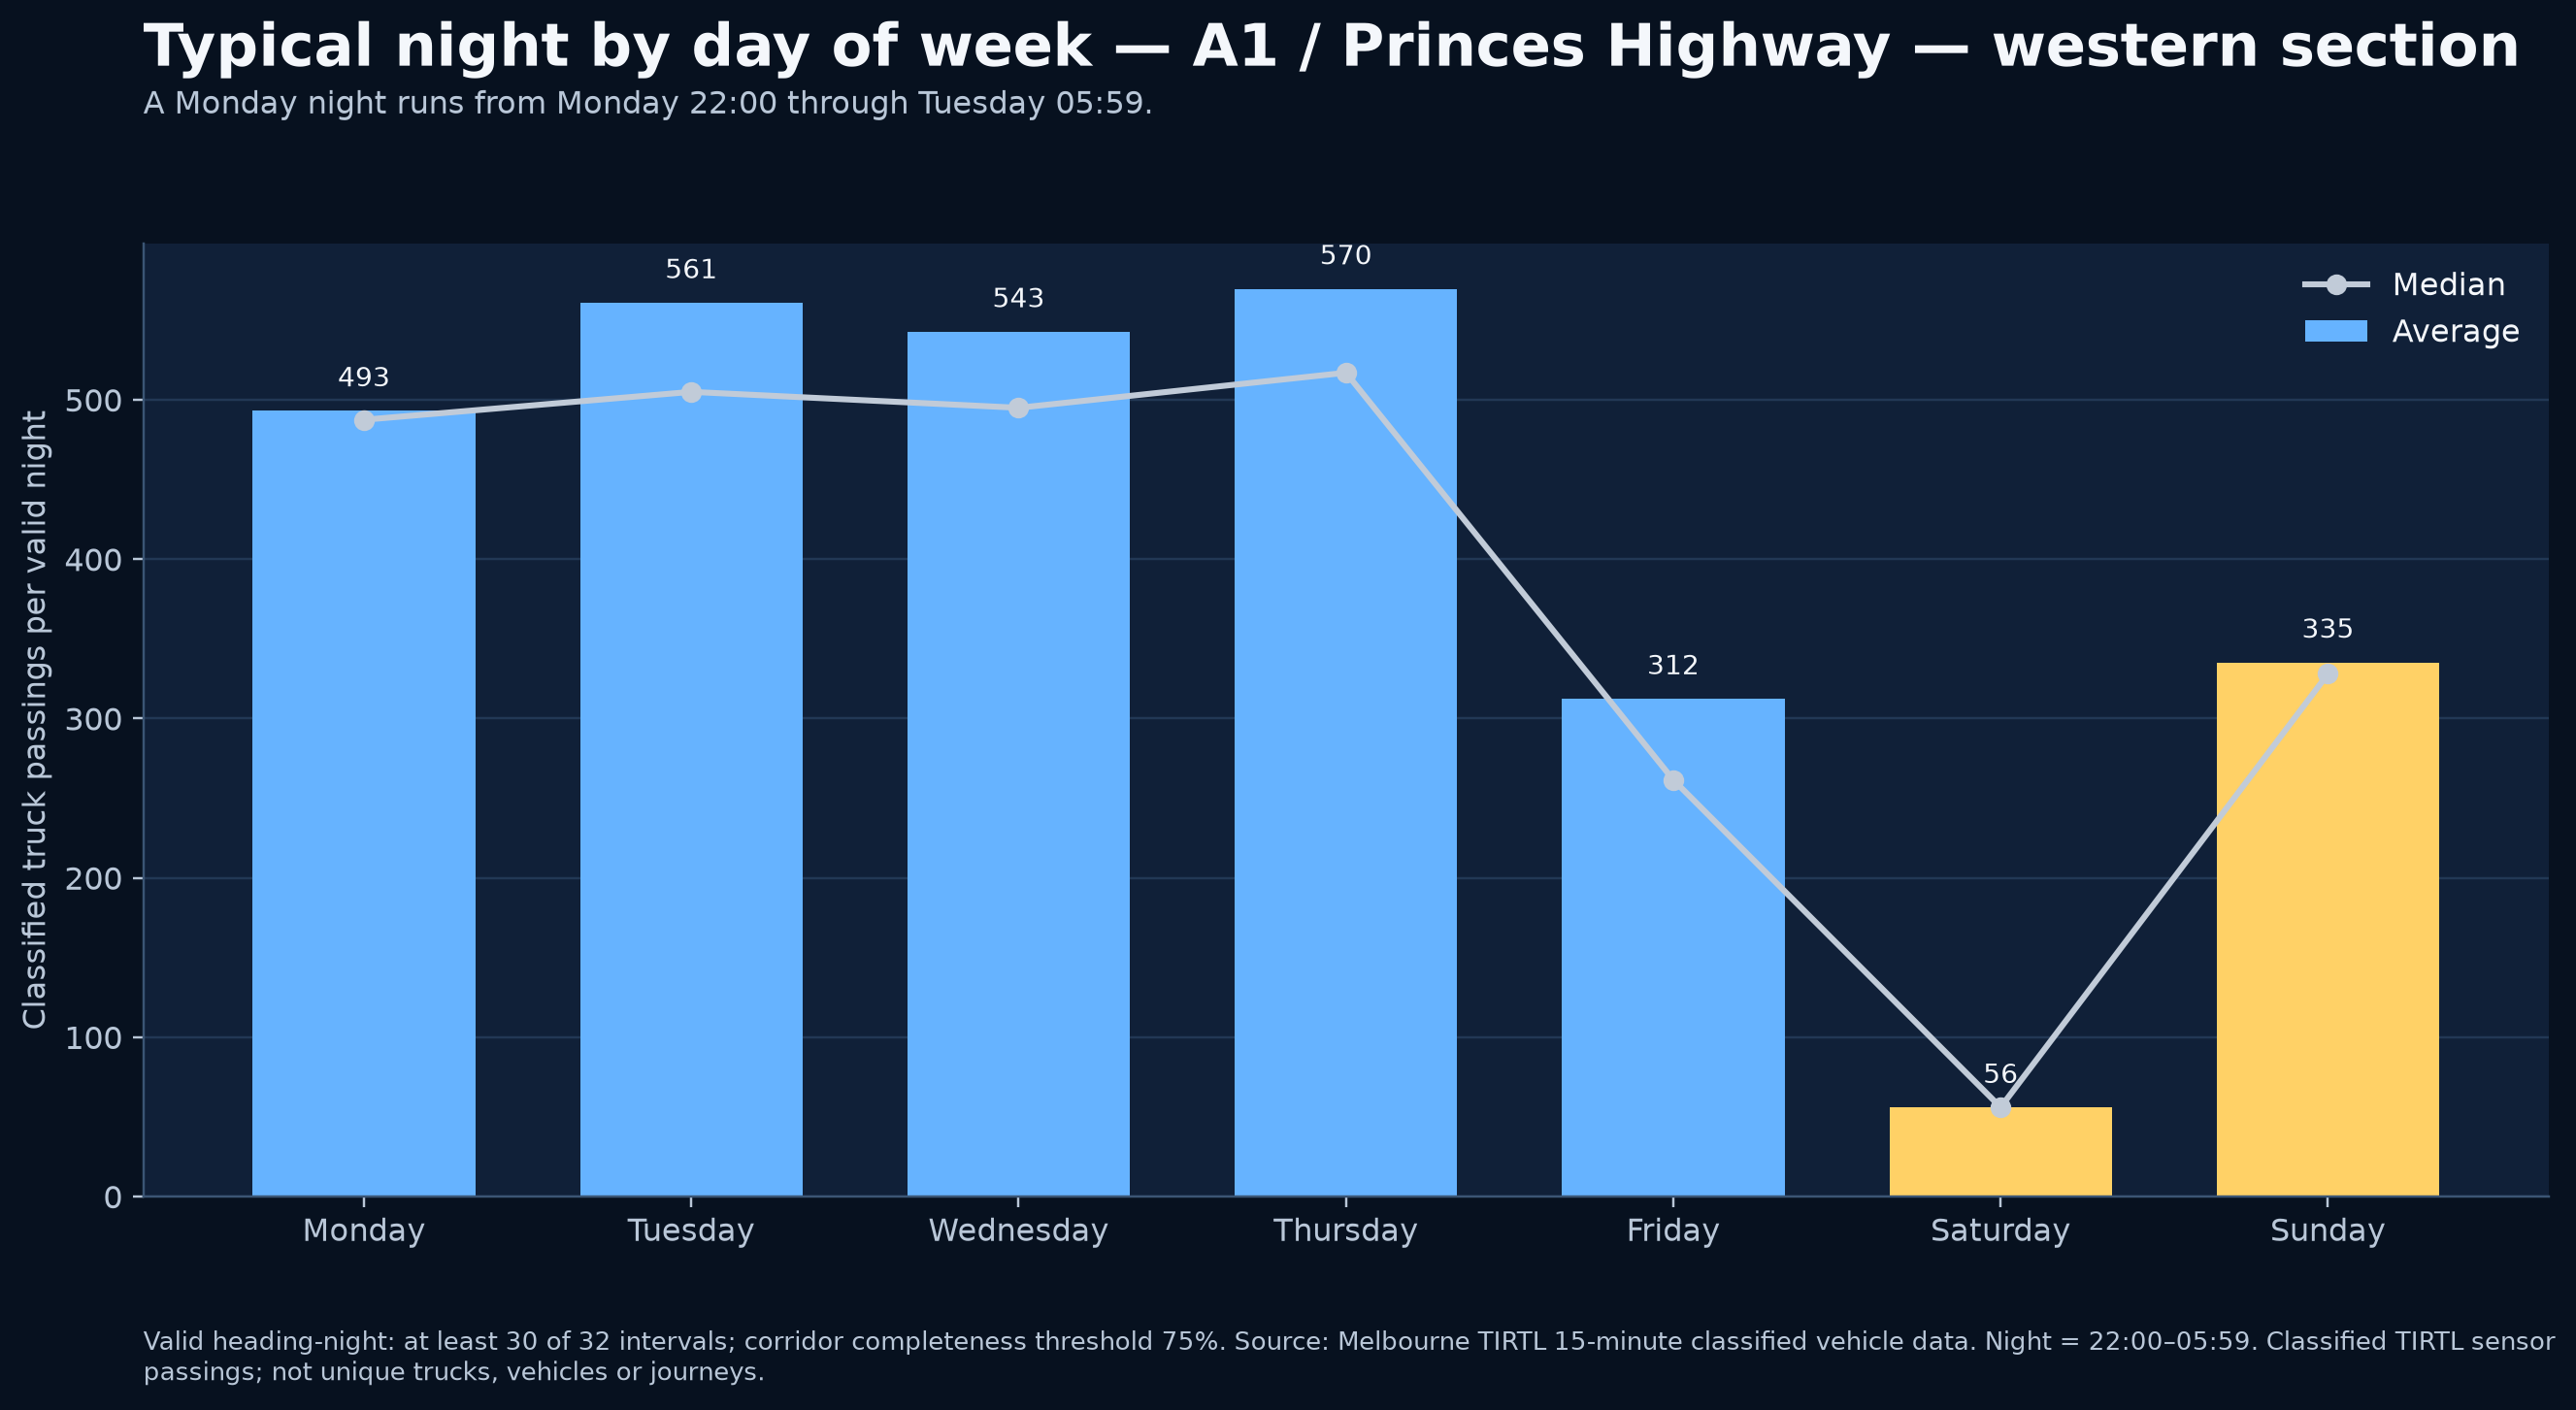
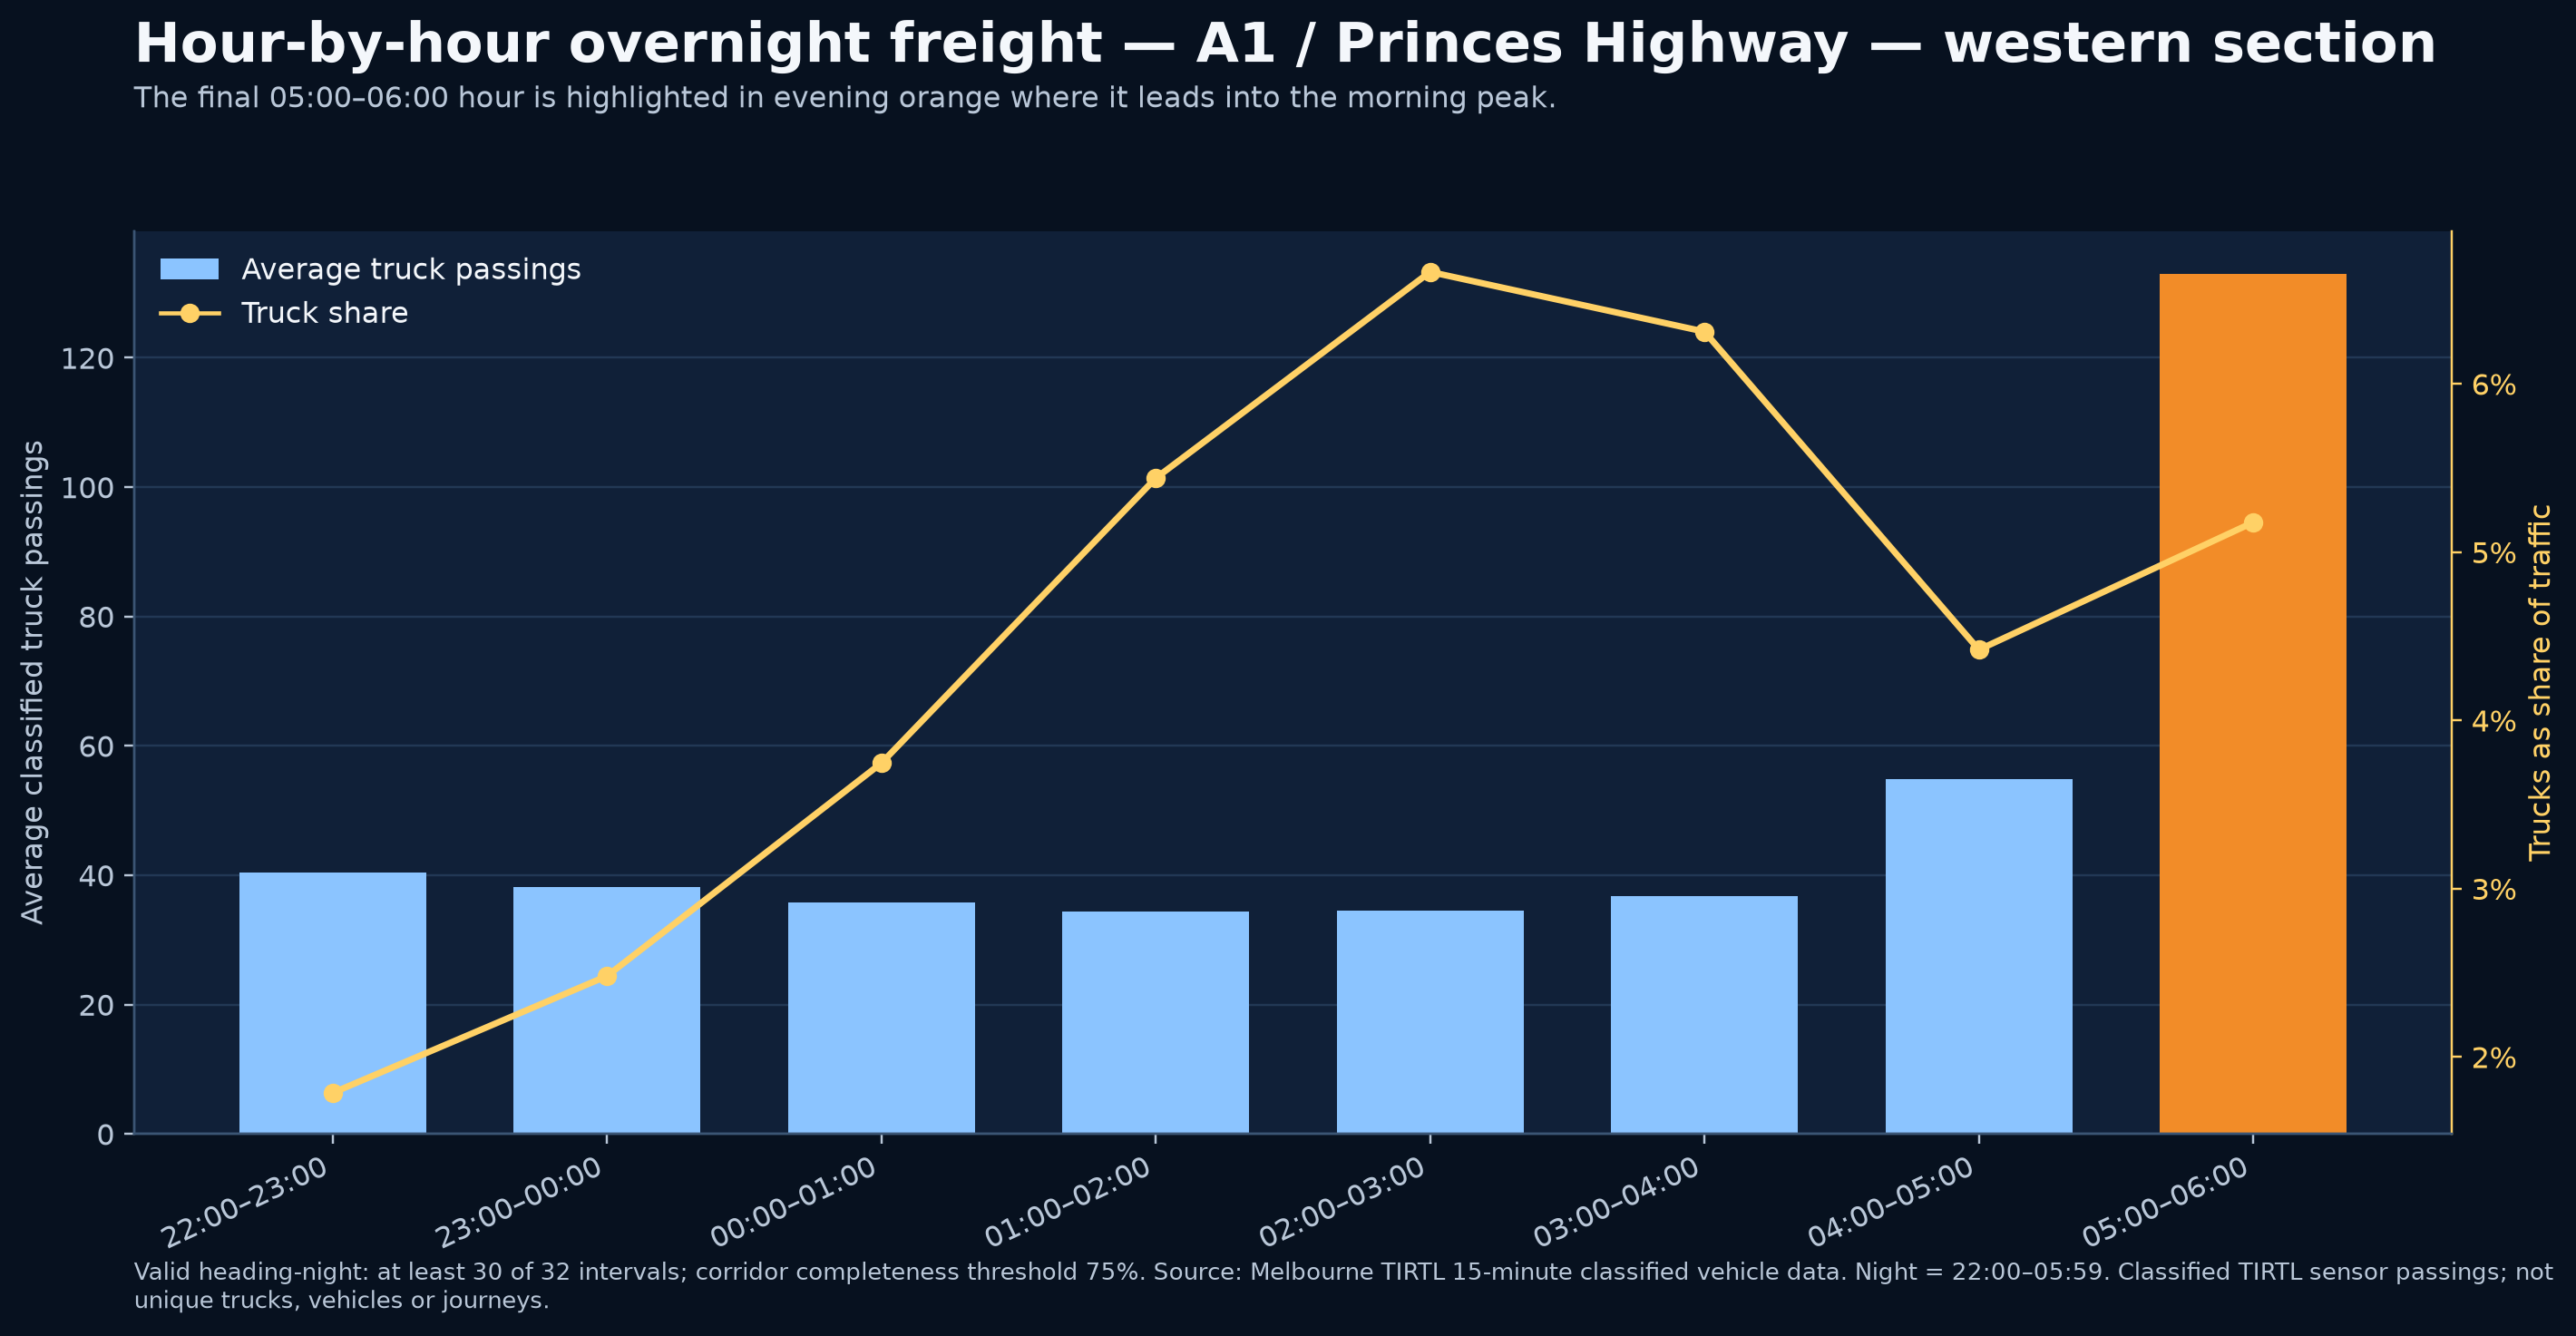
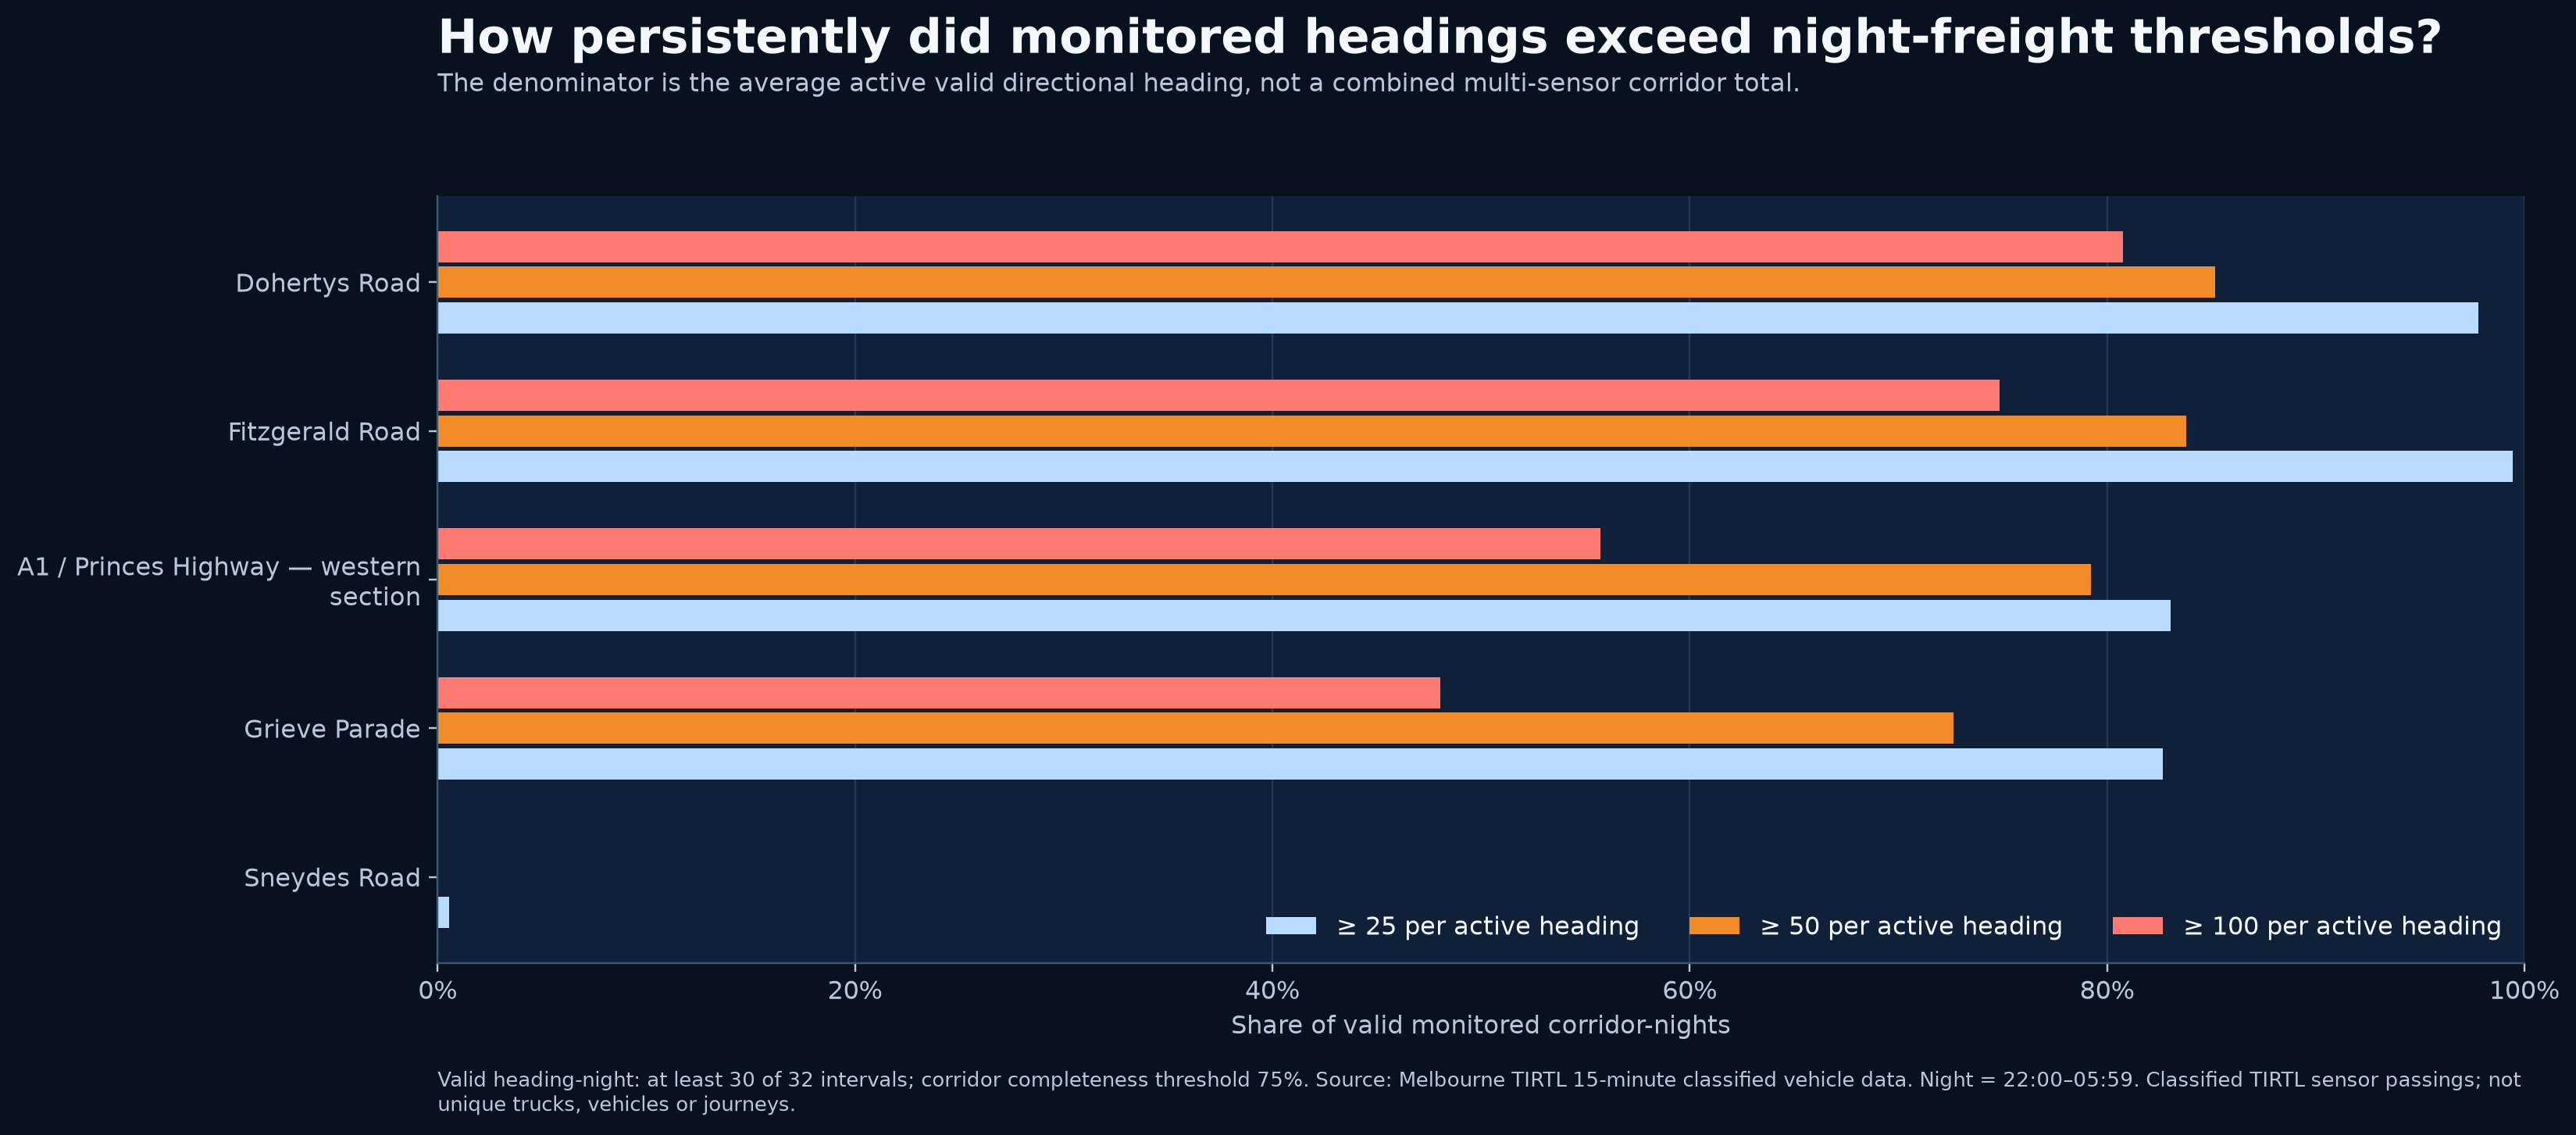
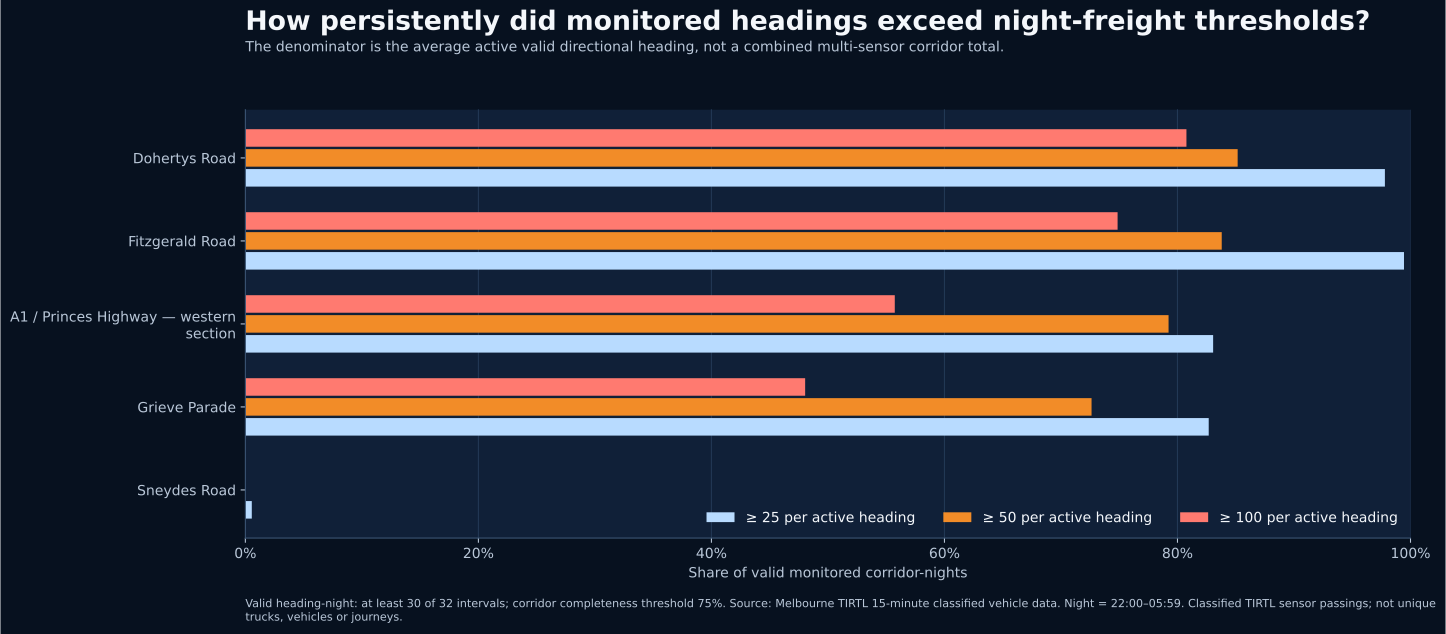
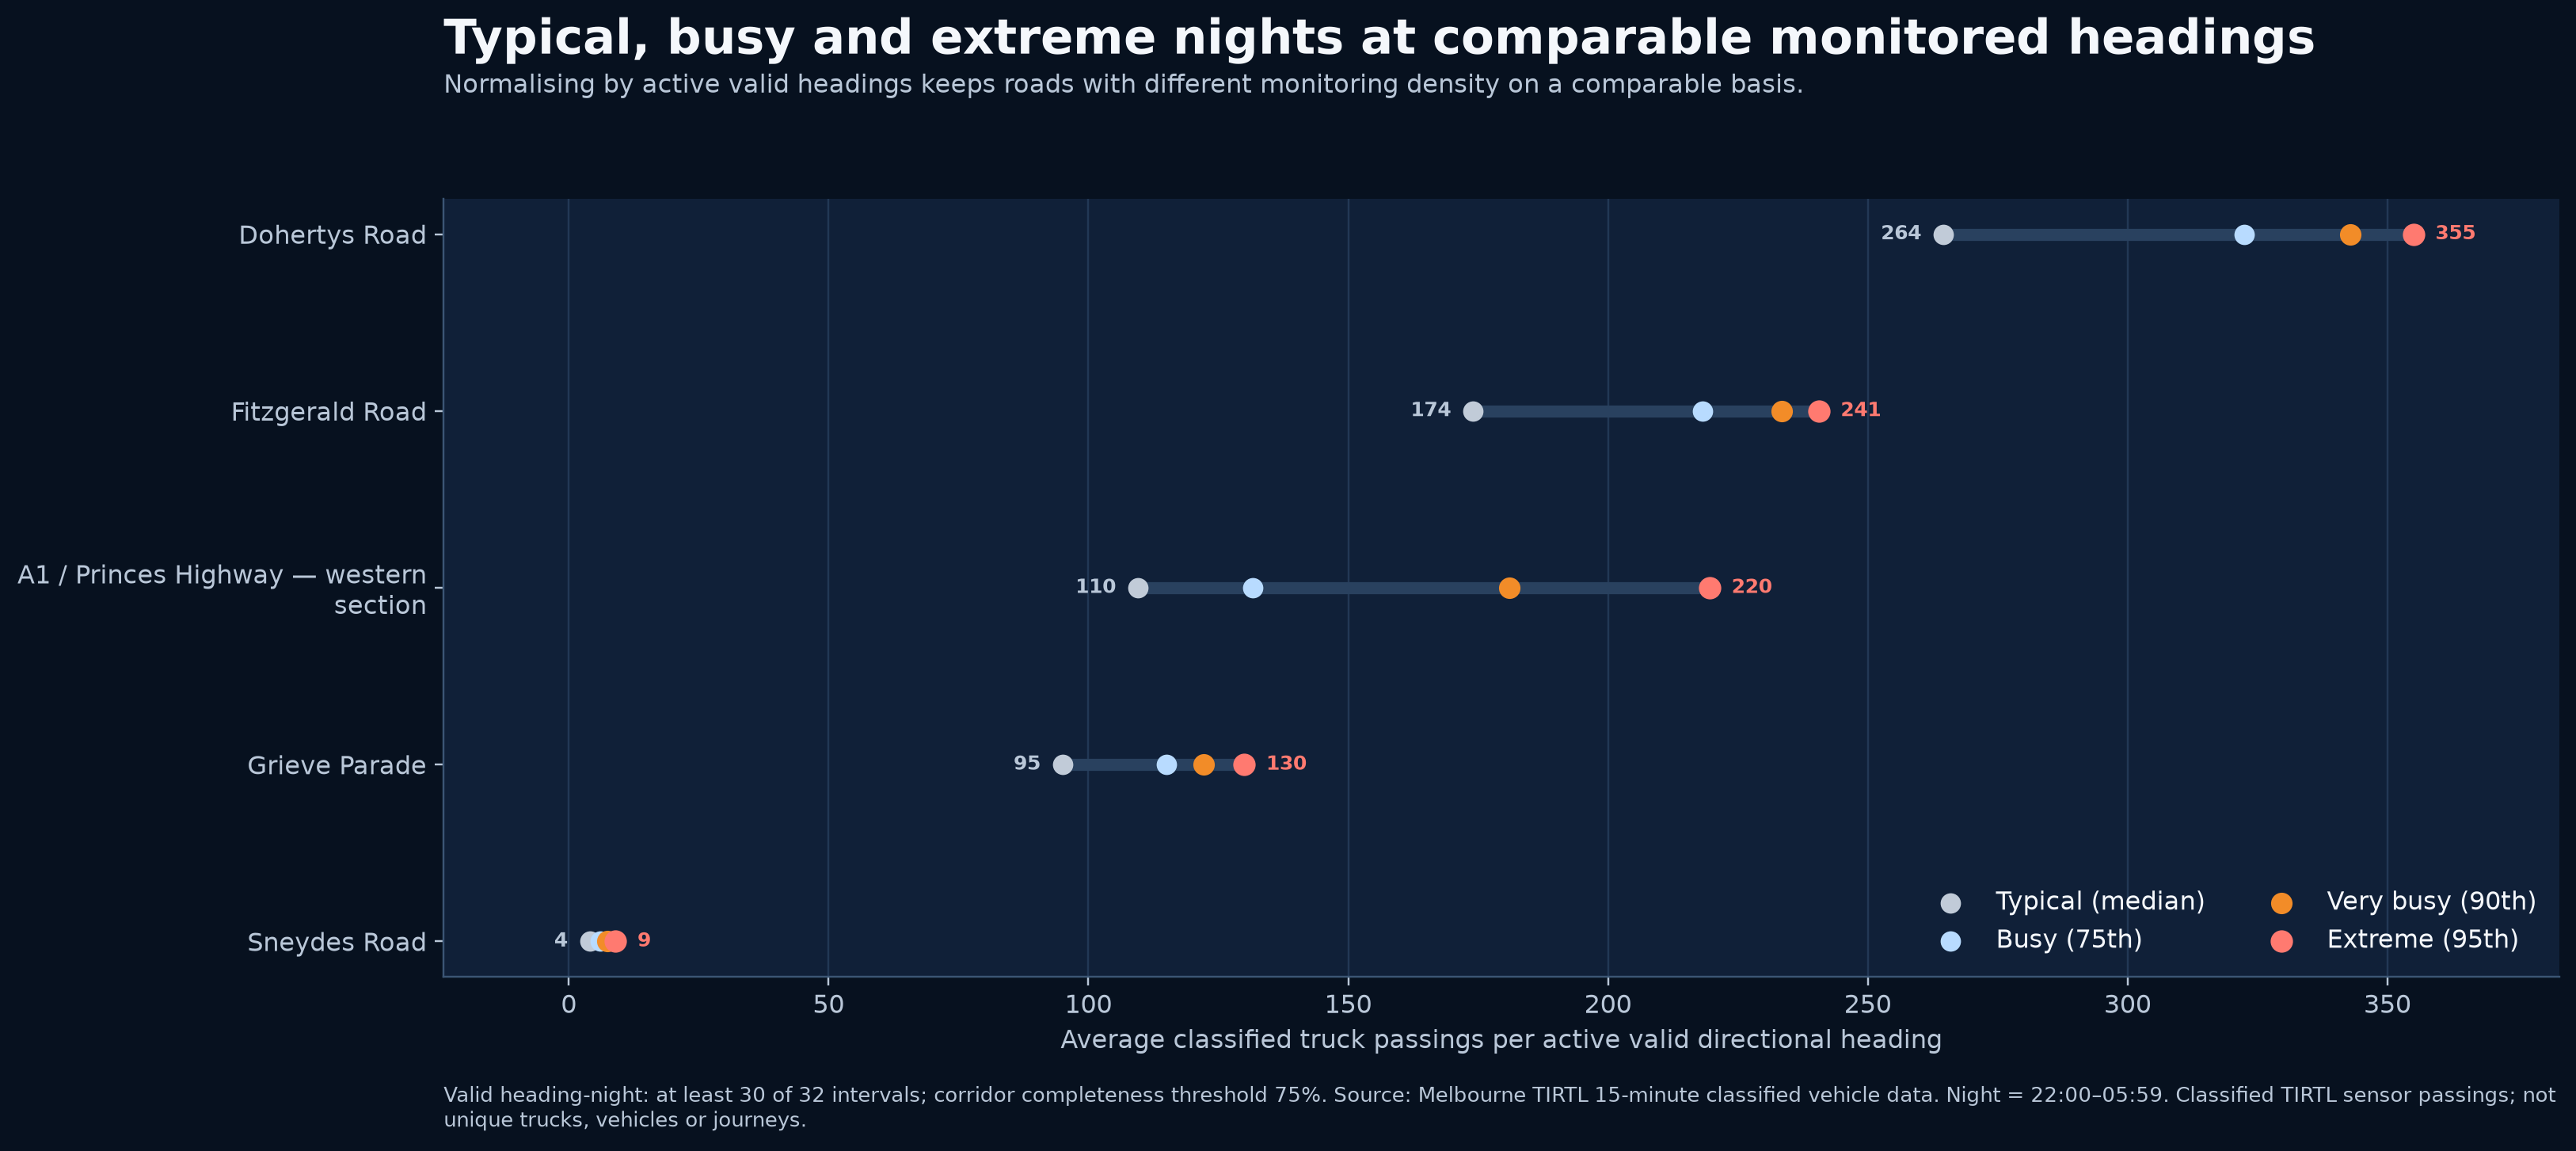
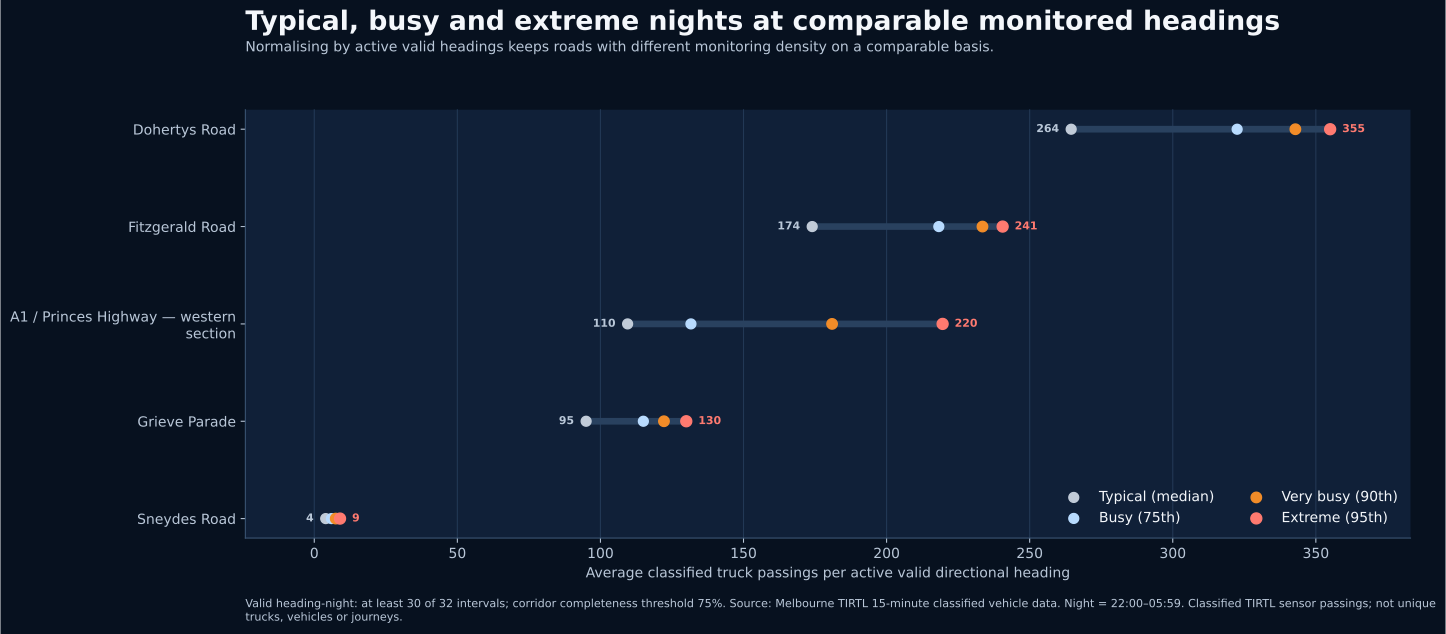
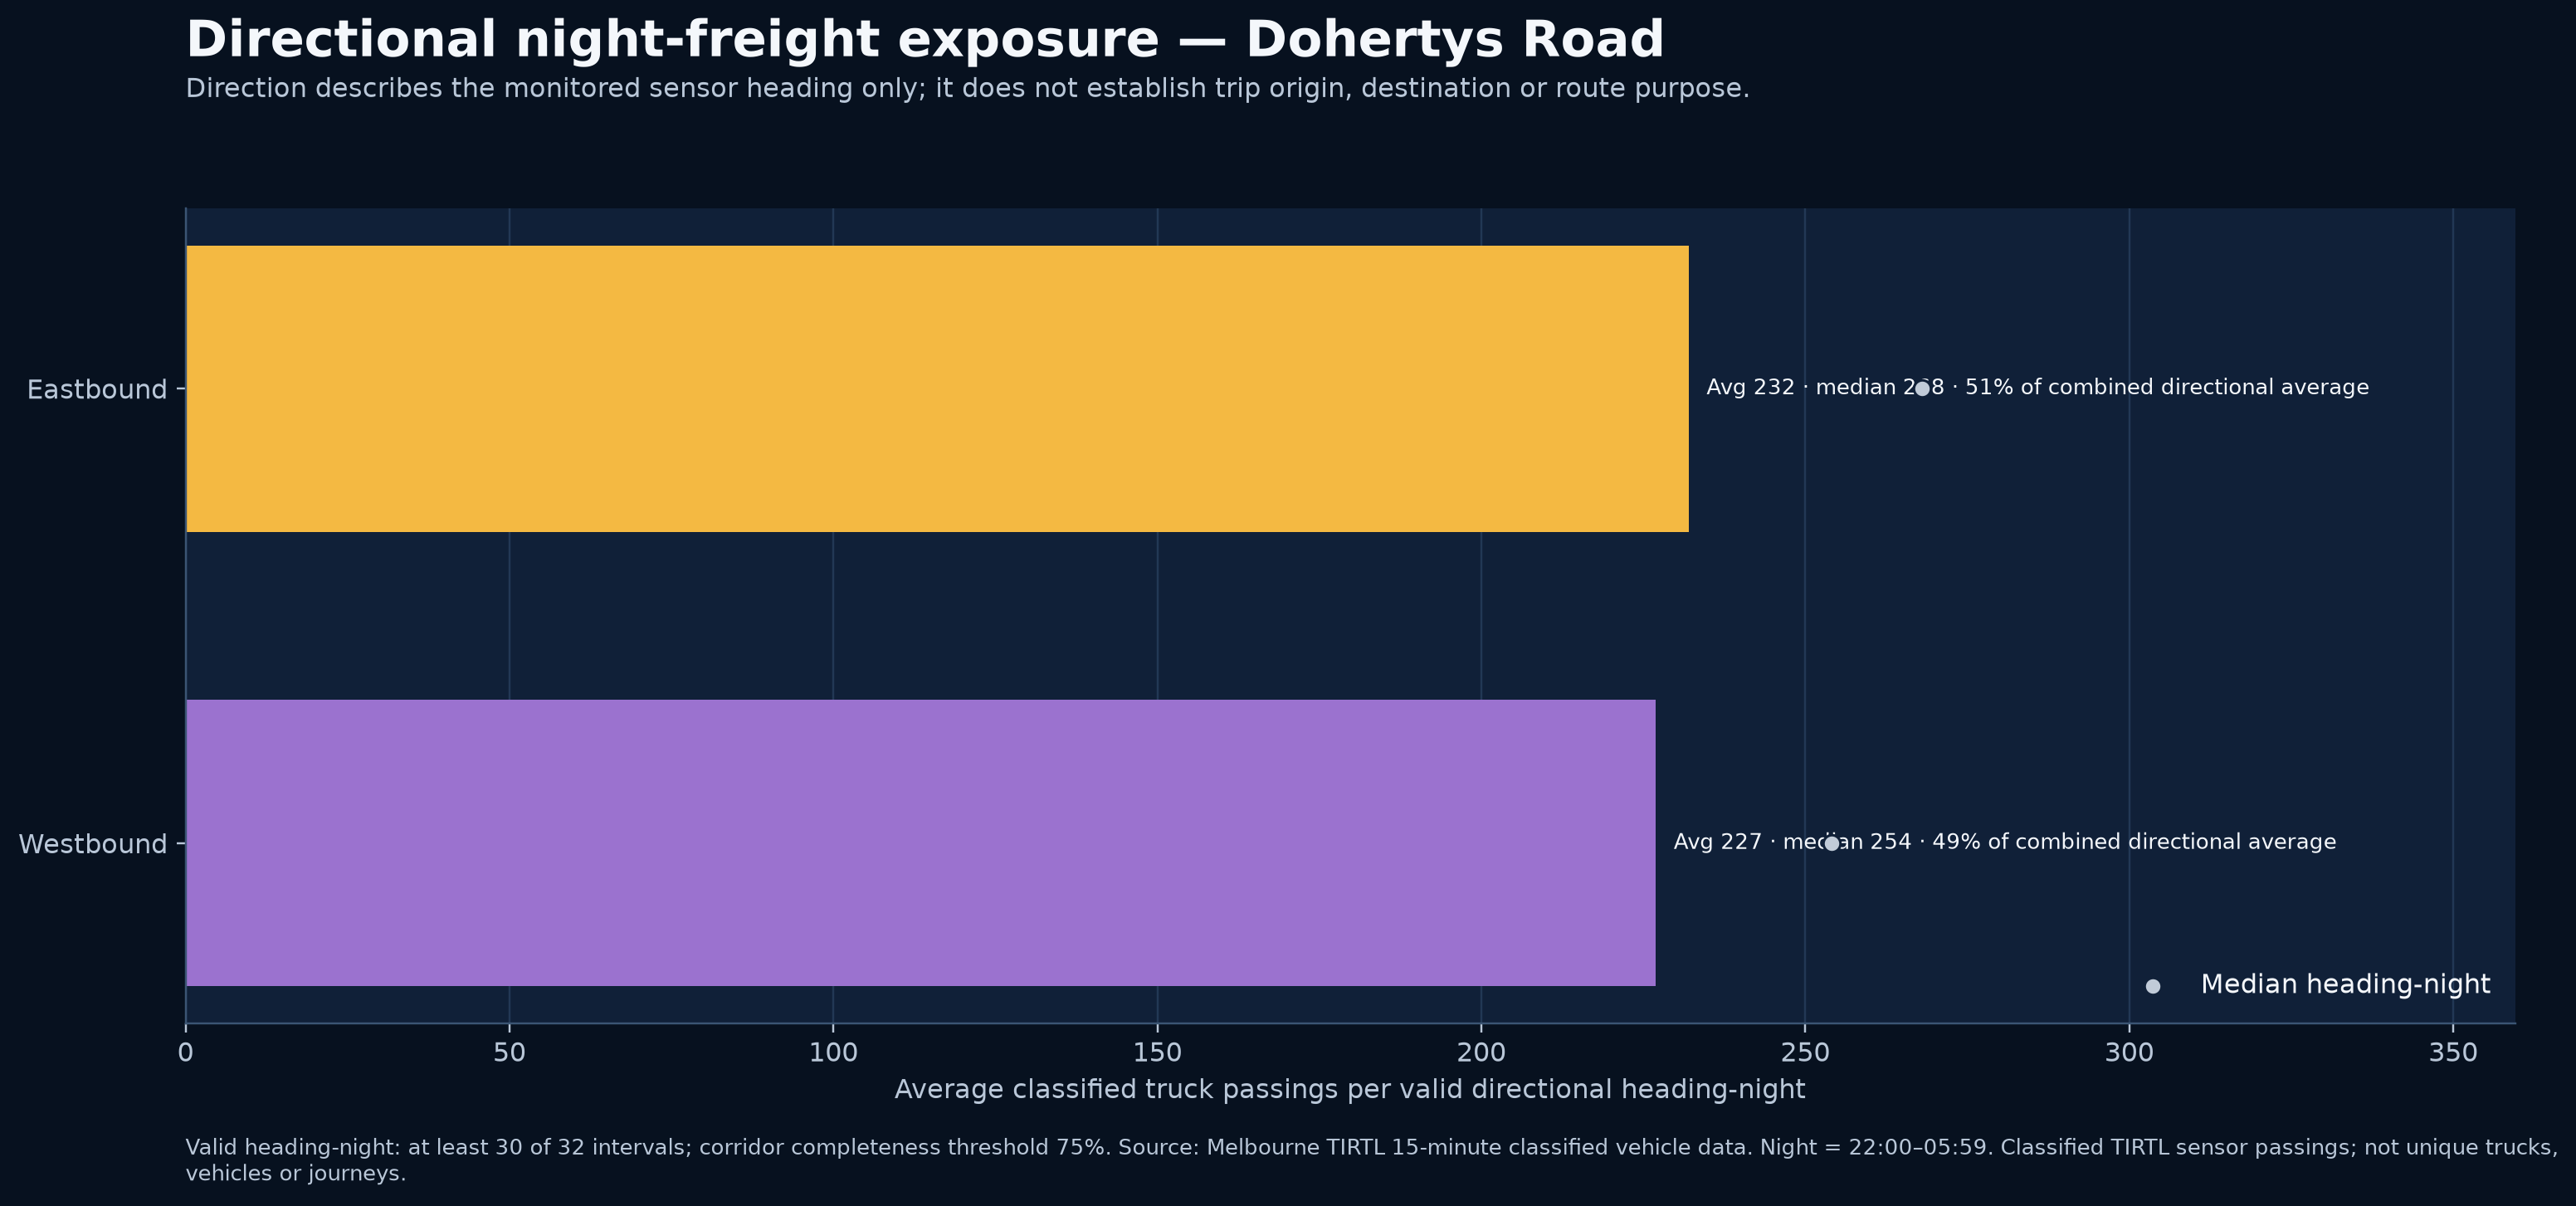
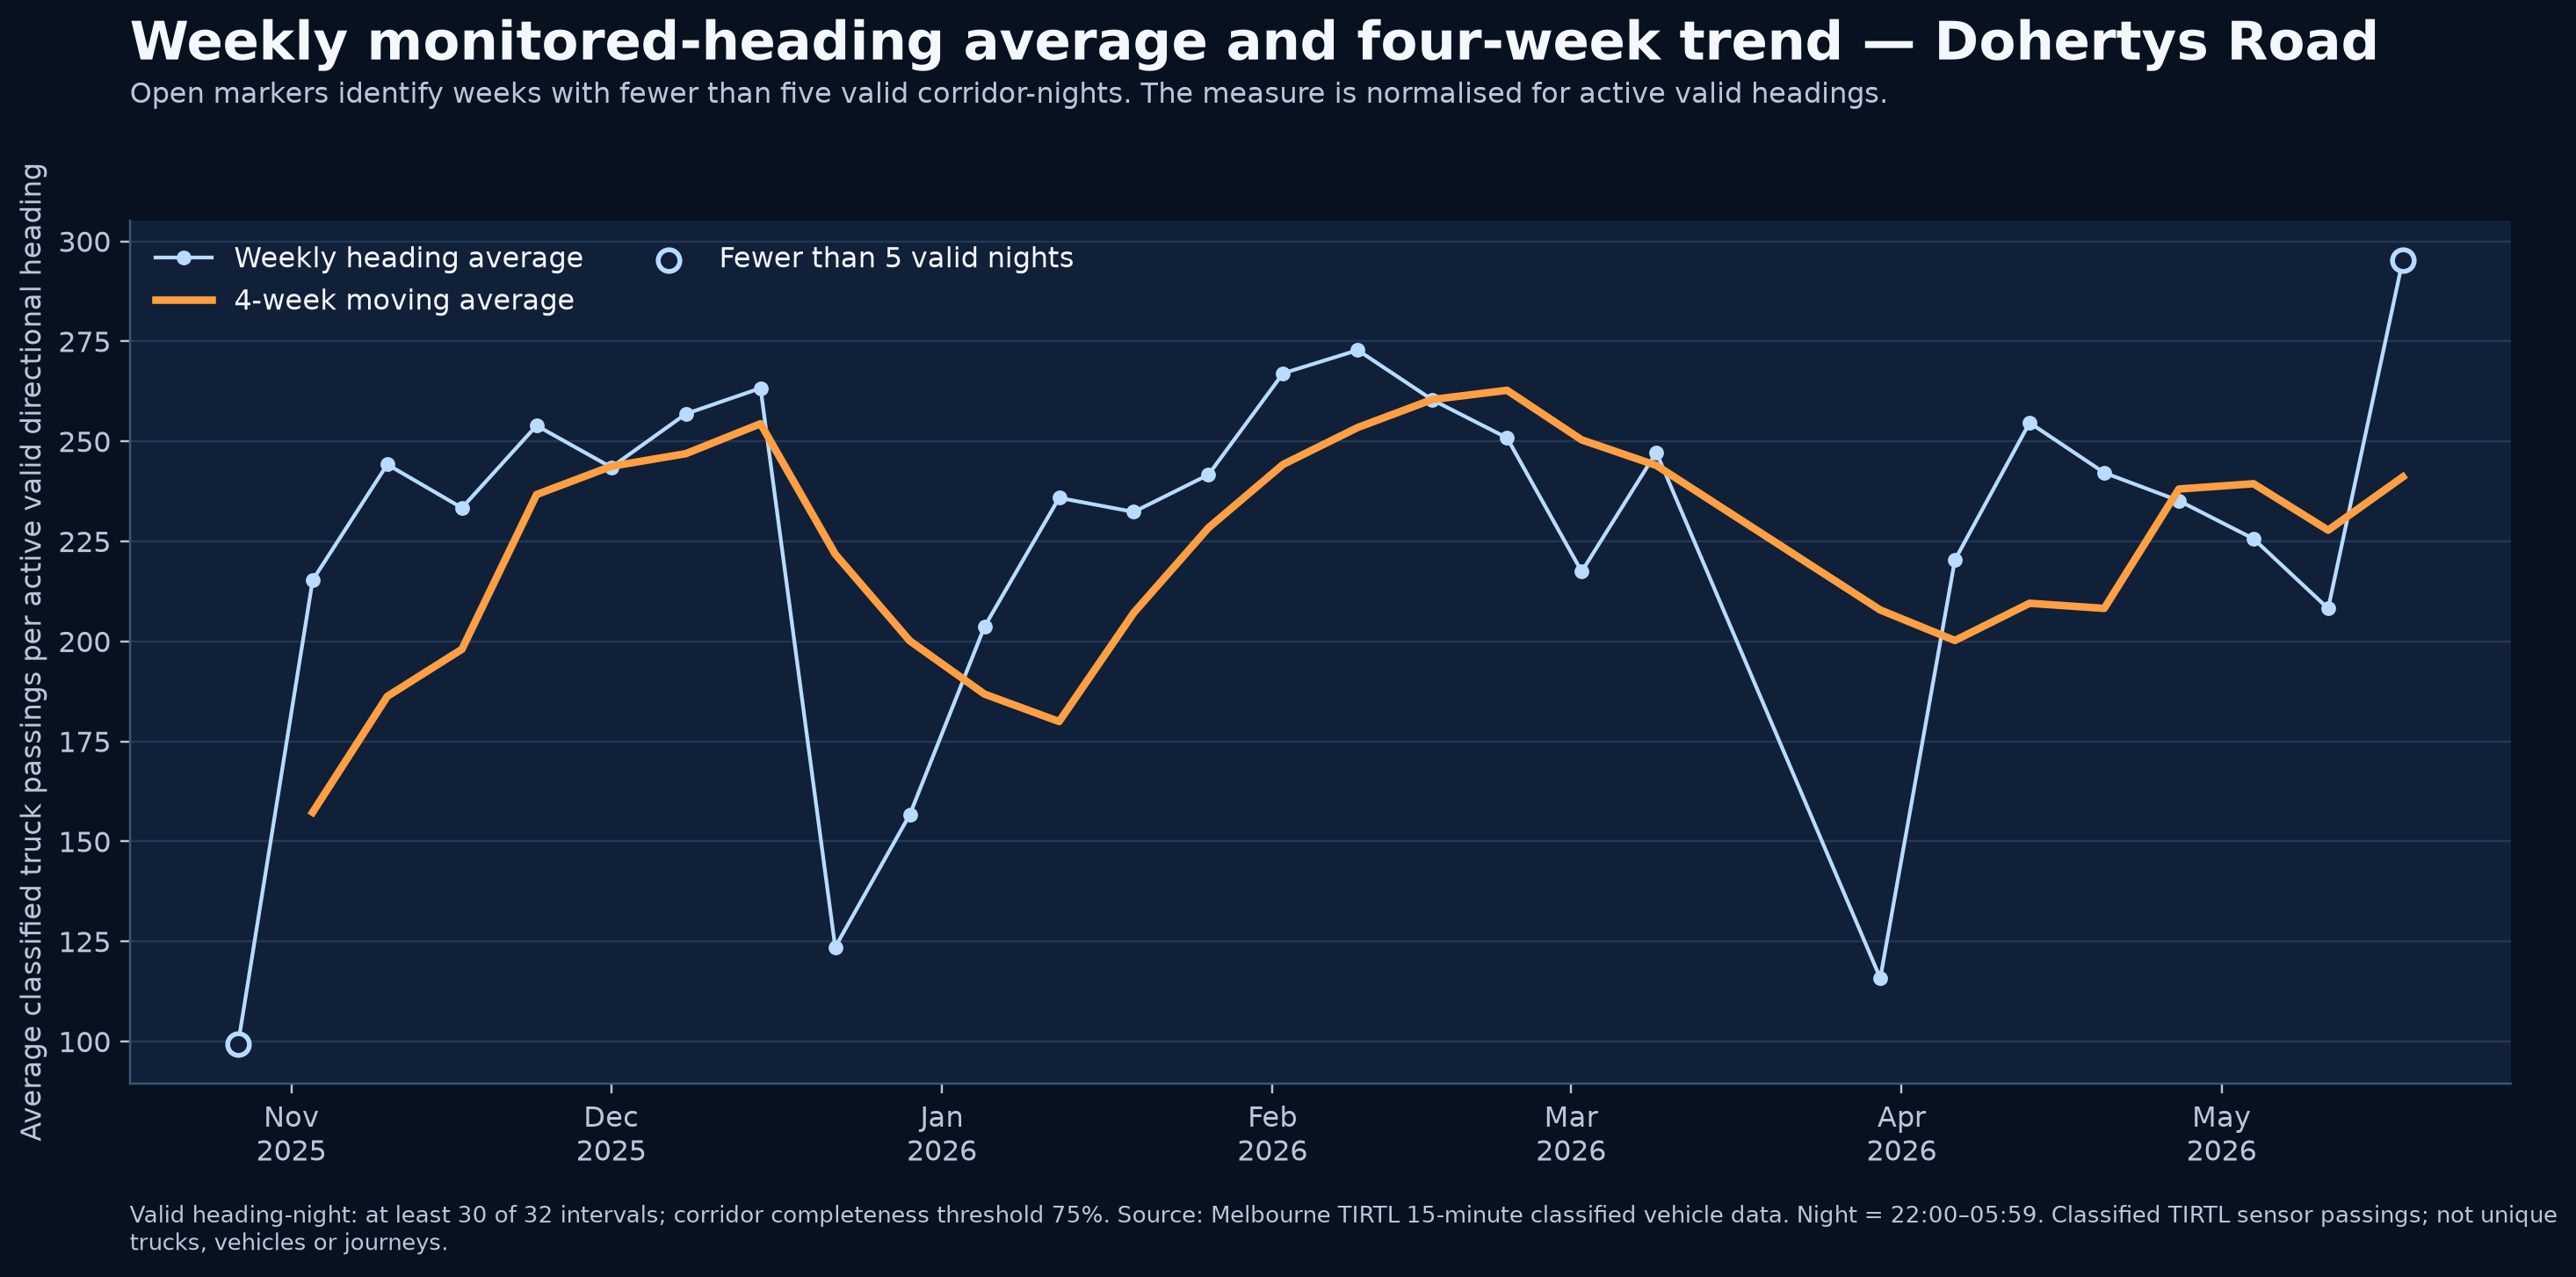
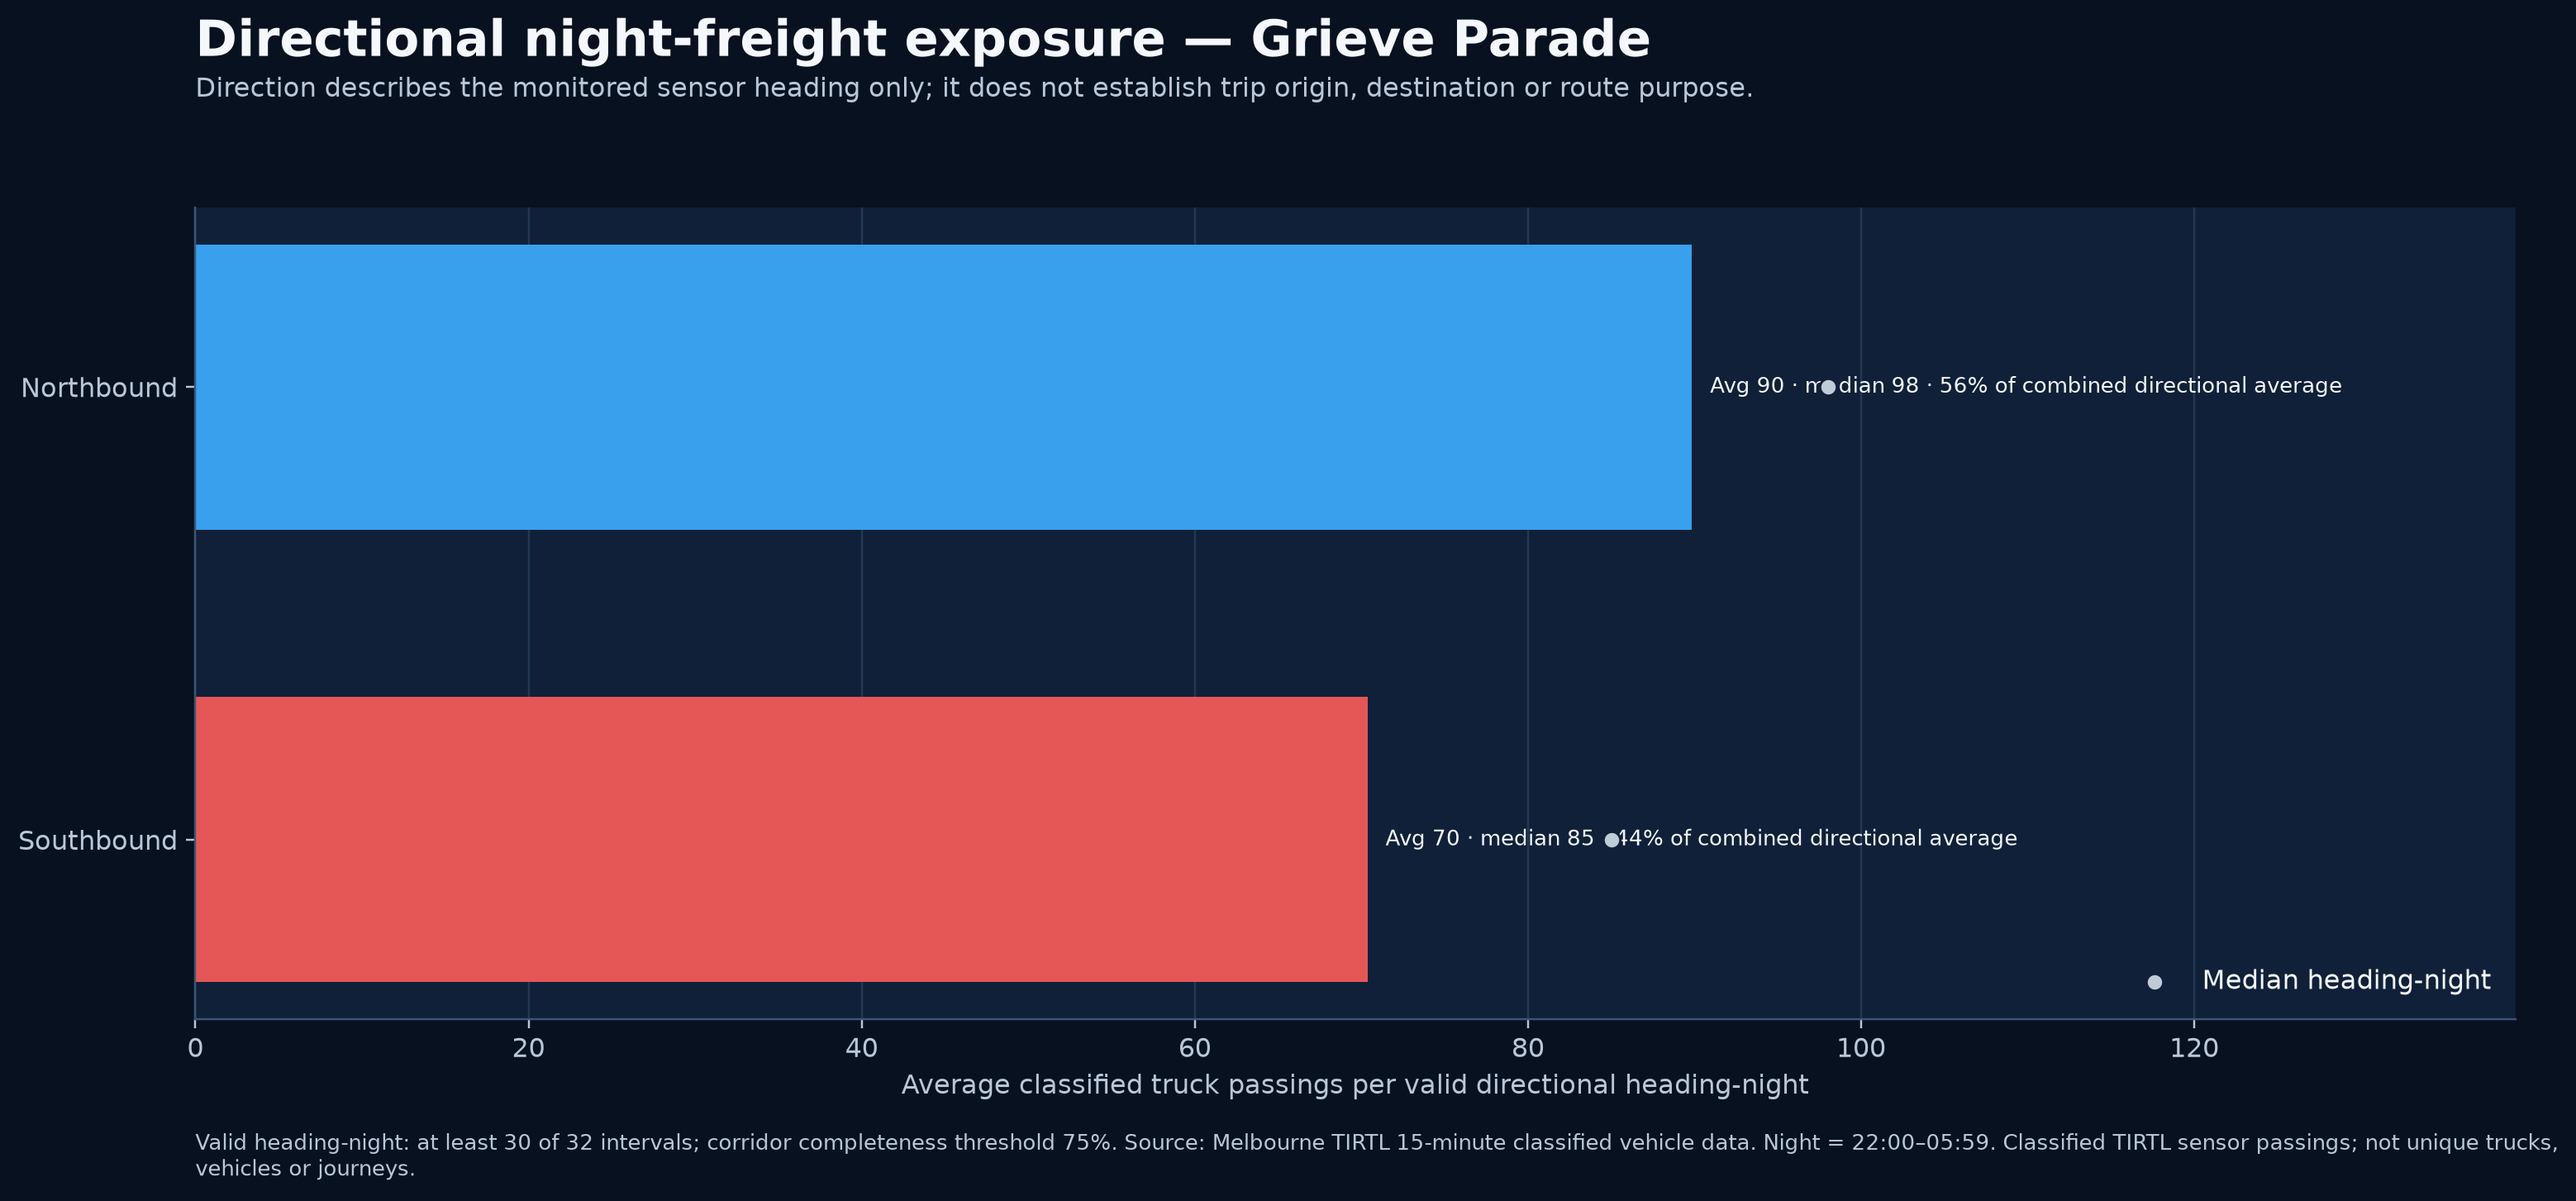
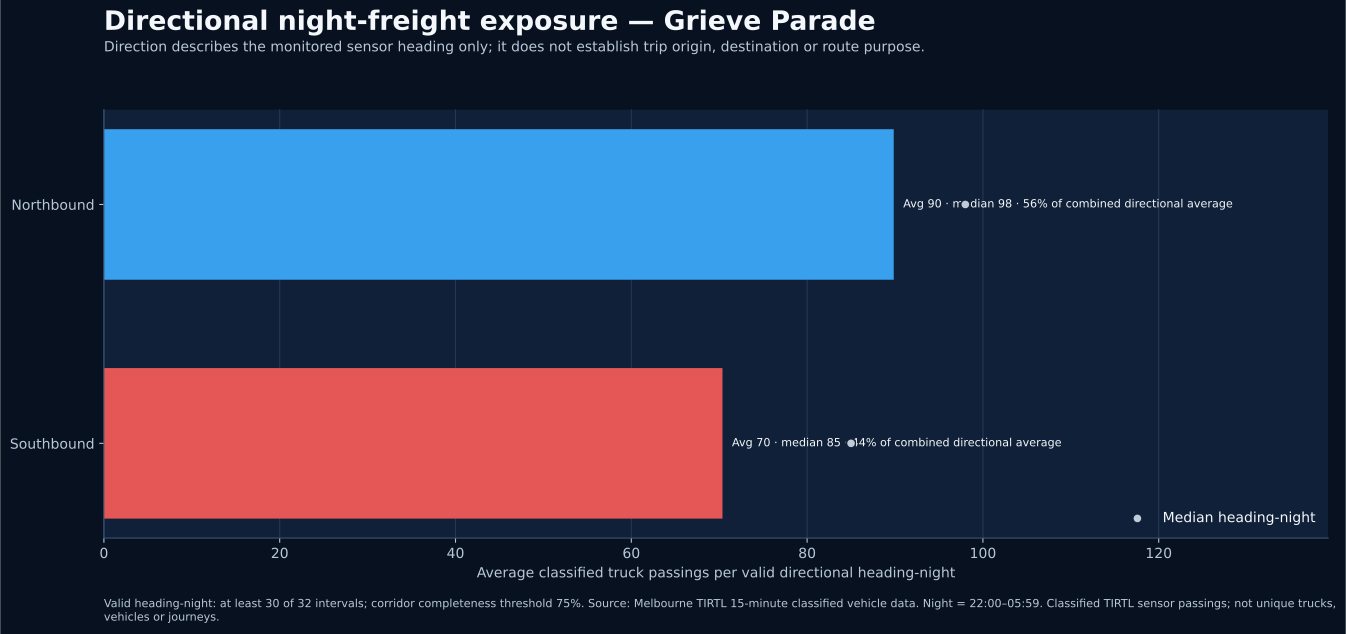
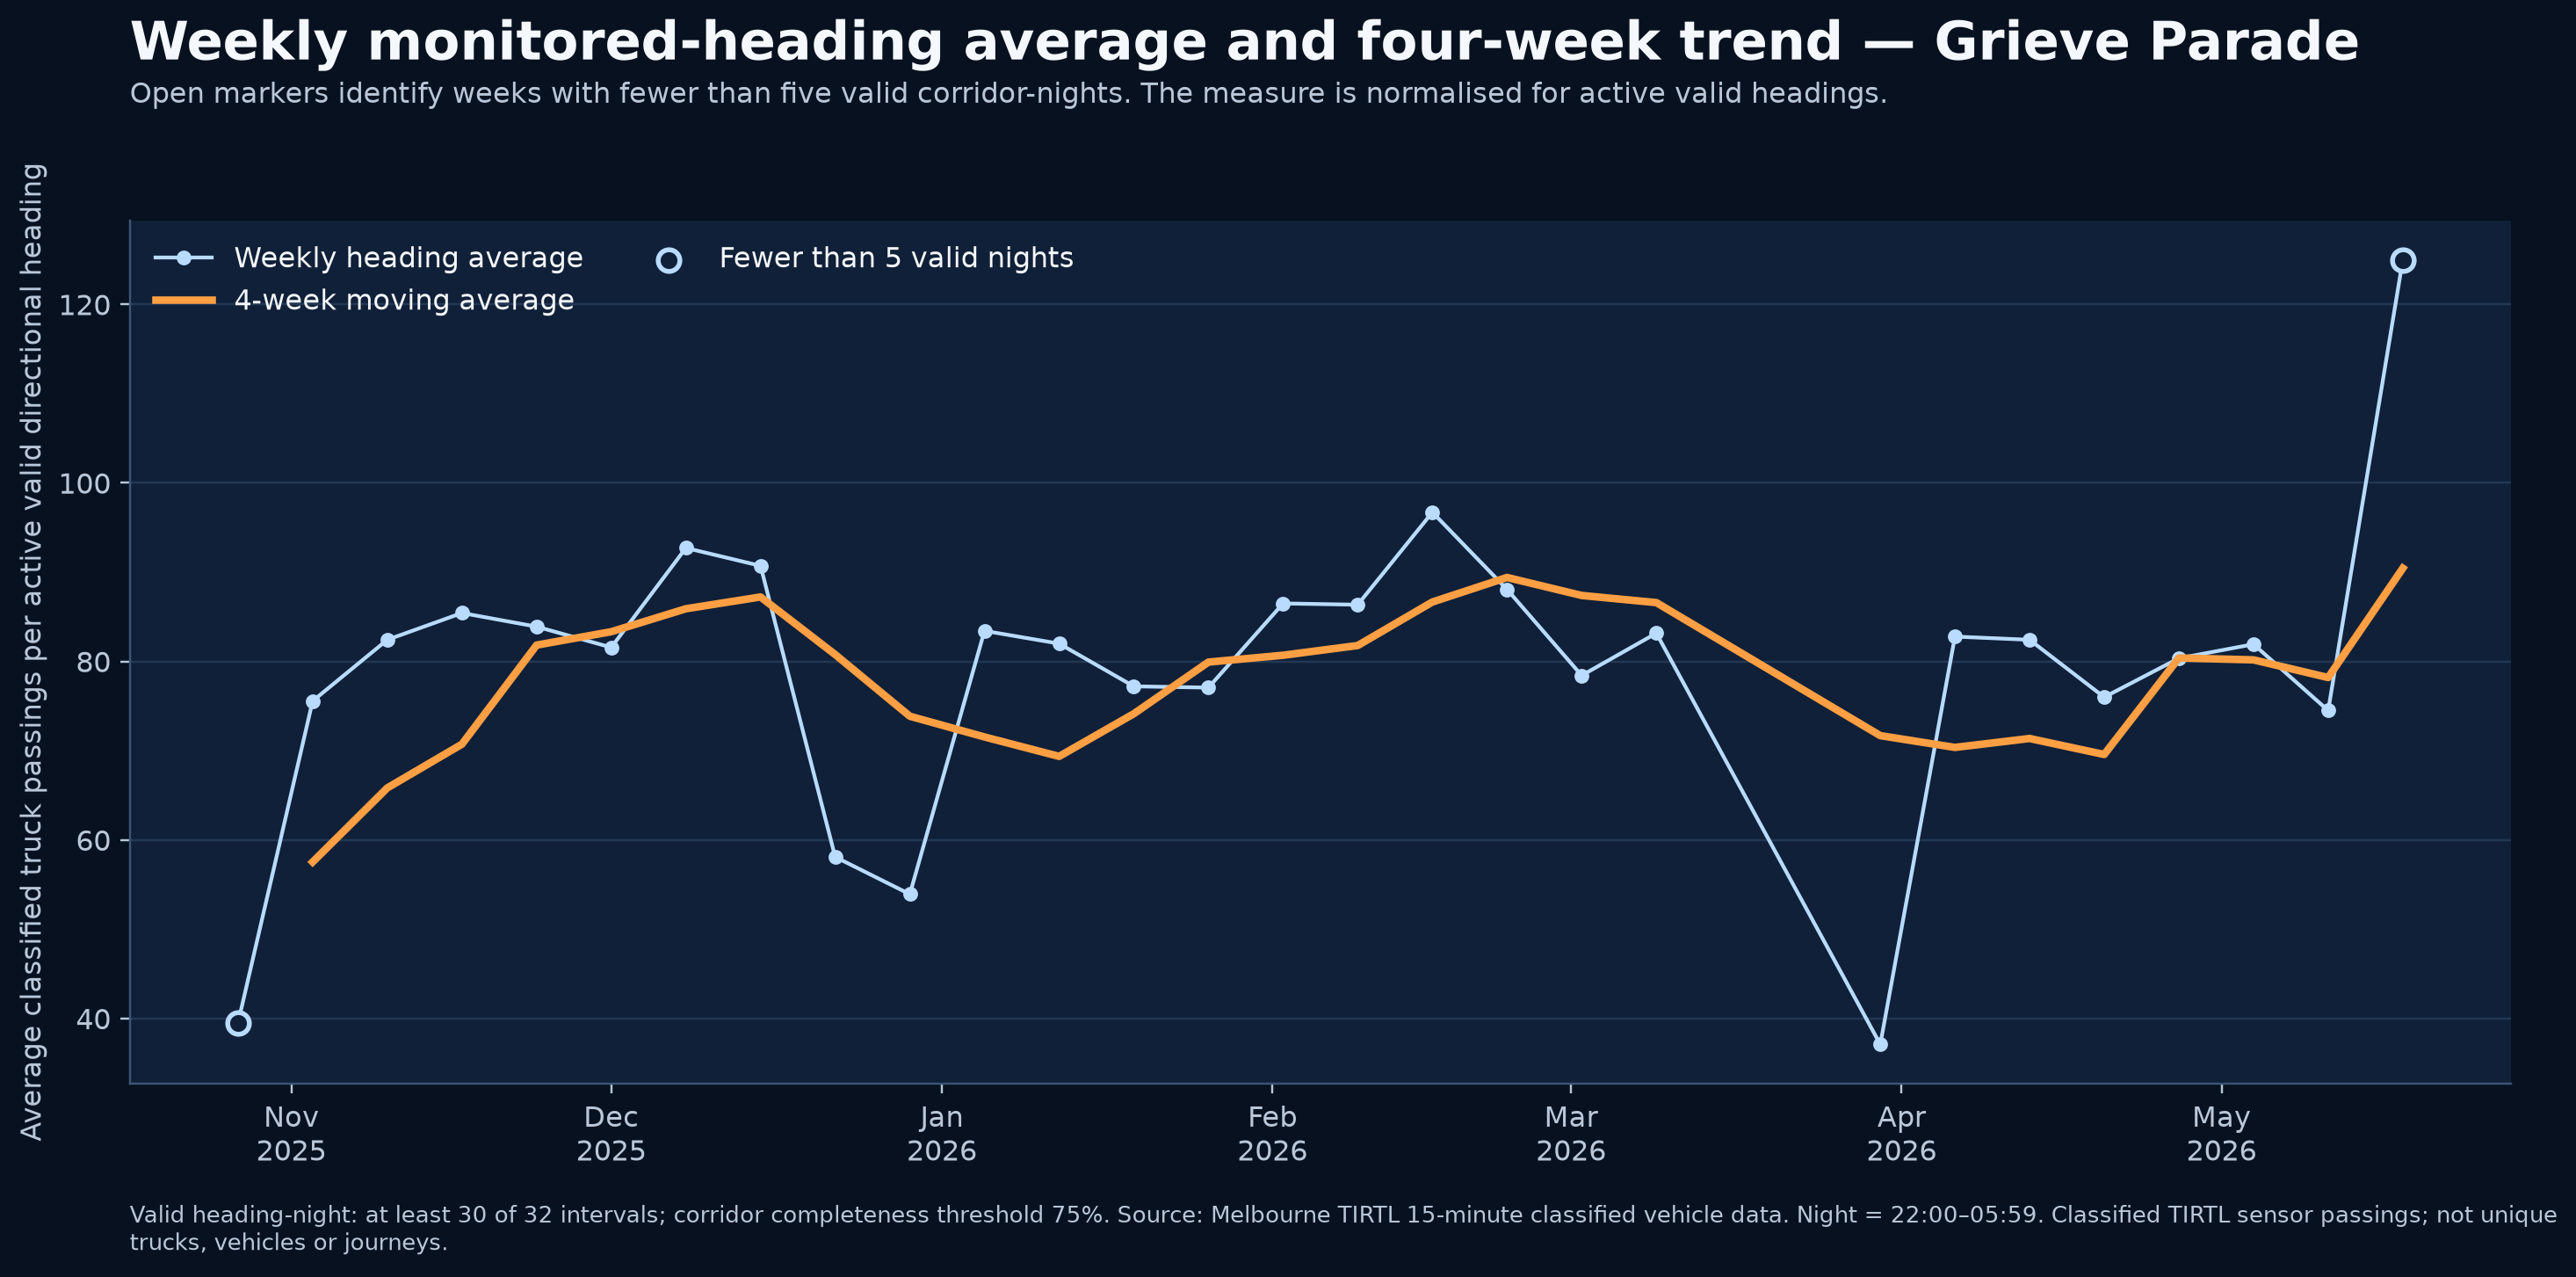
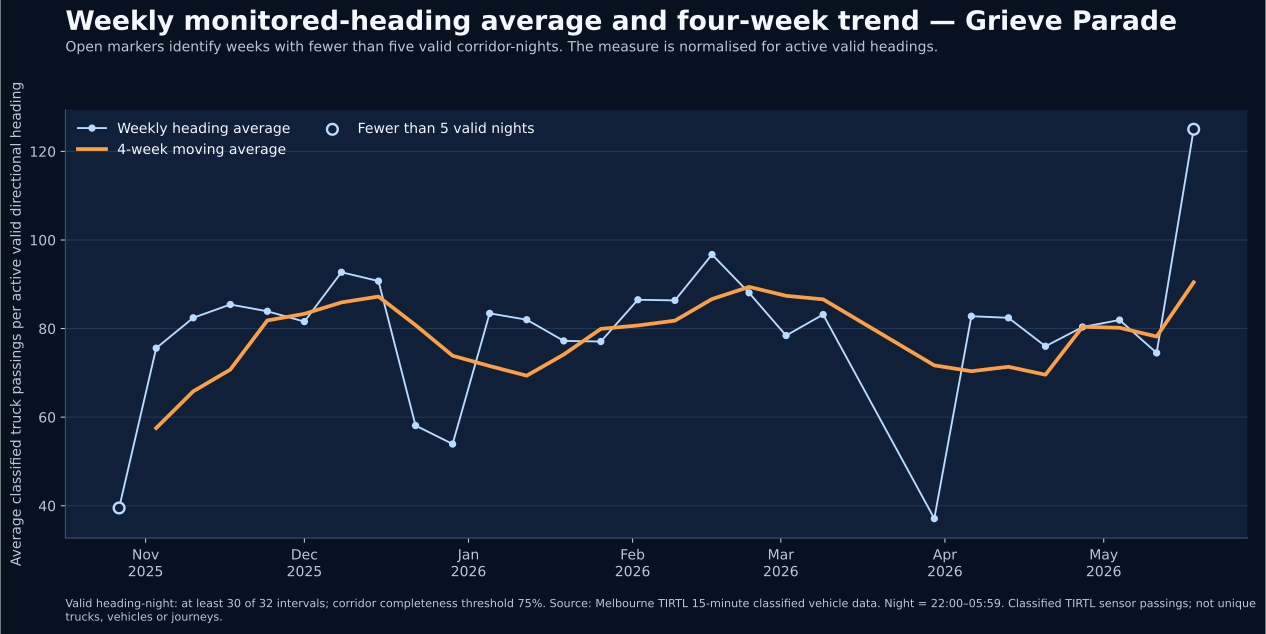
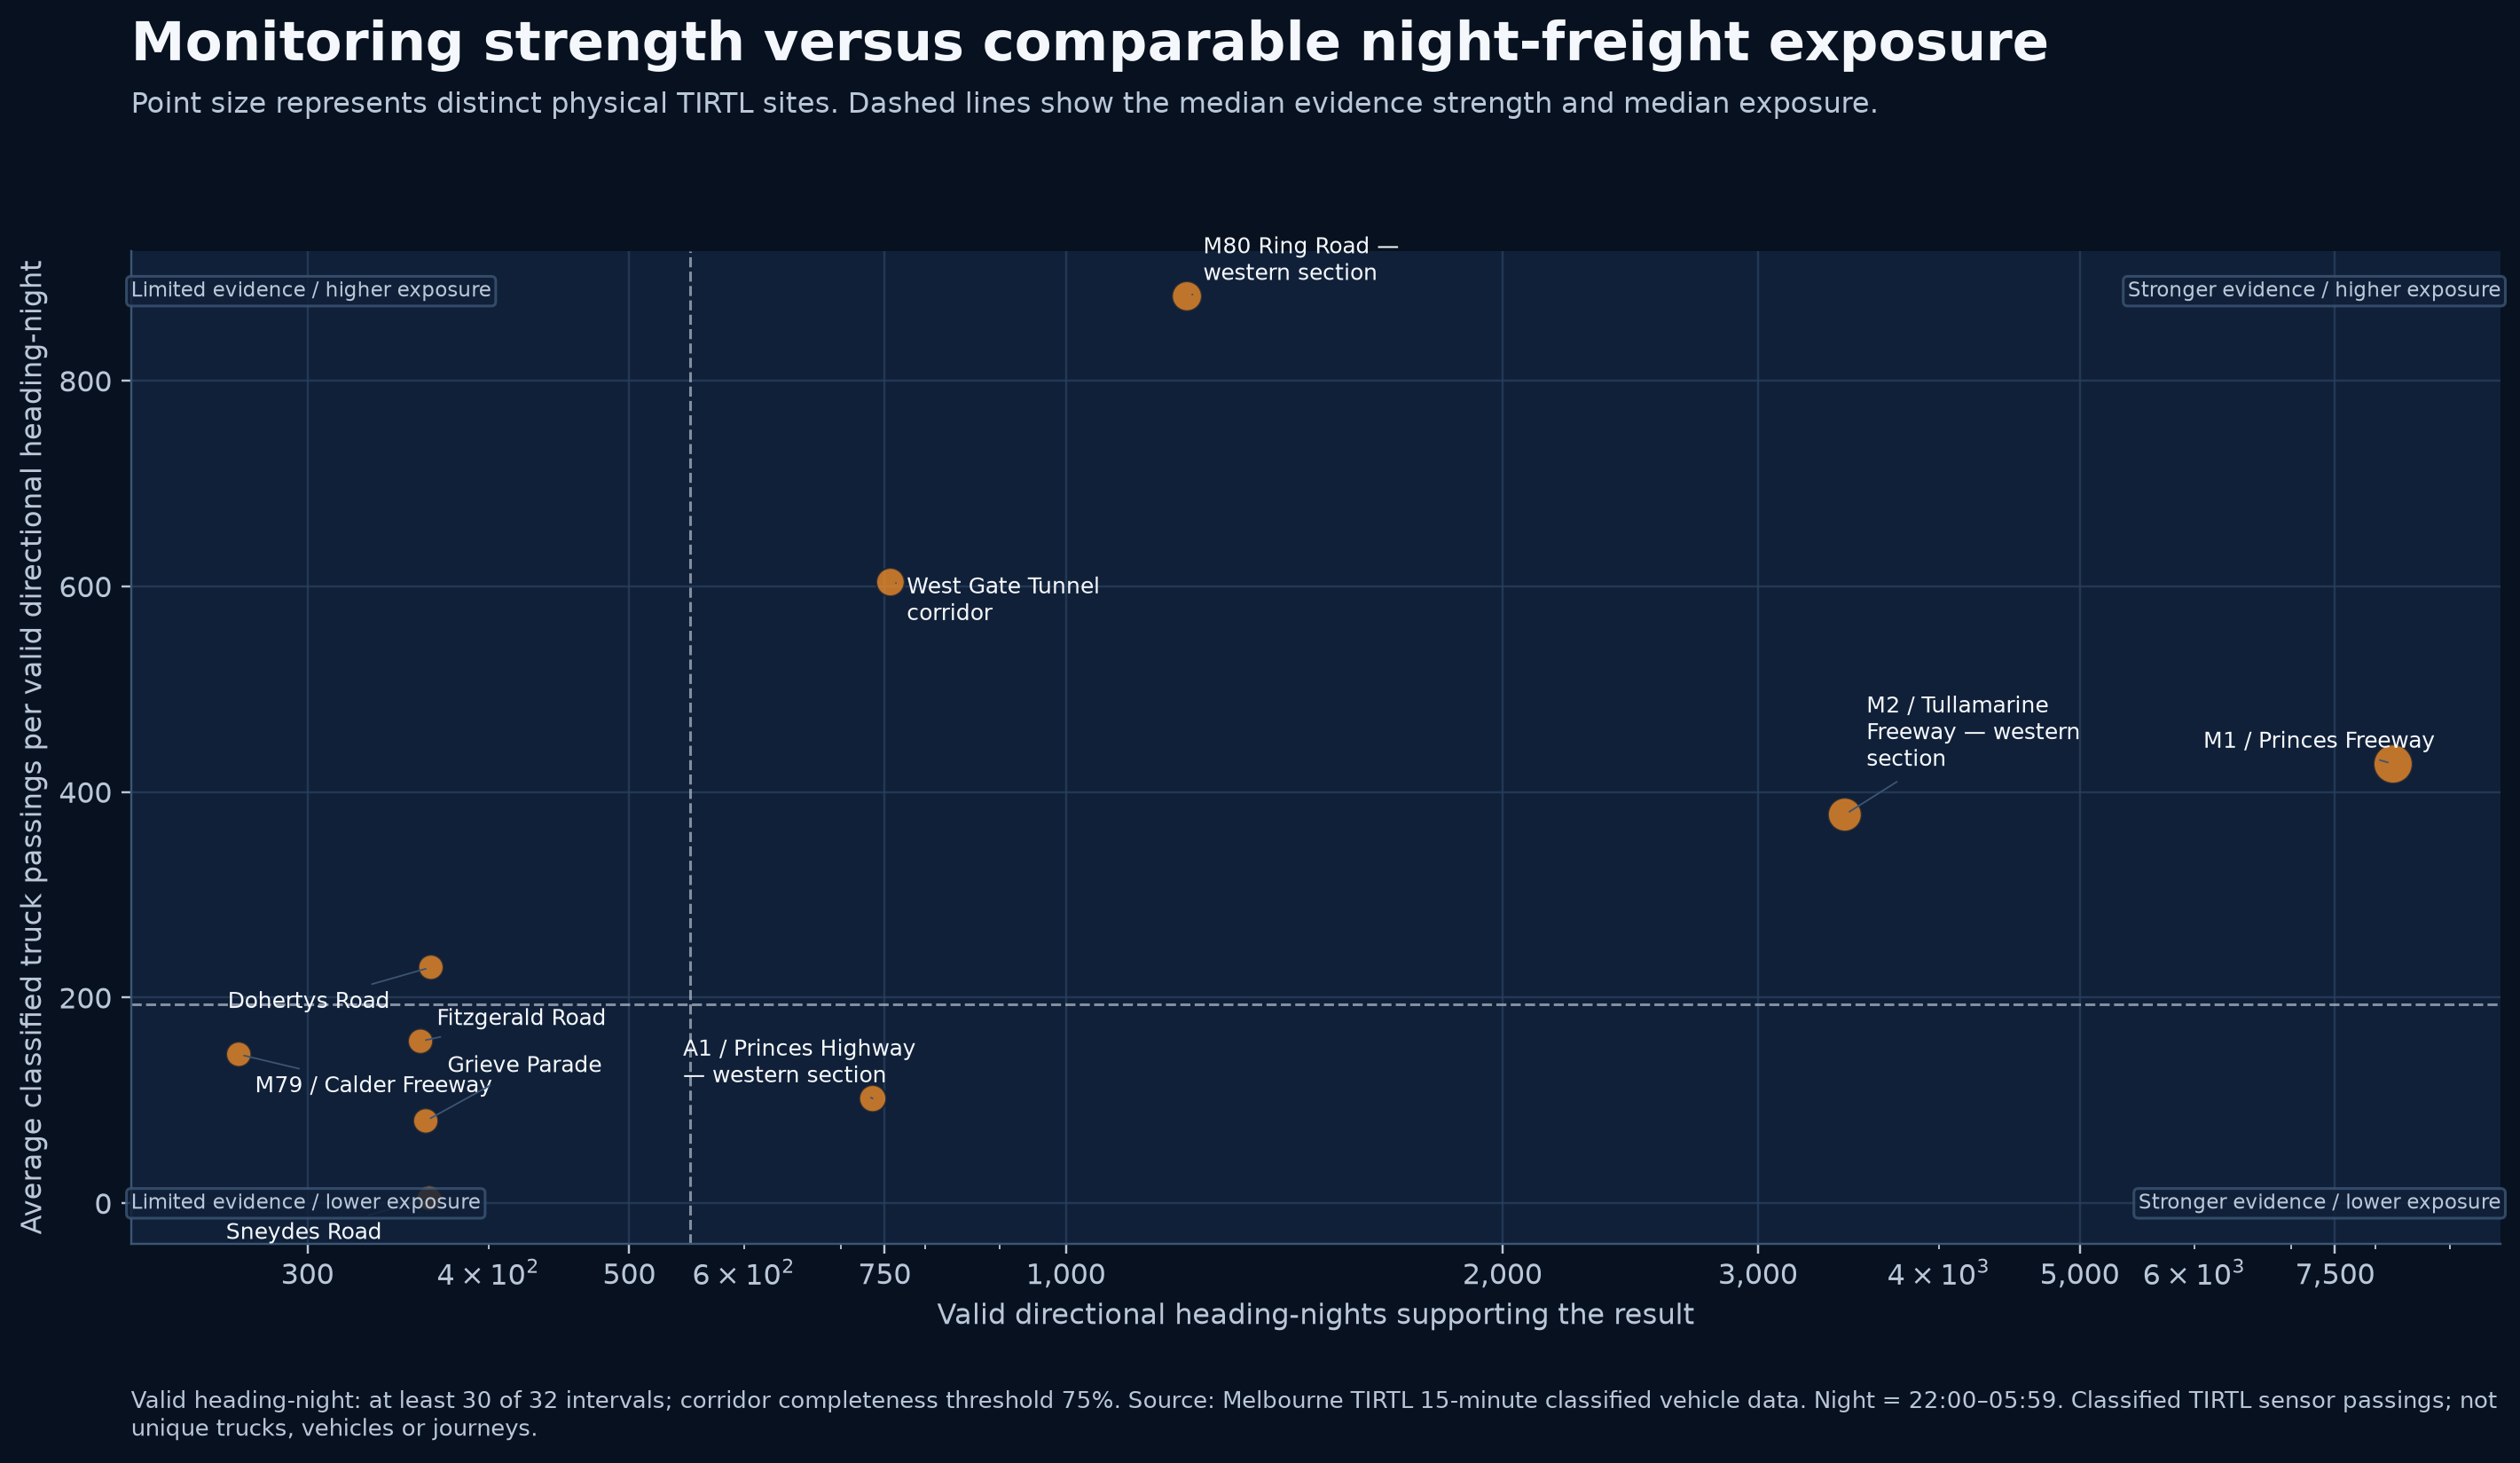
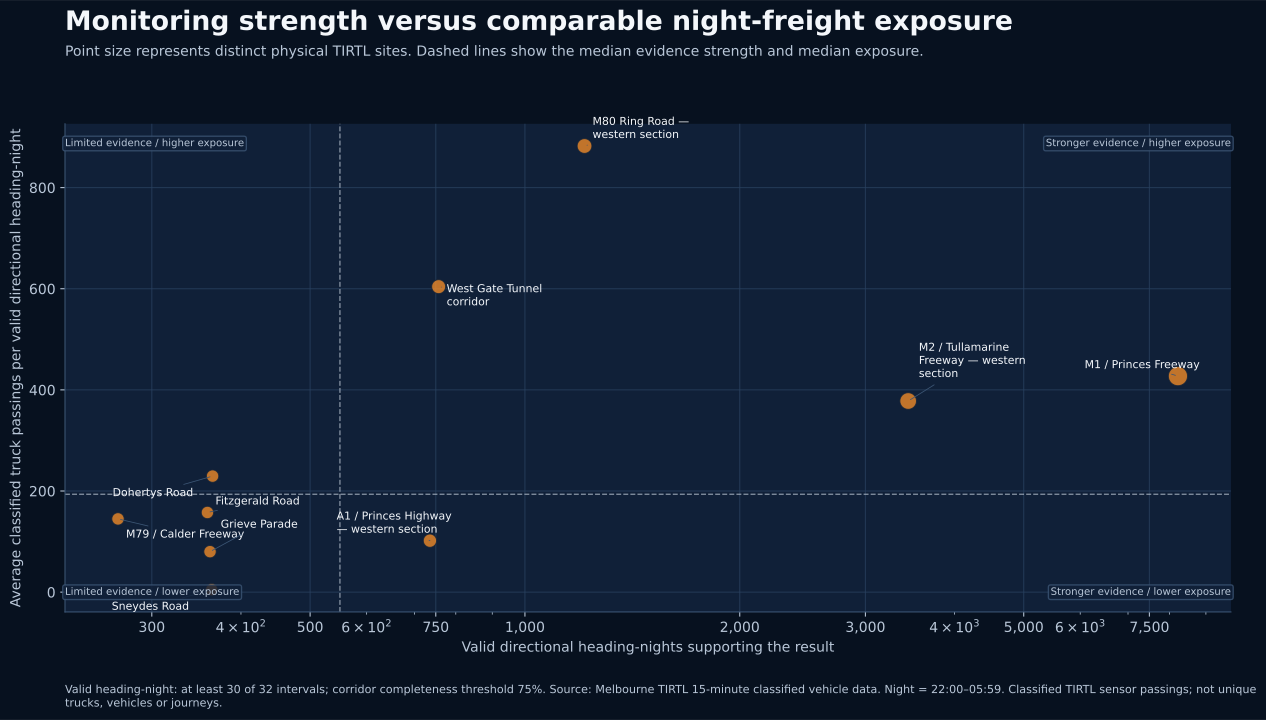
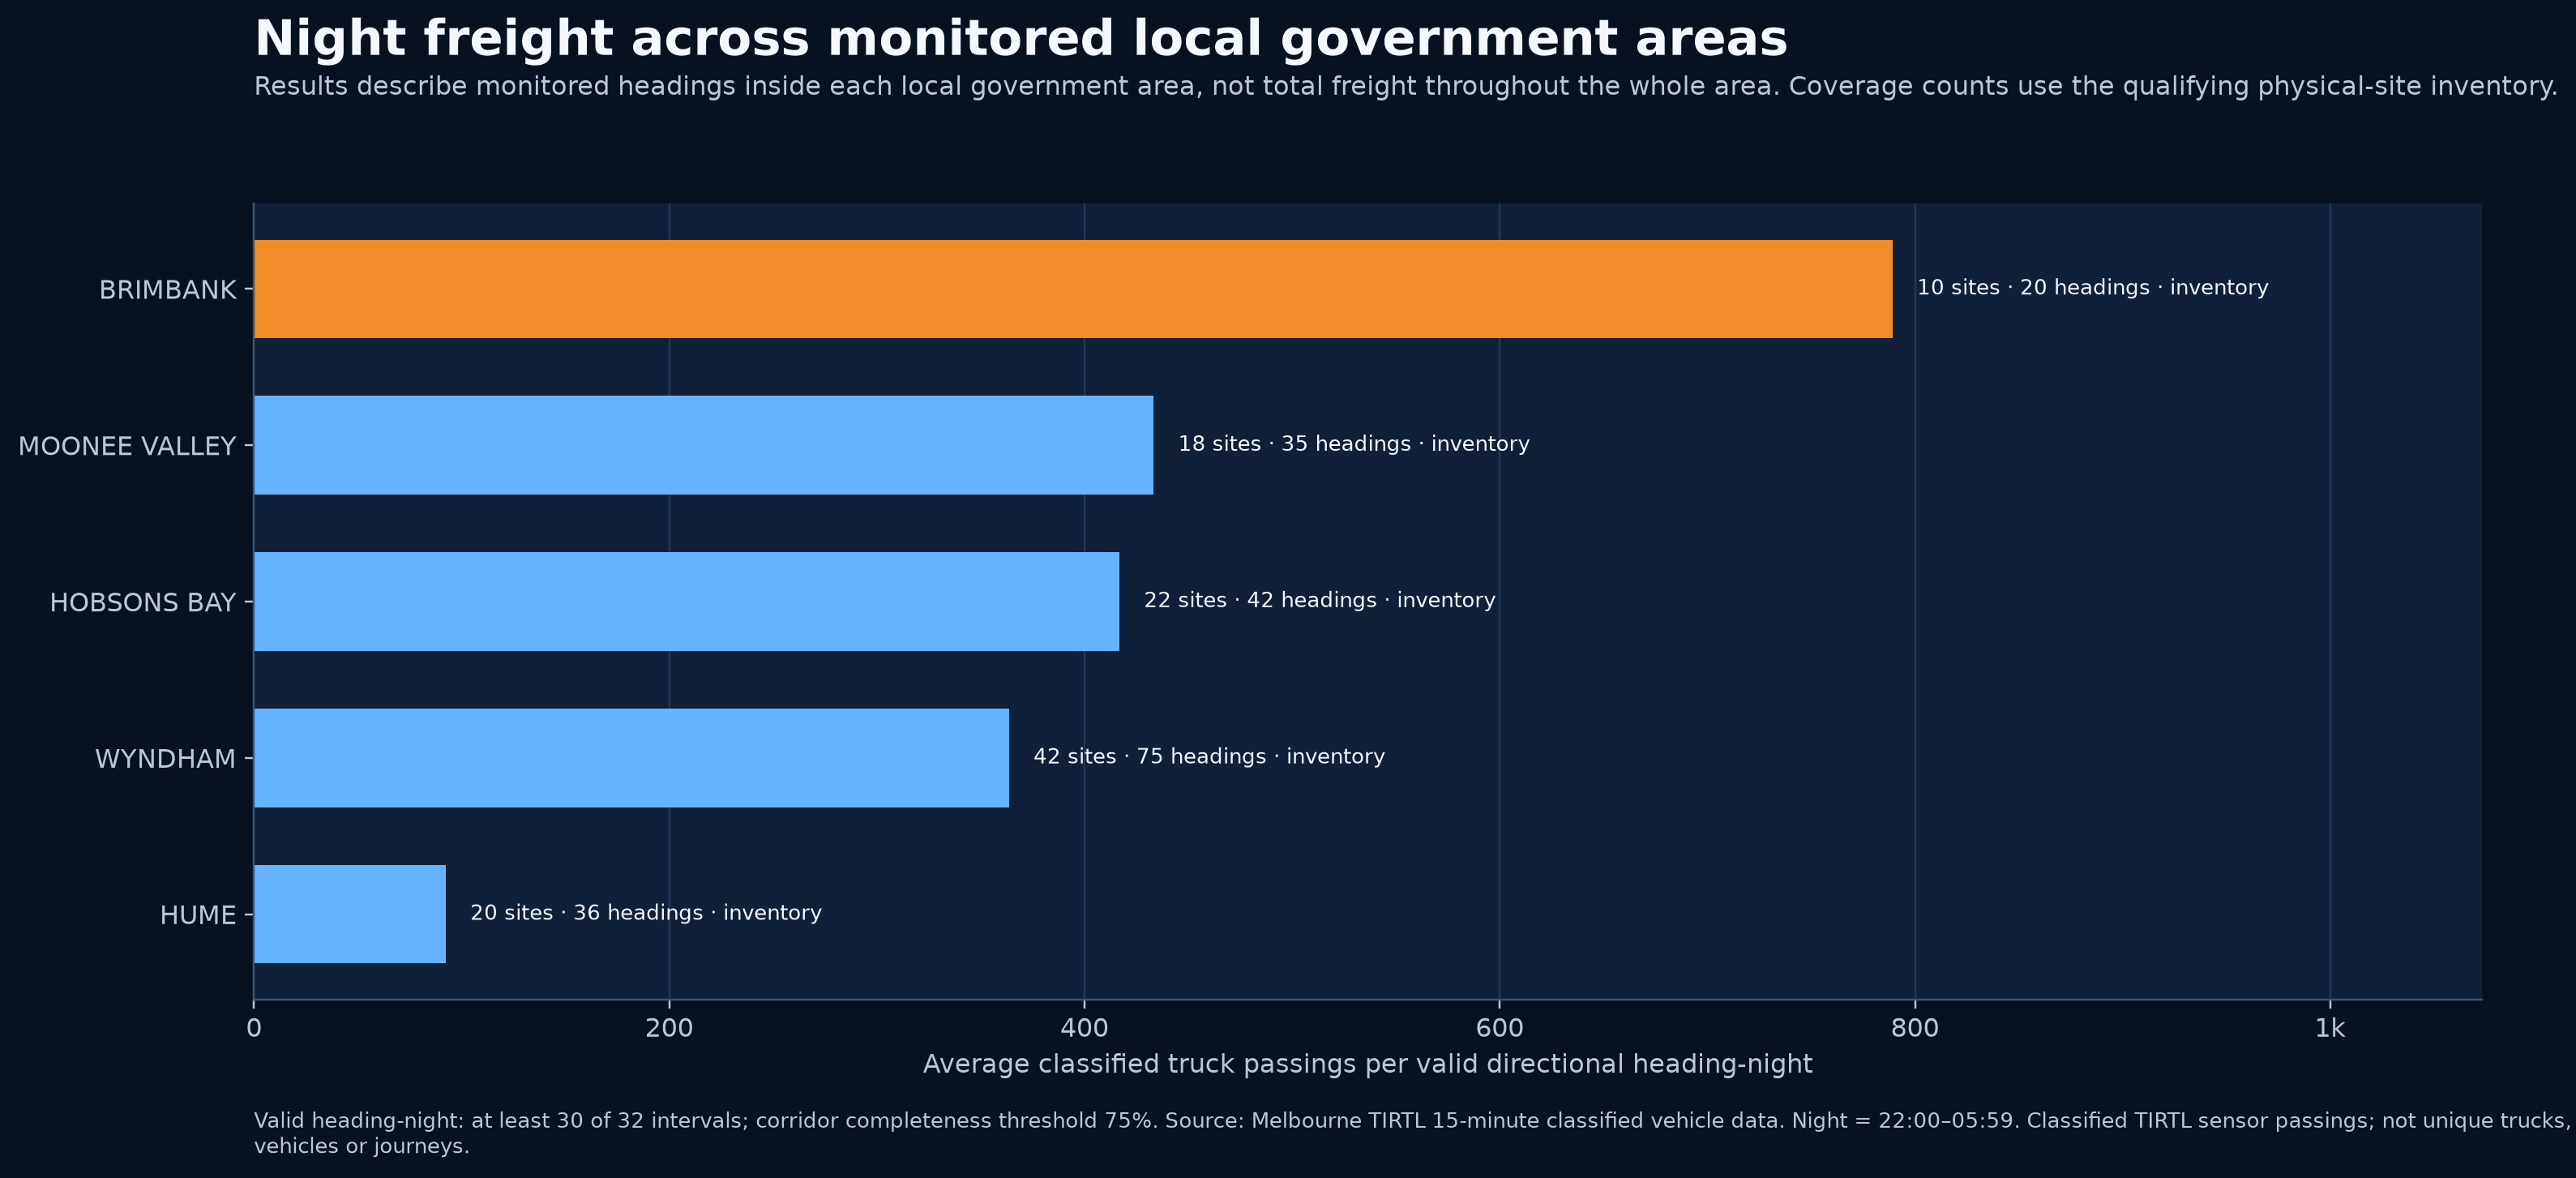
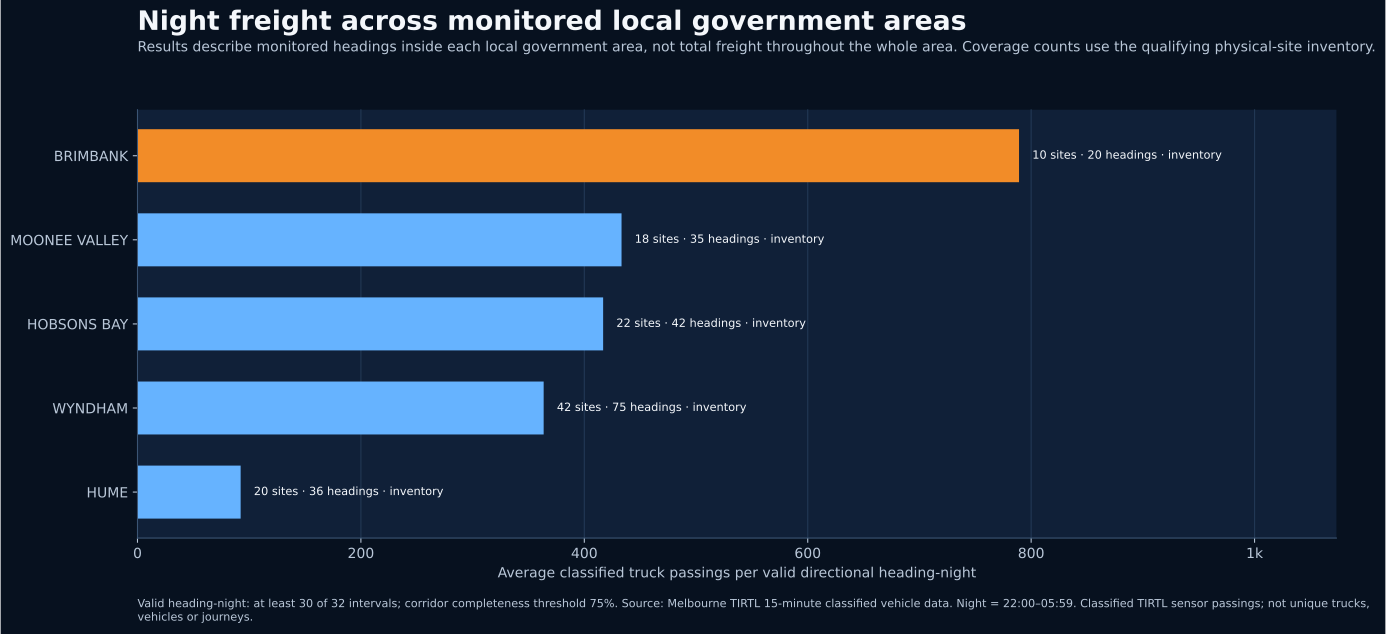
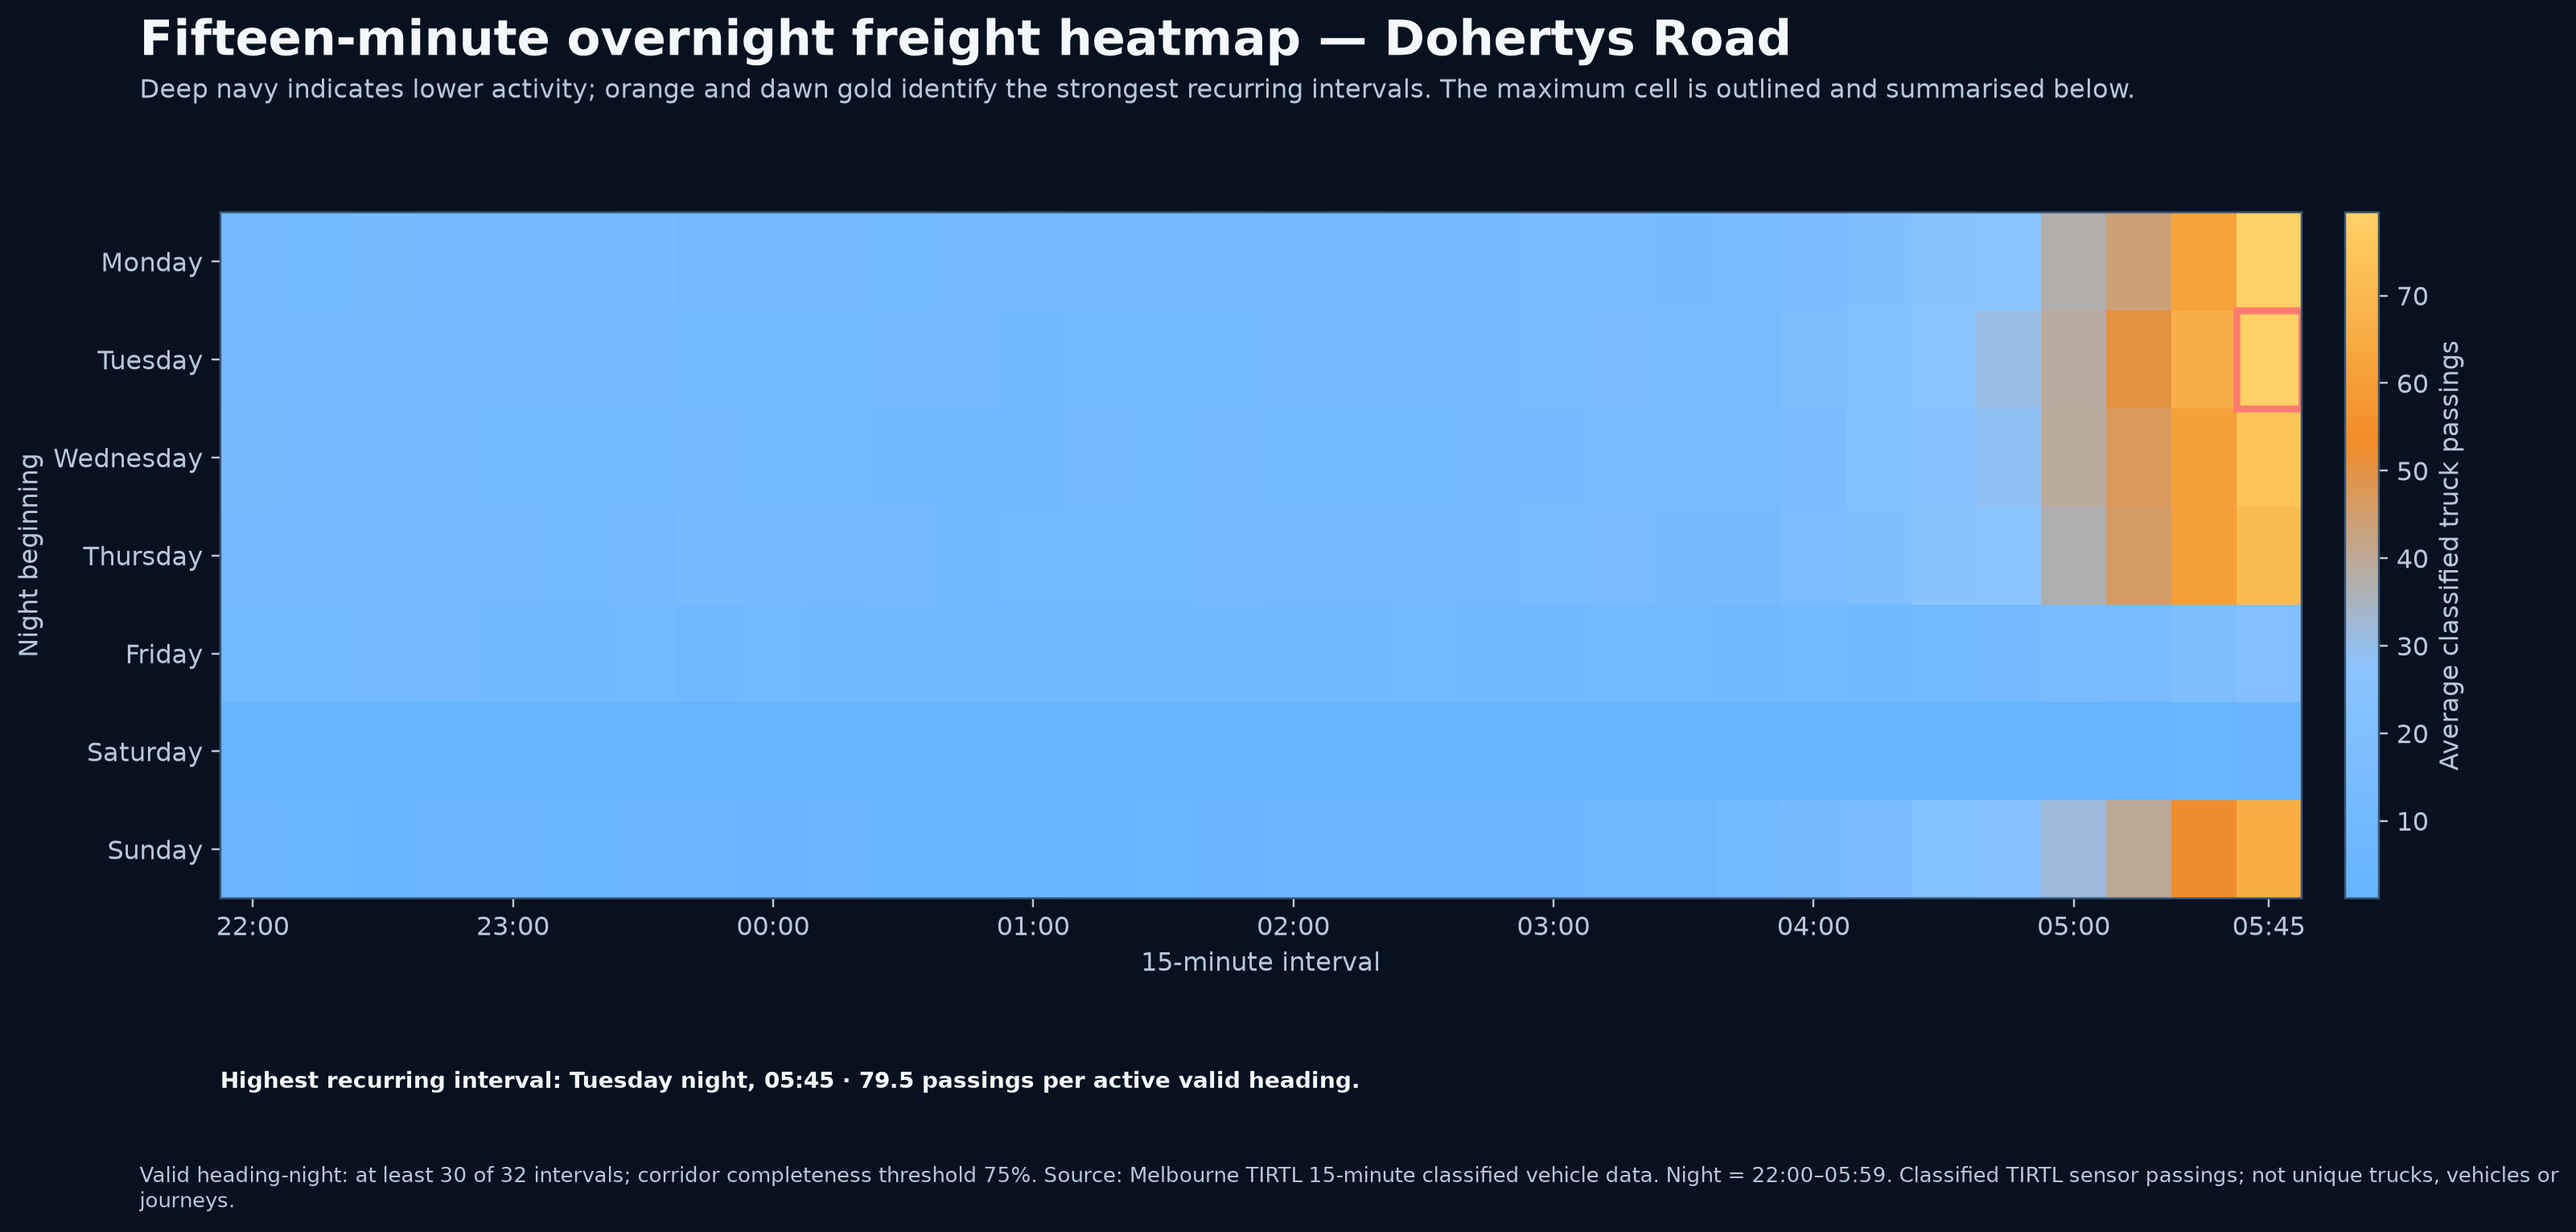
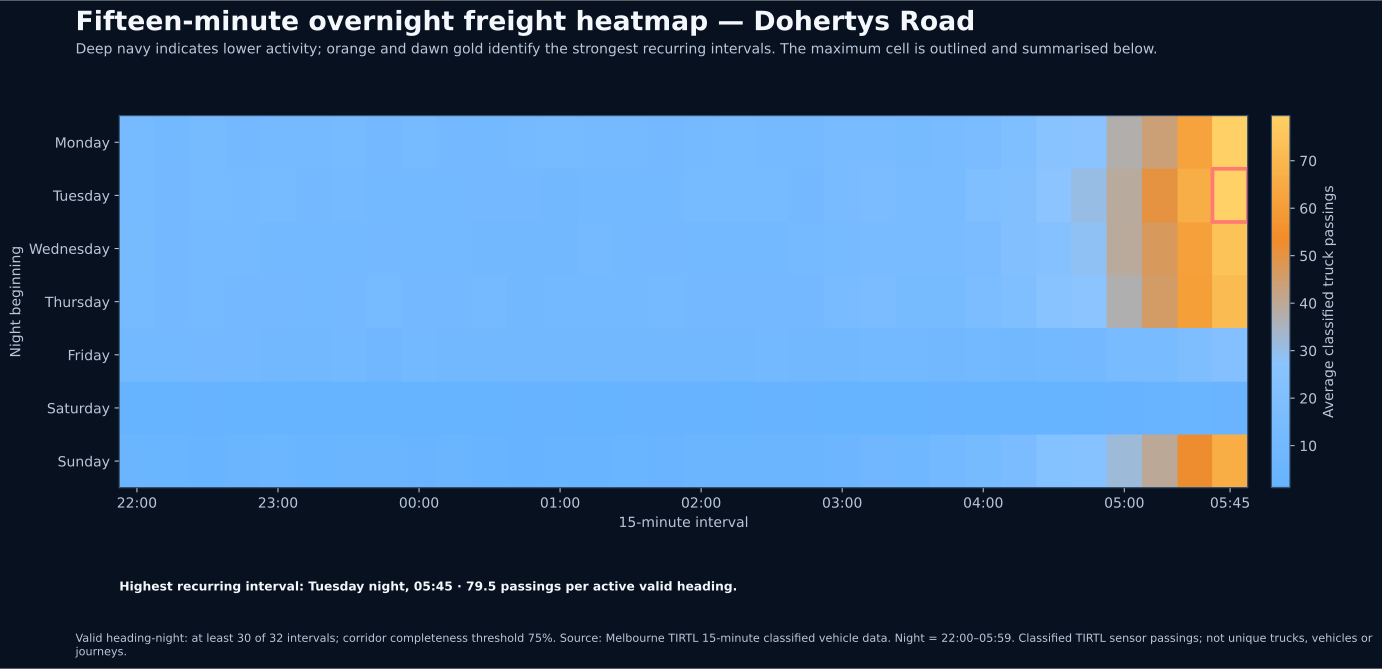
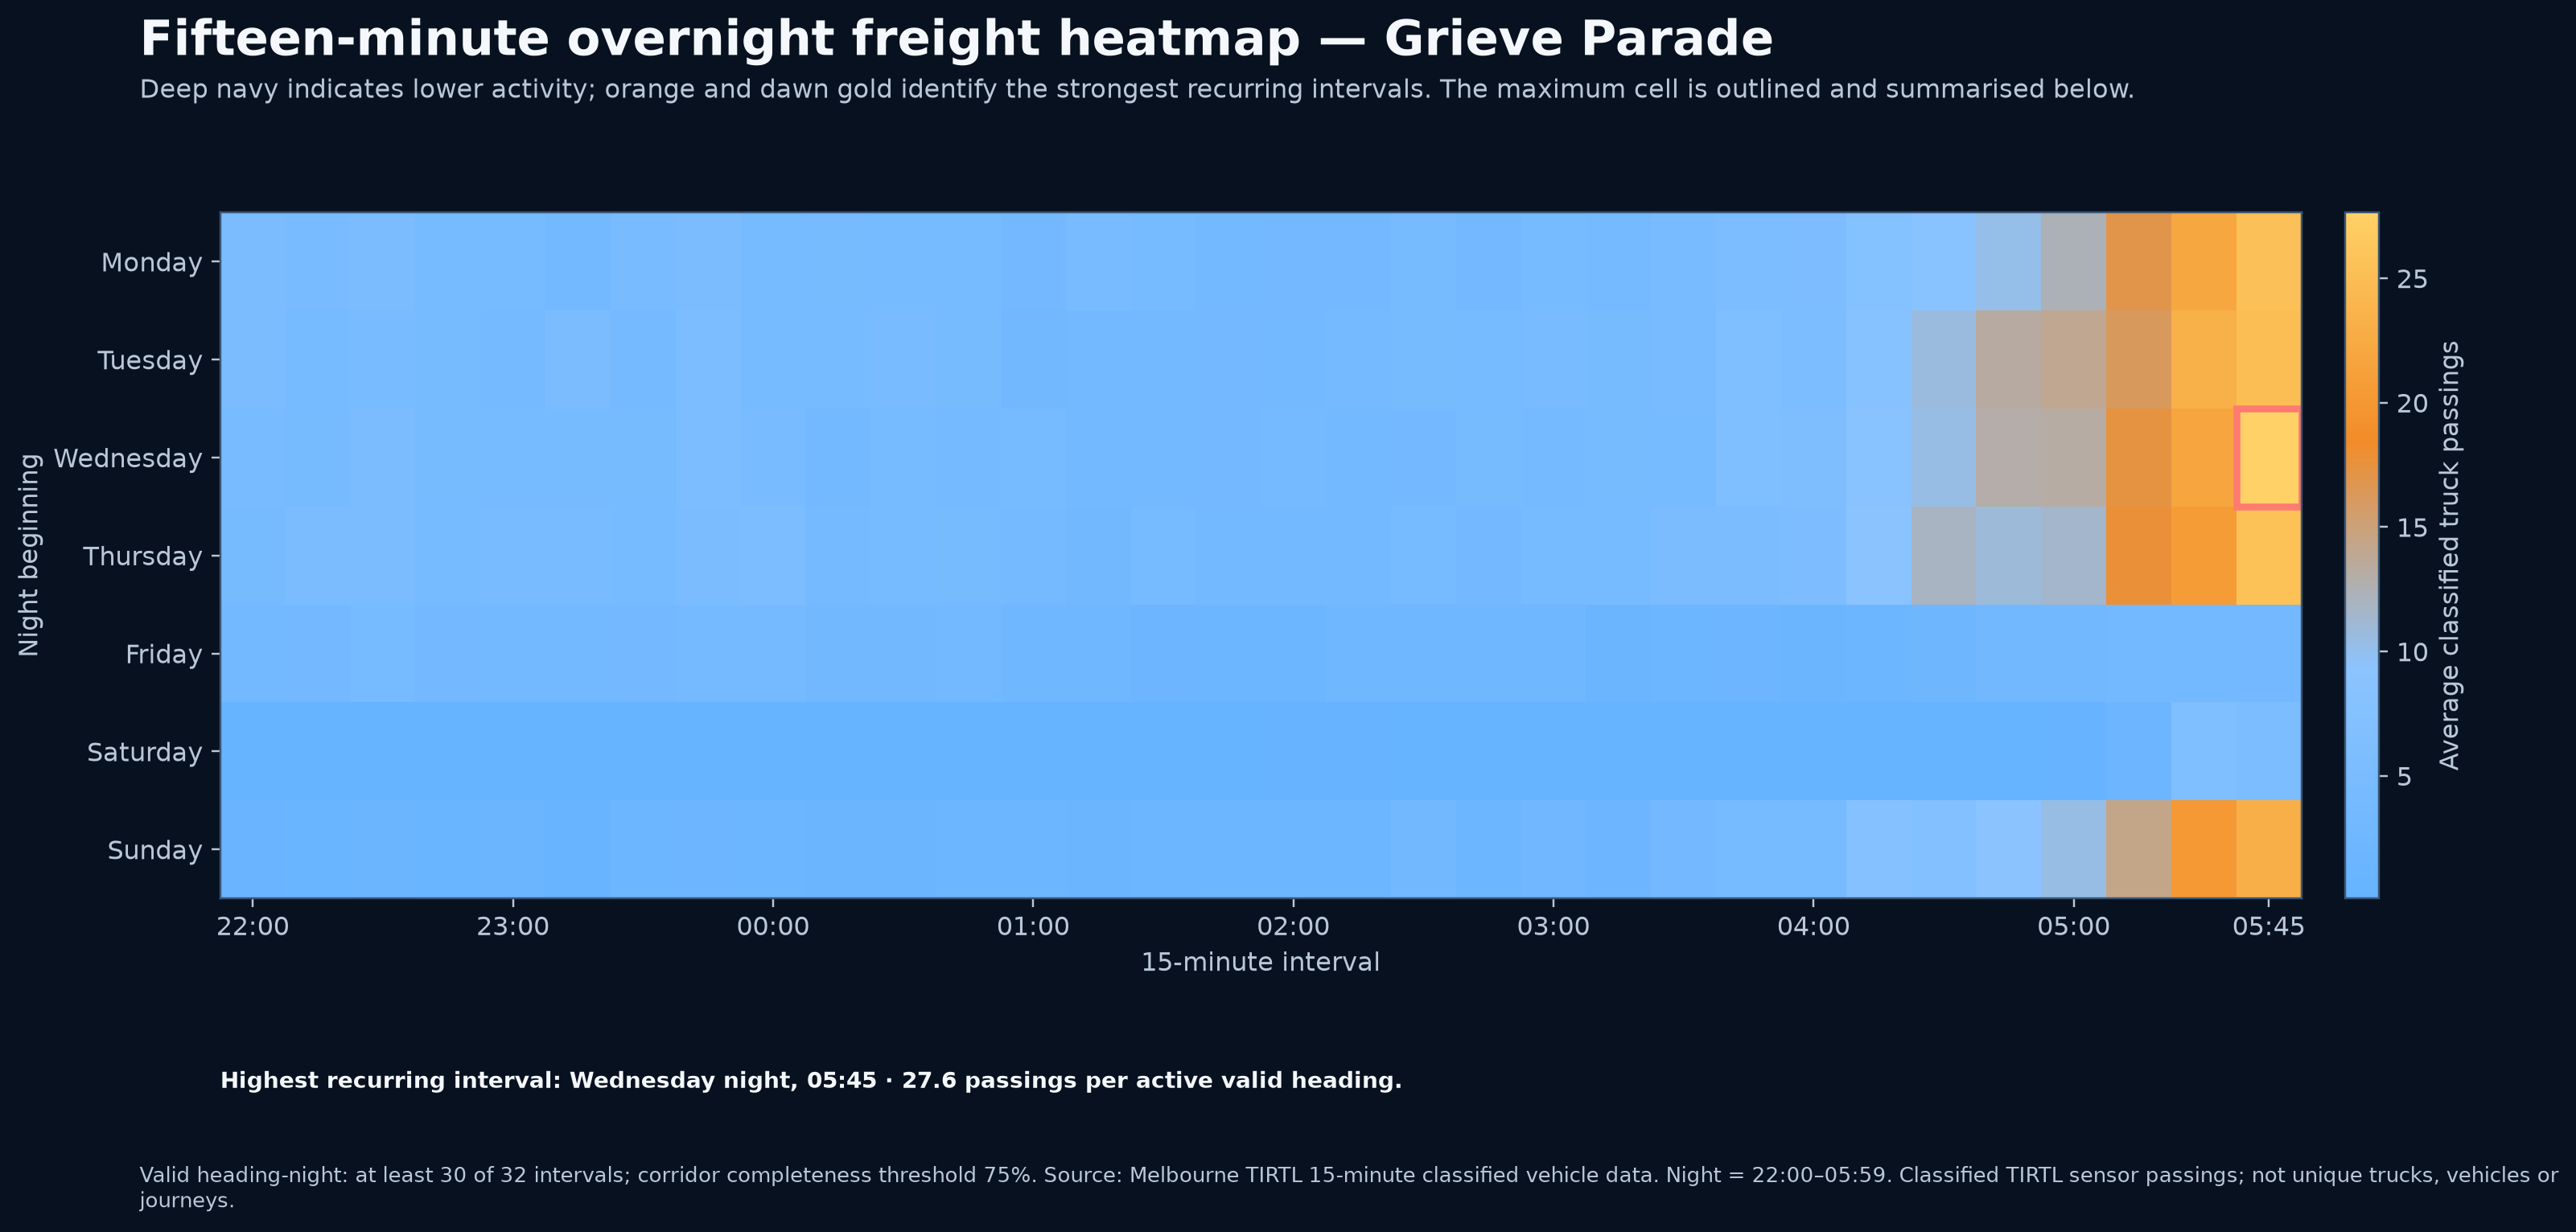
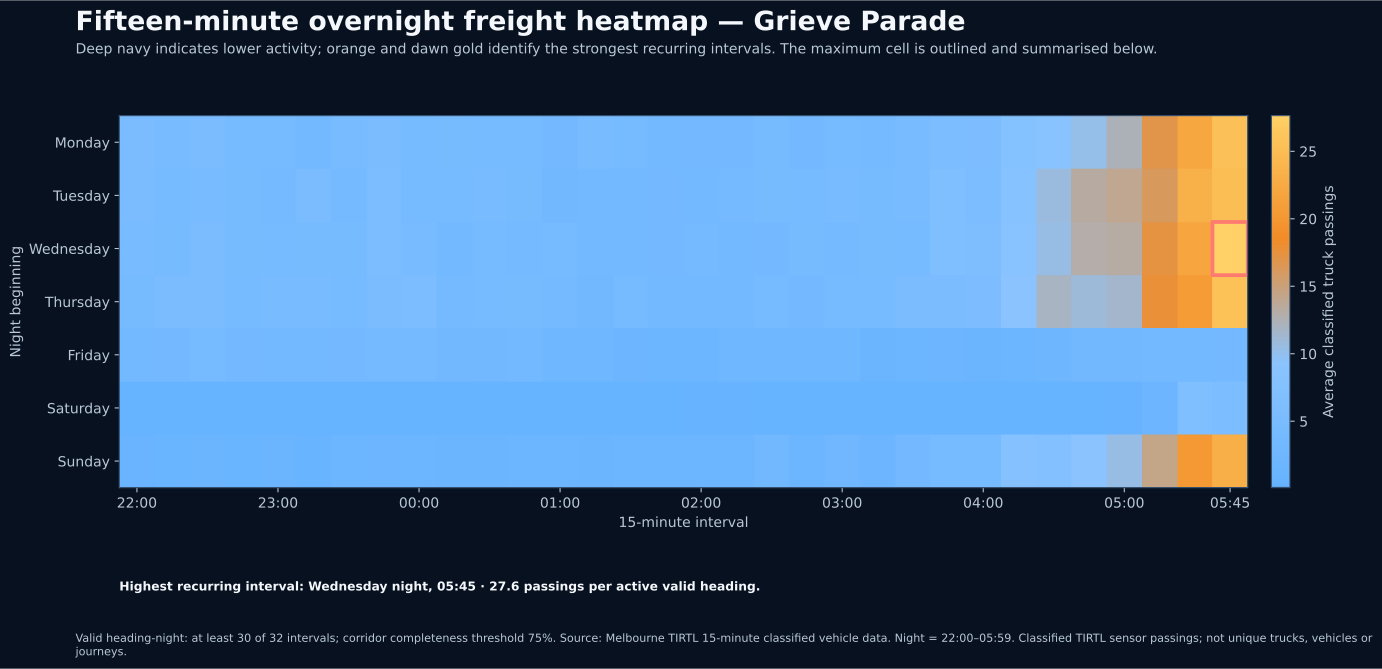
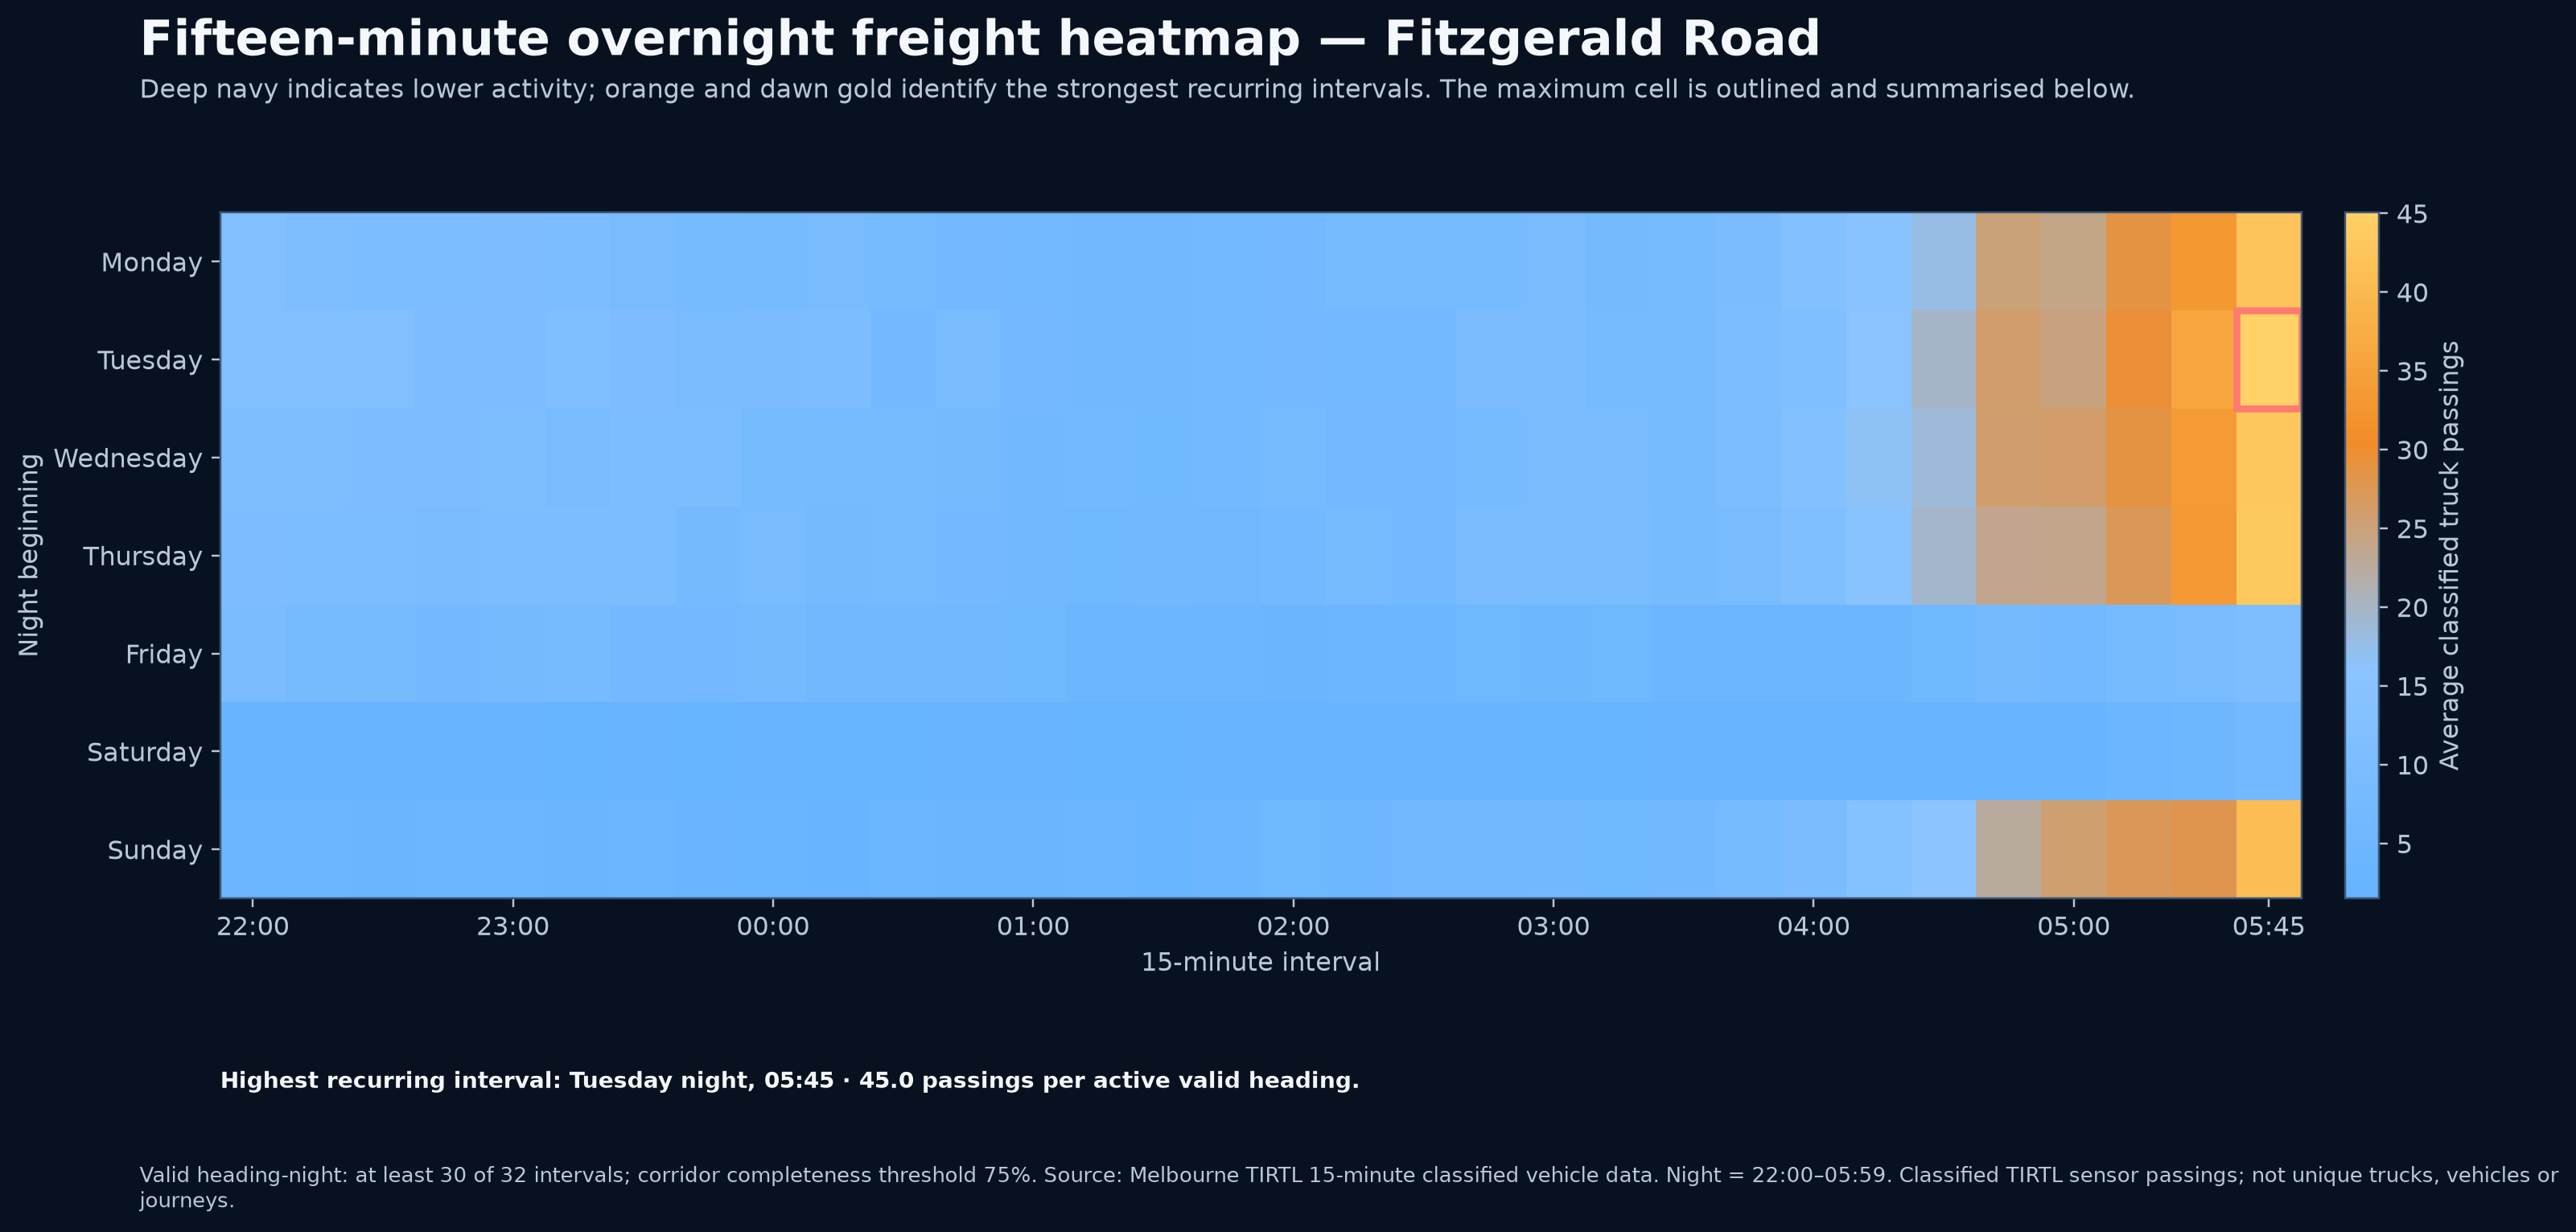
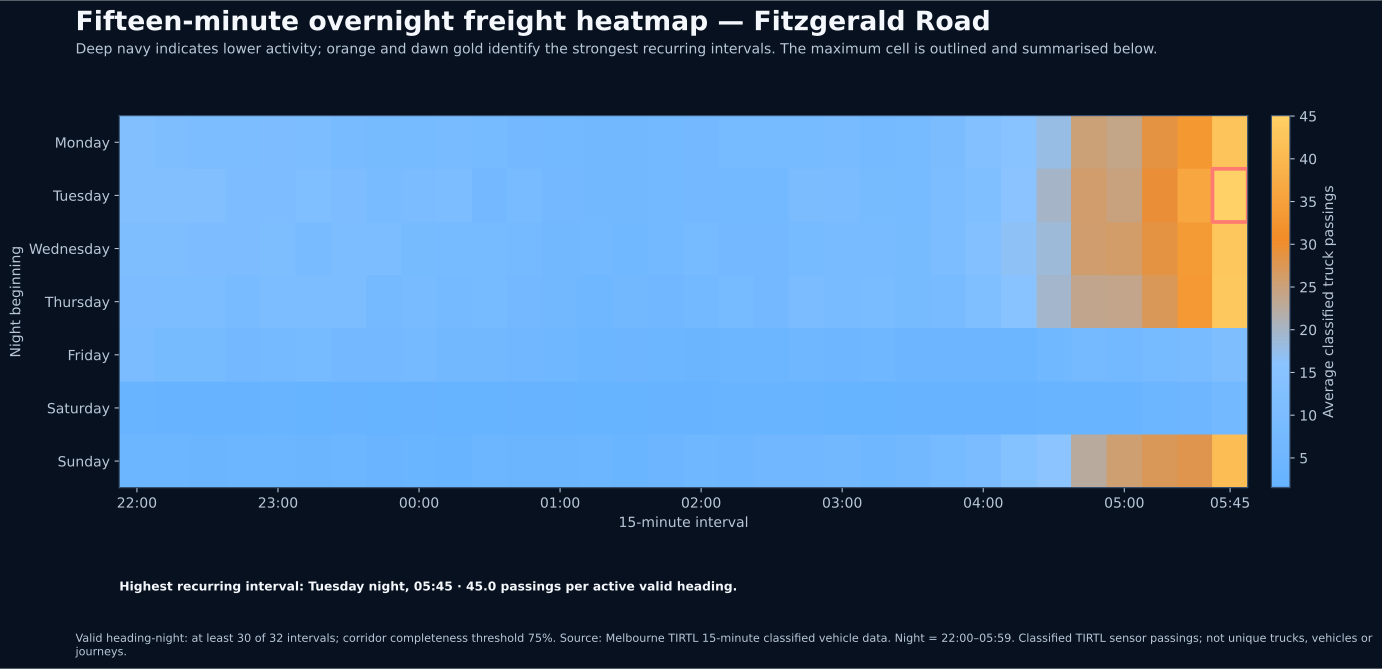
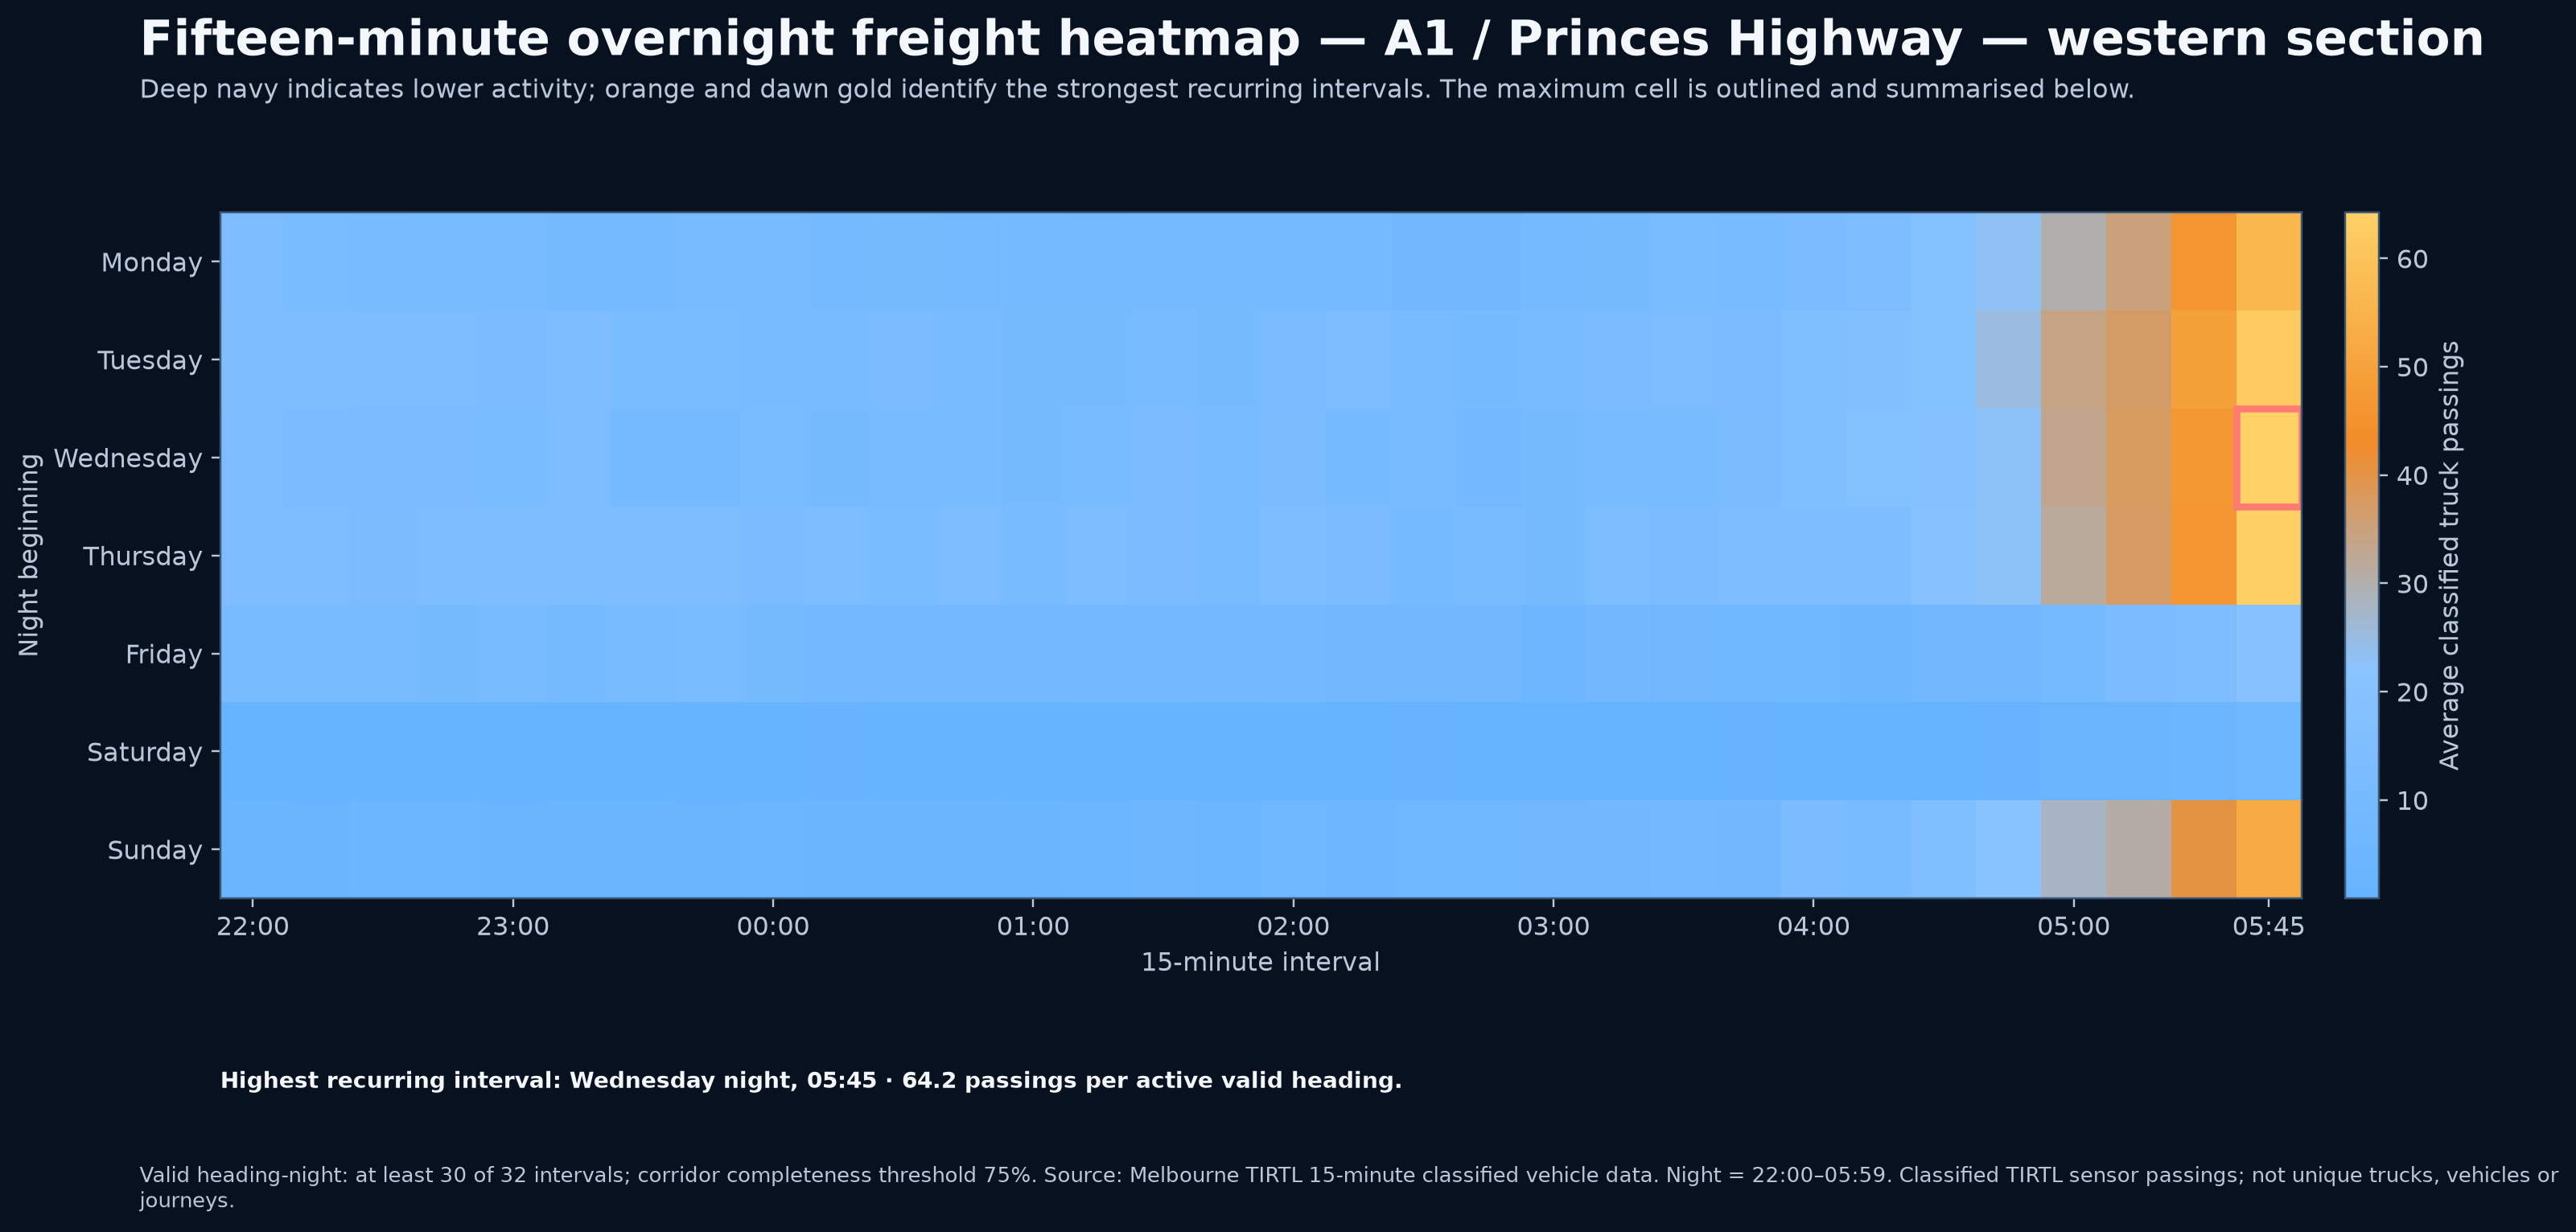
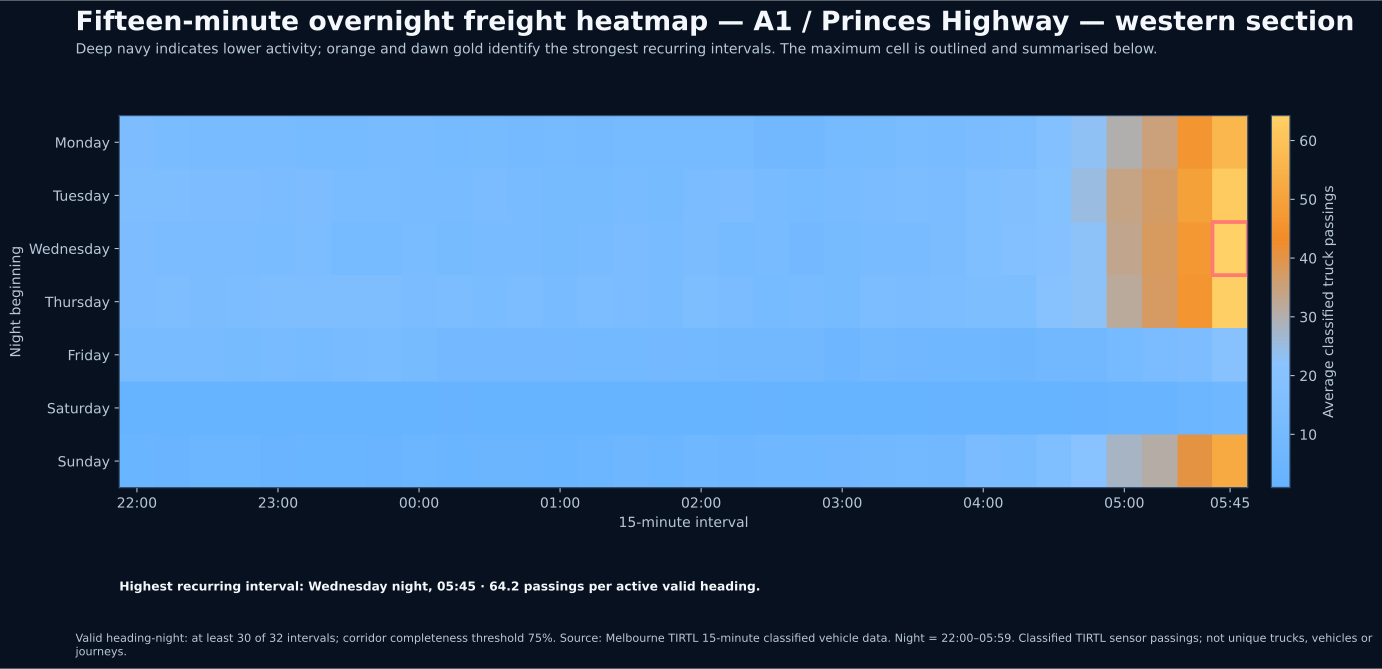
Publication-ready political and analytical graphics generated from valid-night TIRTL data. Truck figures are classified sensor passings, not unique trucks or journeys.
Reporting period: 2025-10-31 to 2026-05-22Theme: night42 graphs generated
Graph 01A
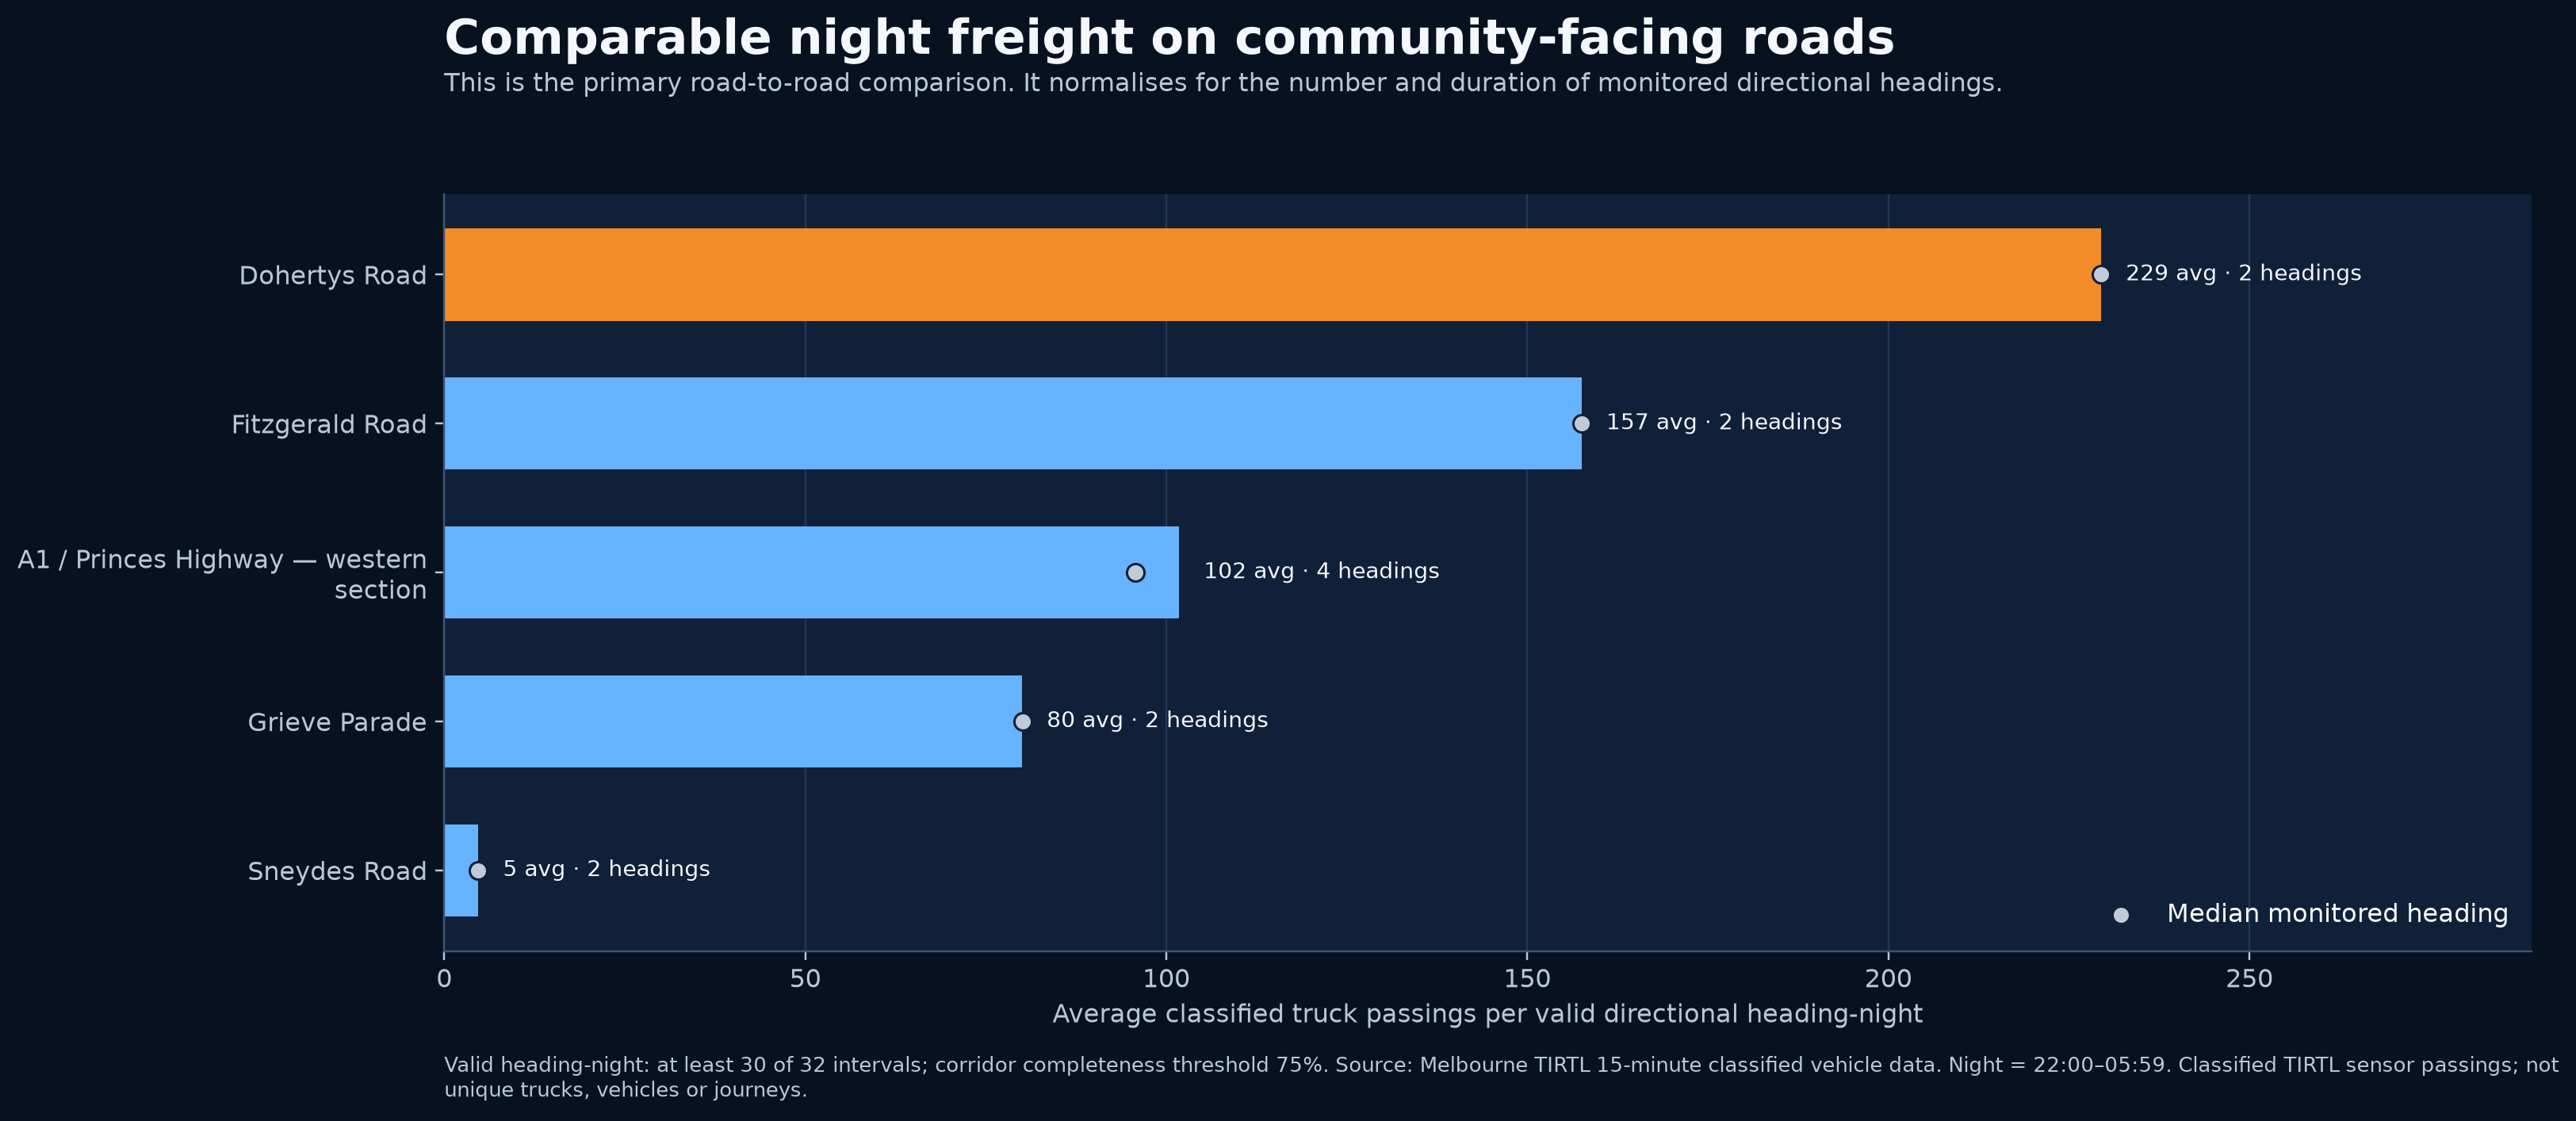
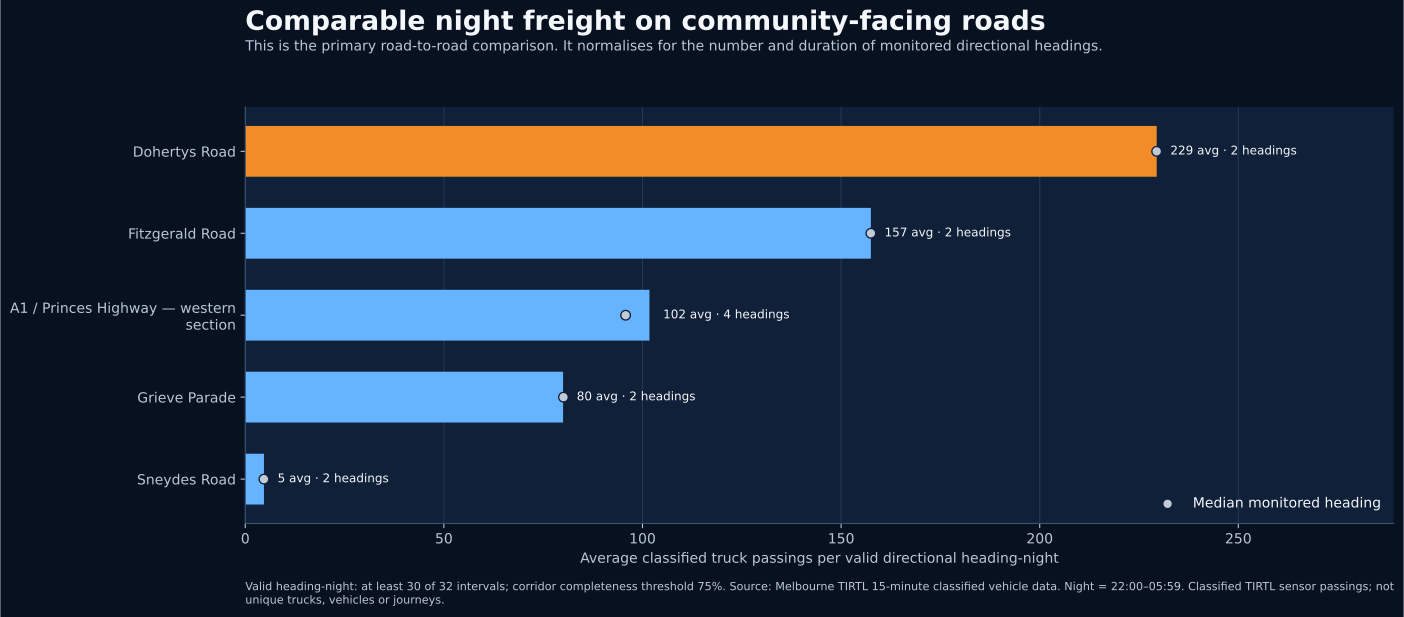
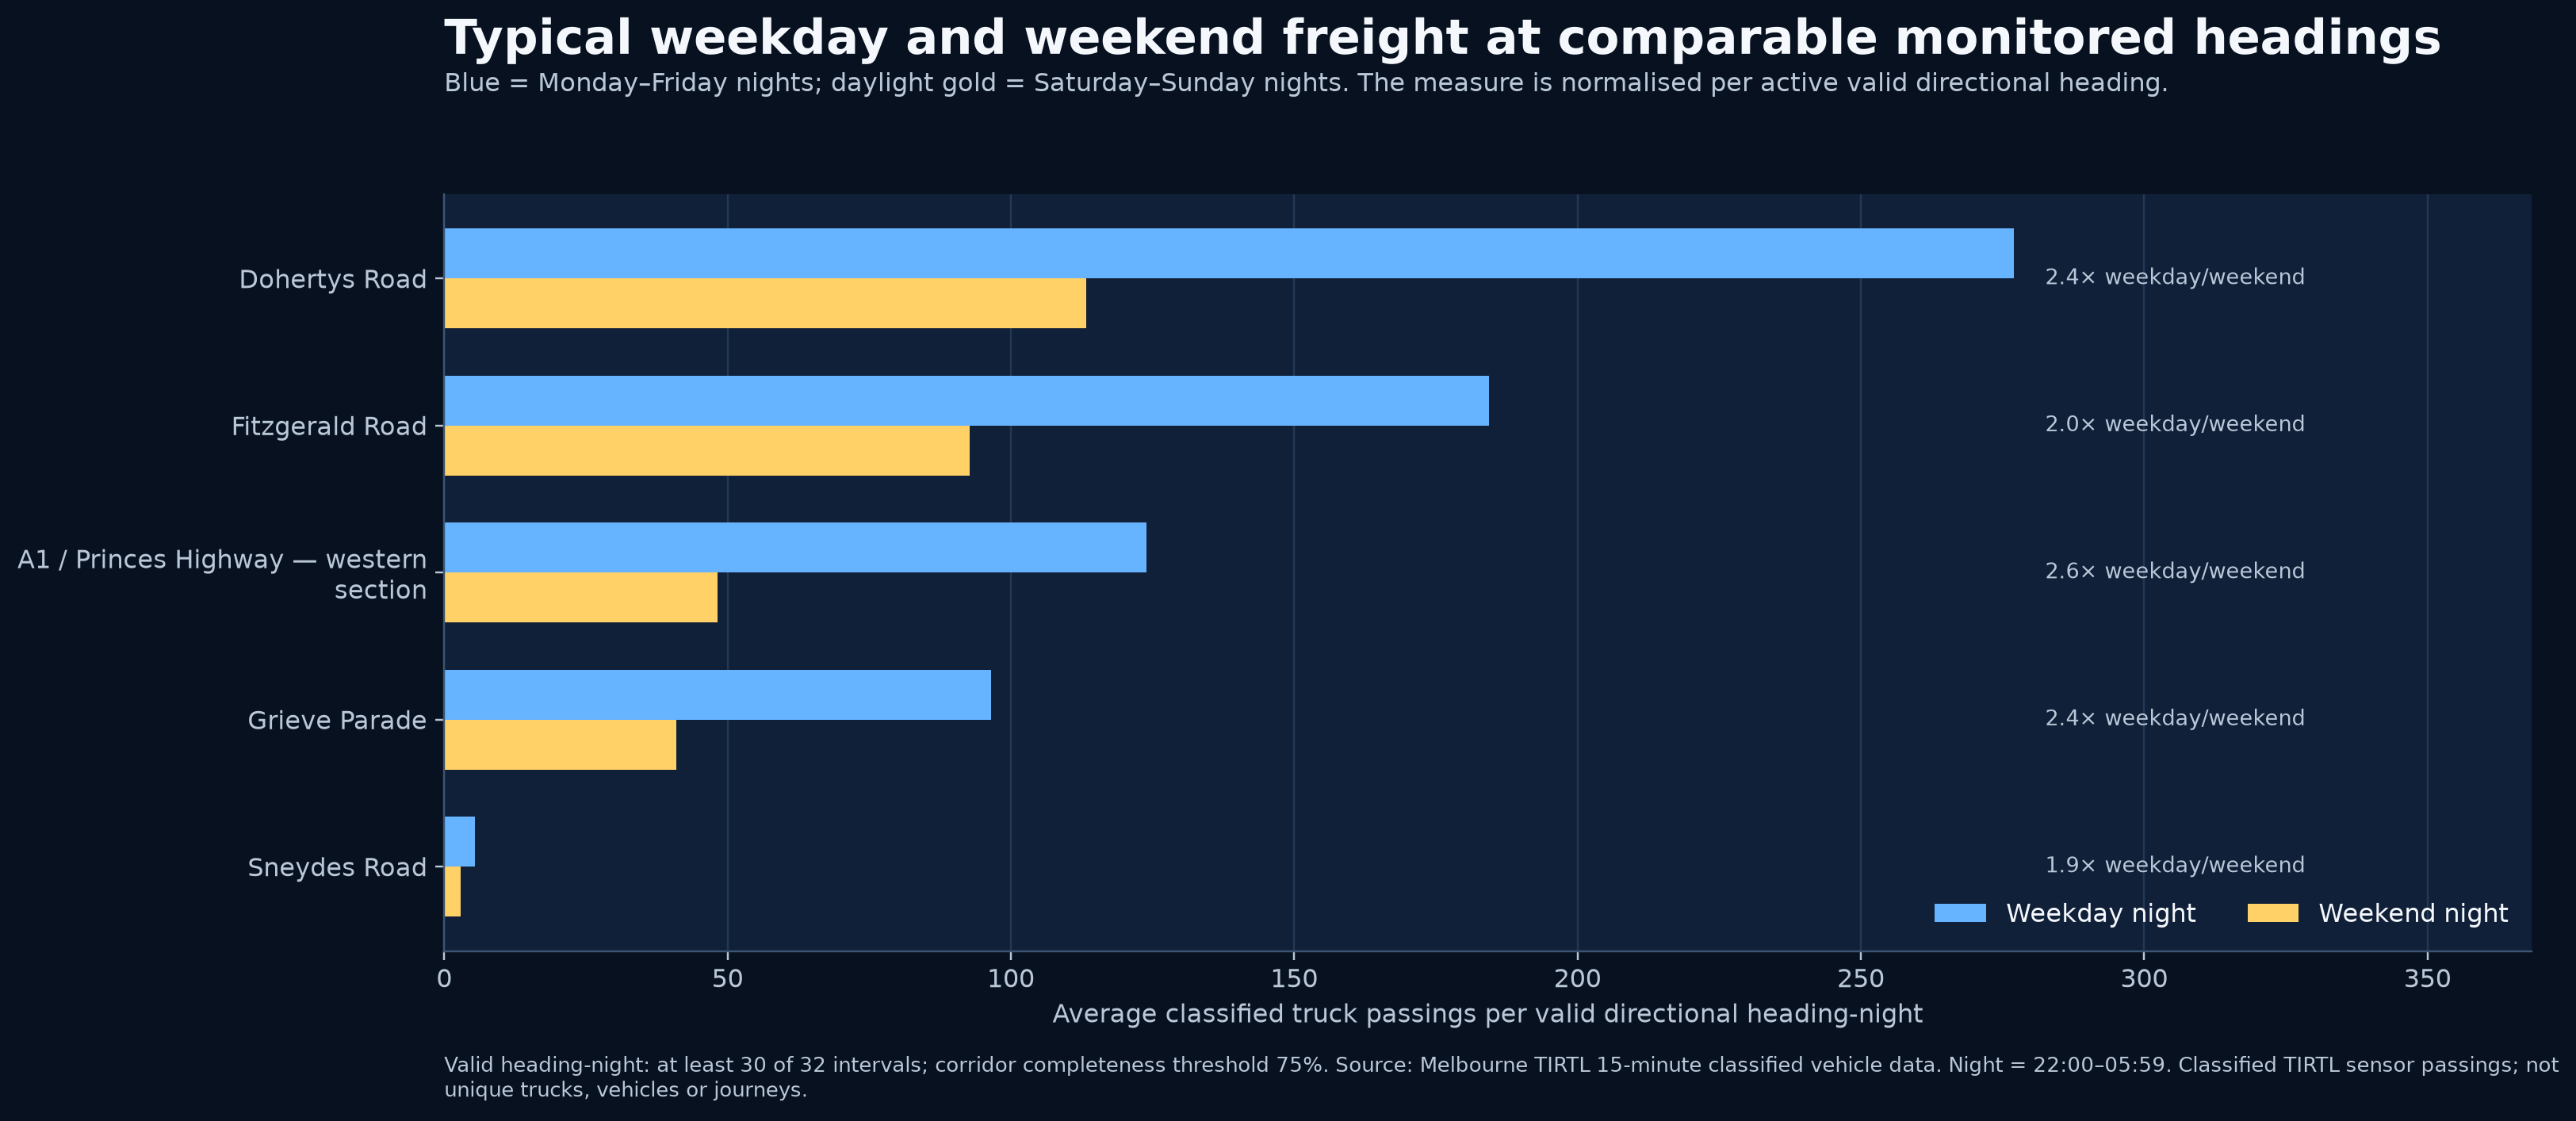
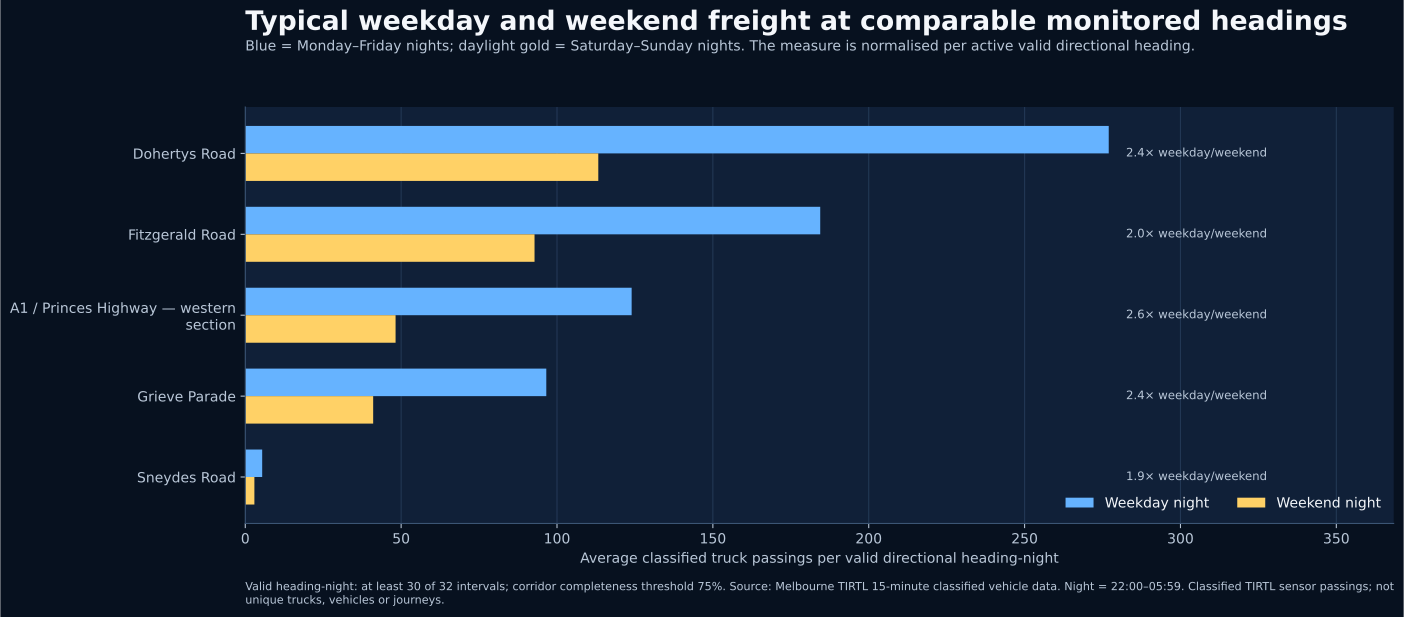
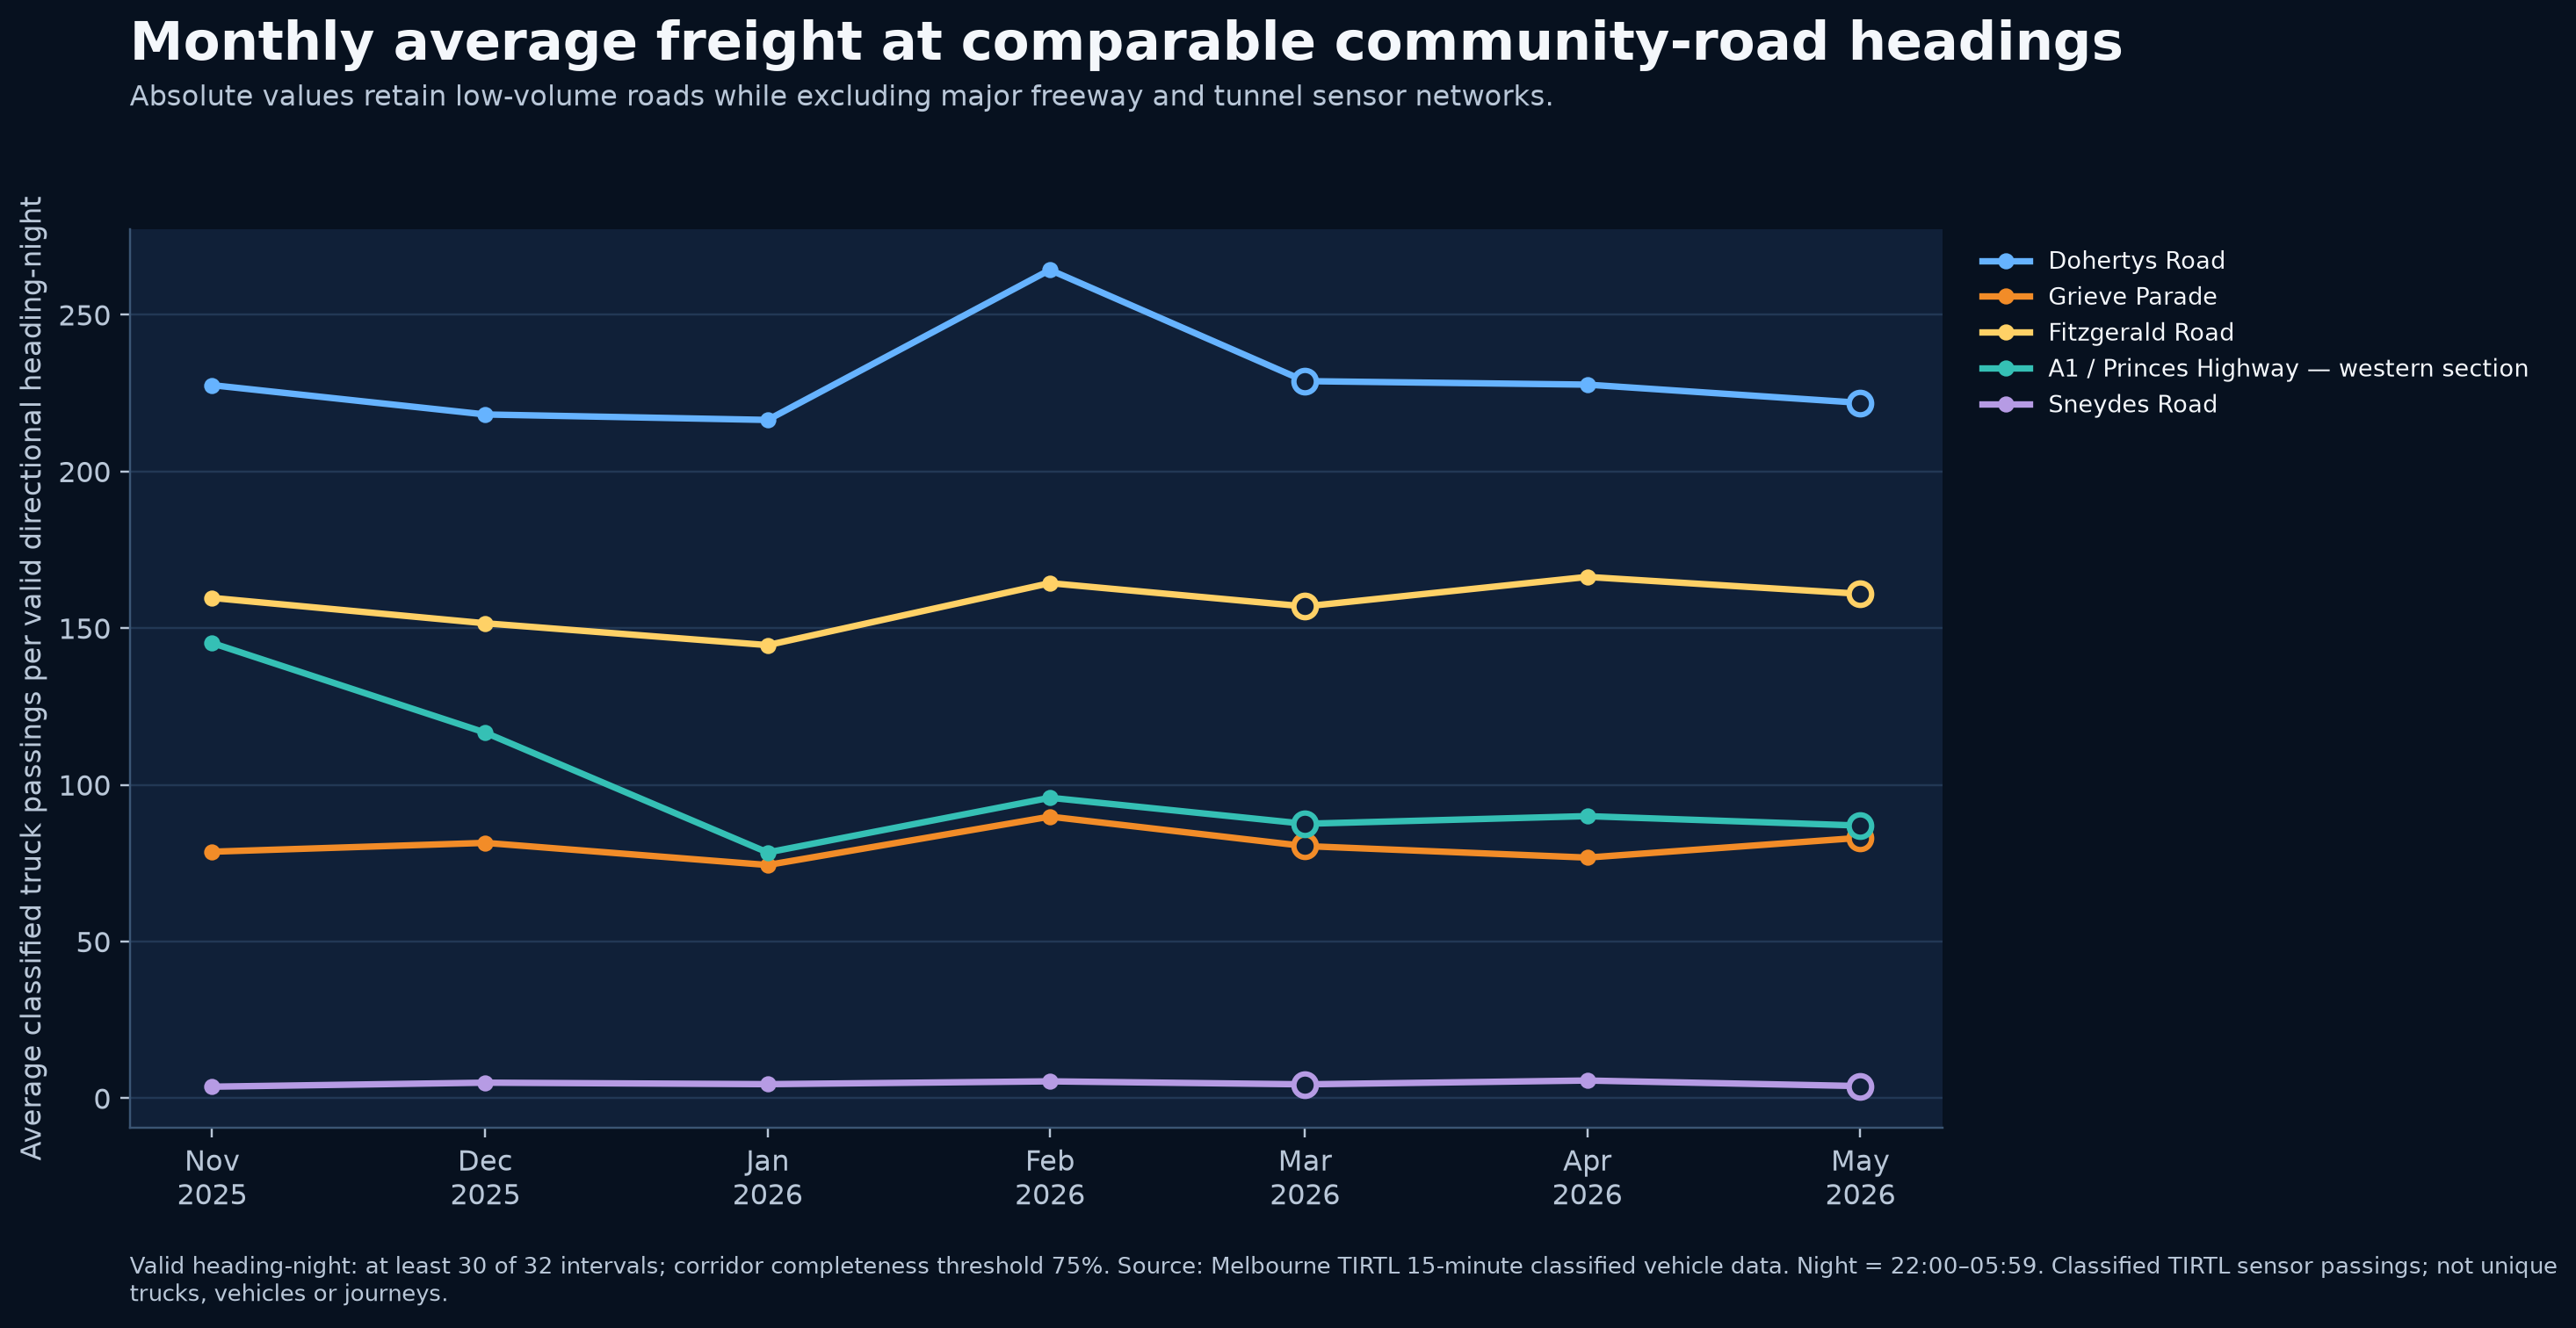
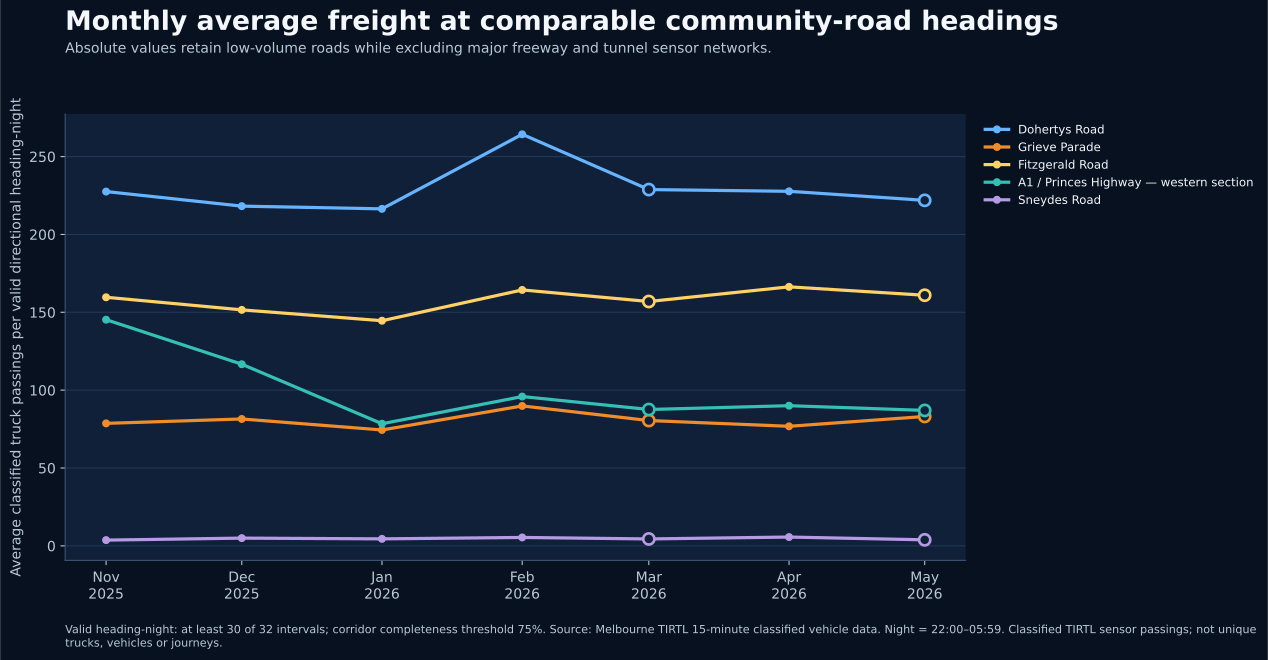
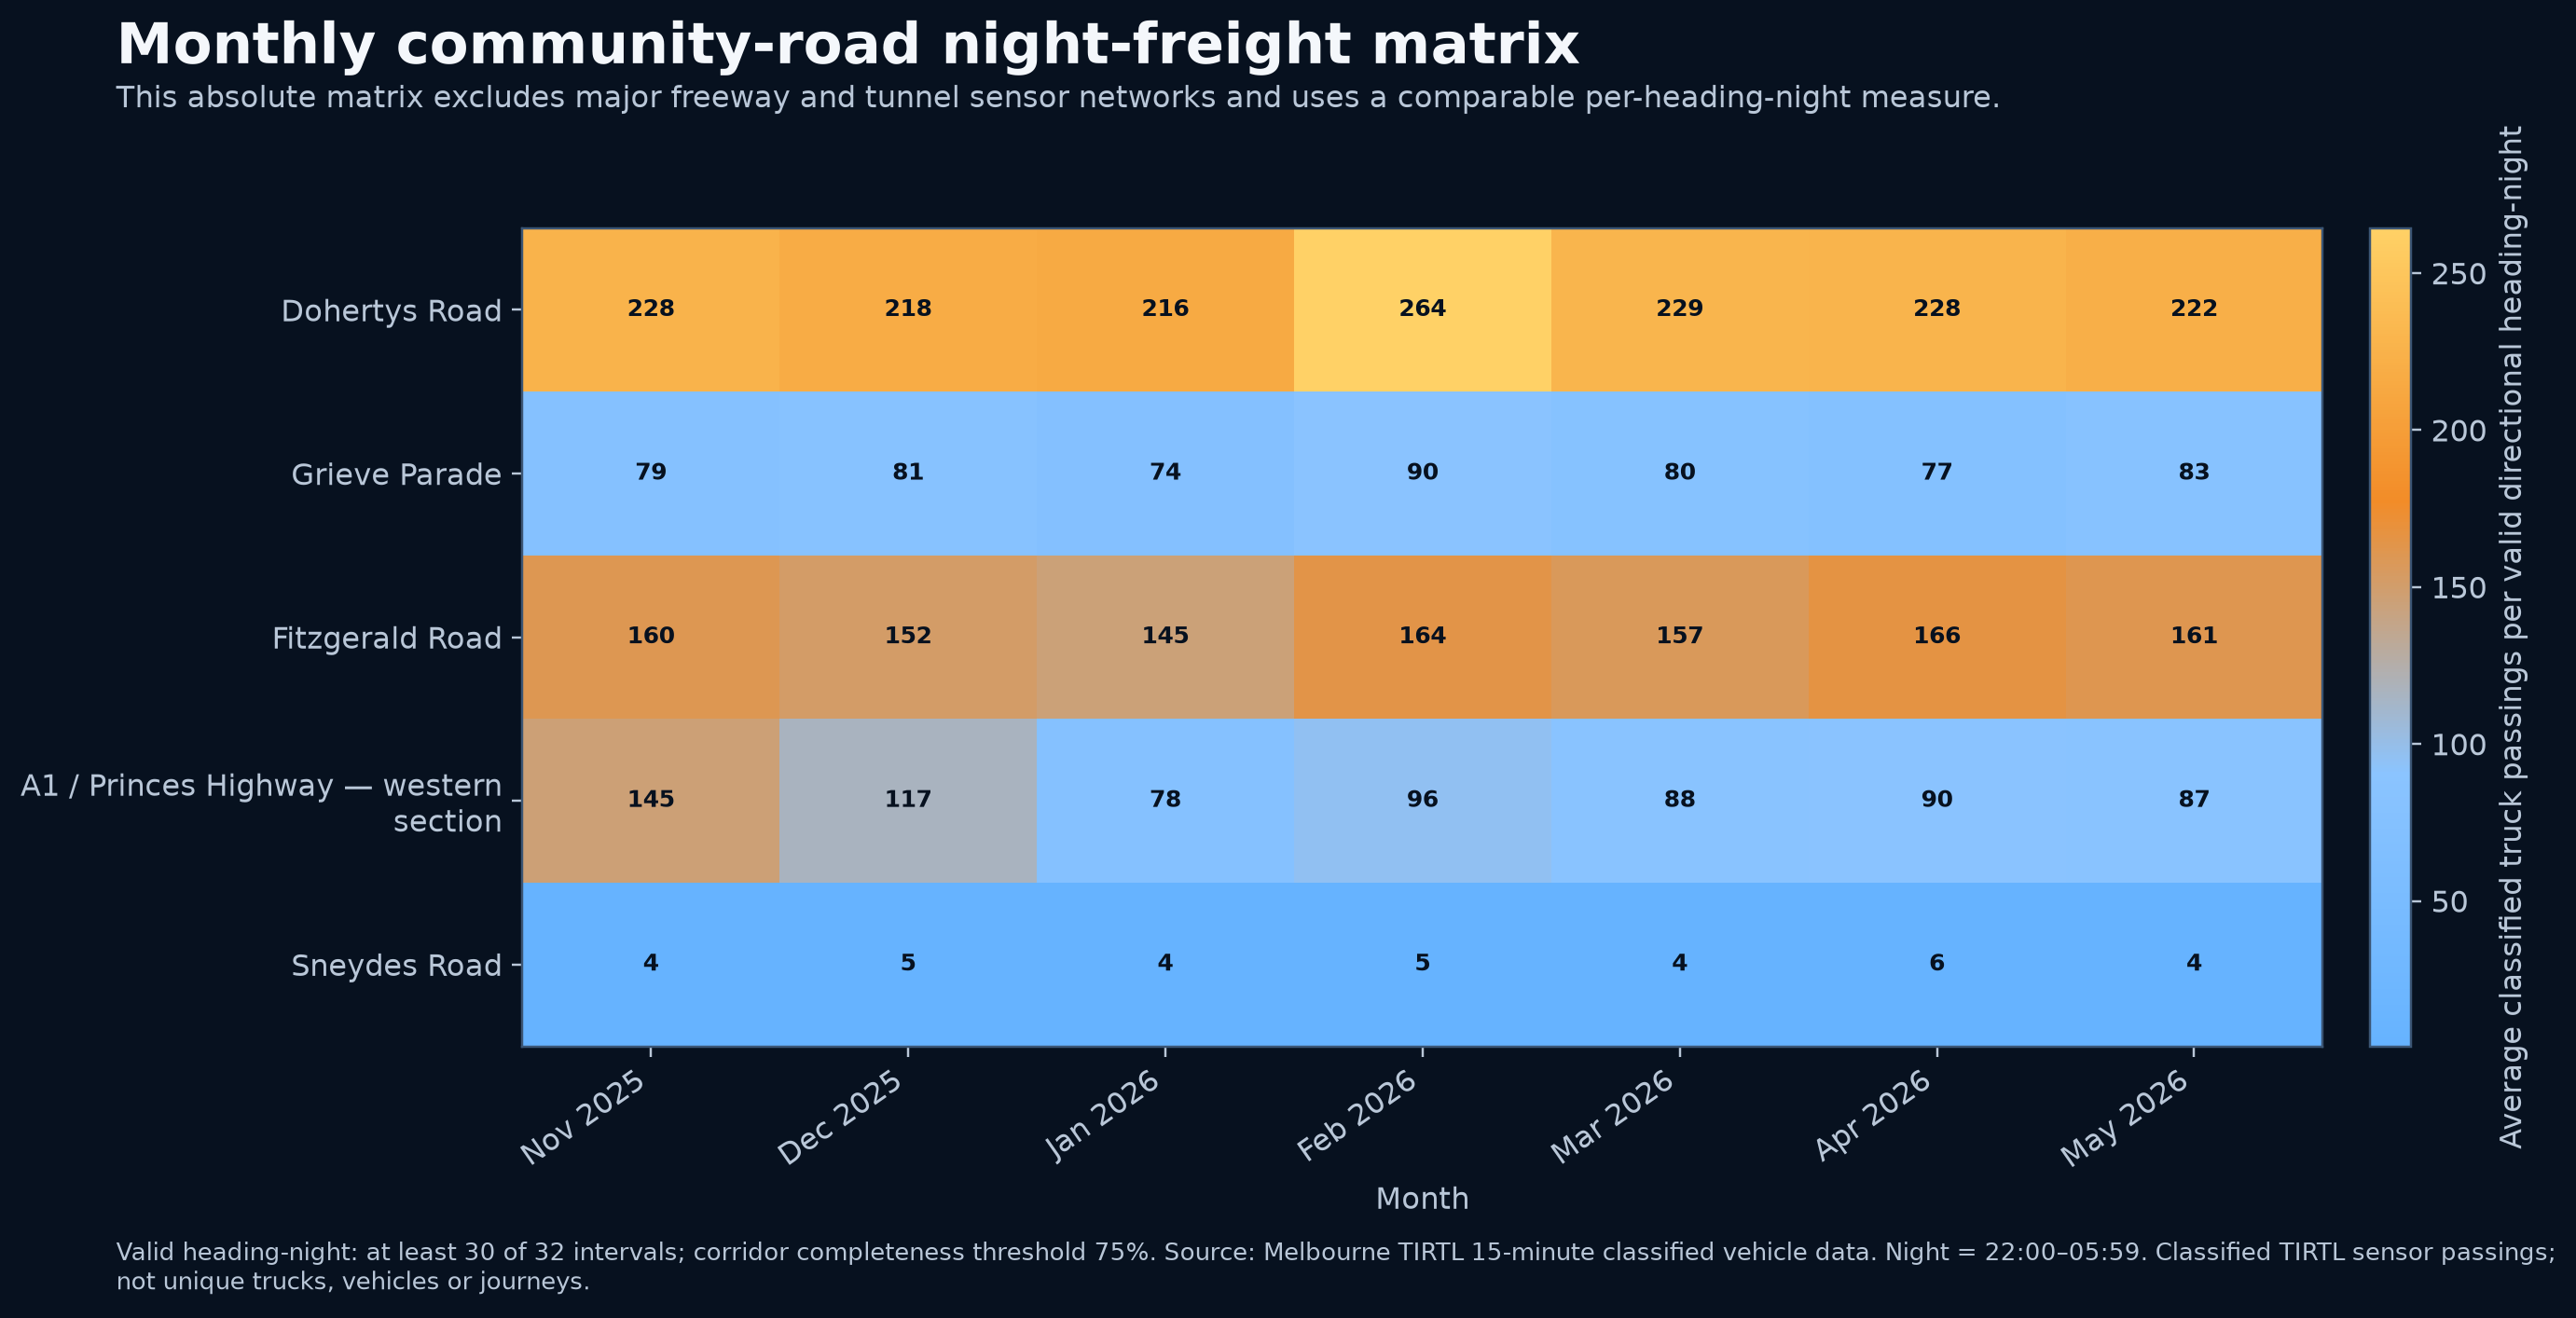
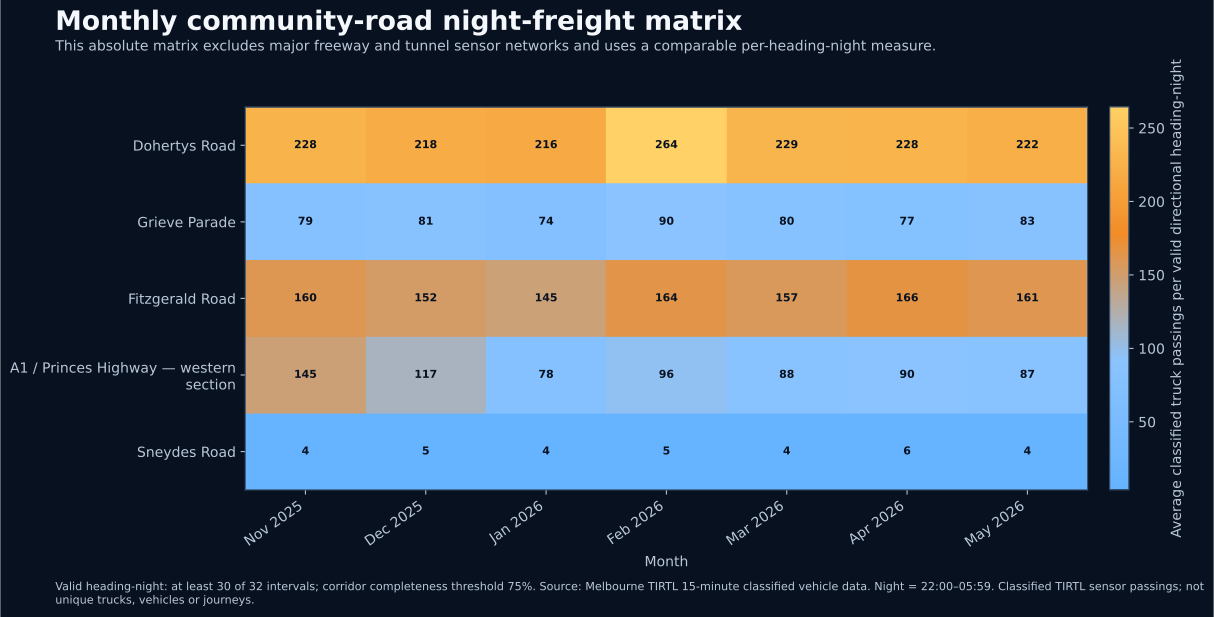
Comparable night freight on community-facing roads
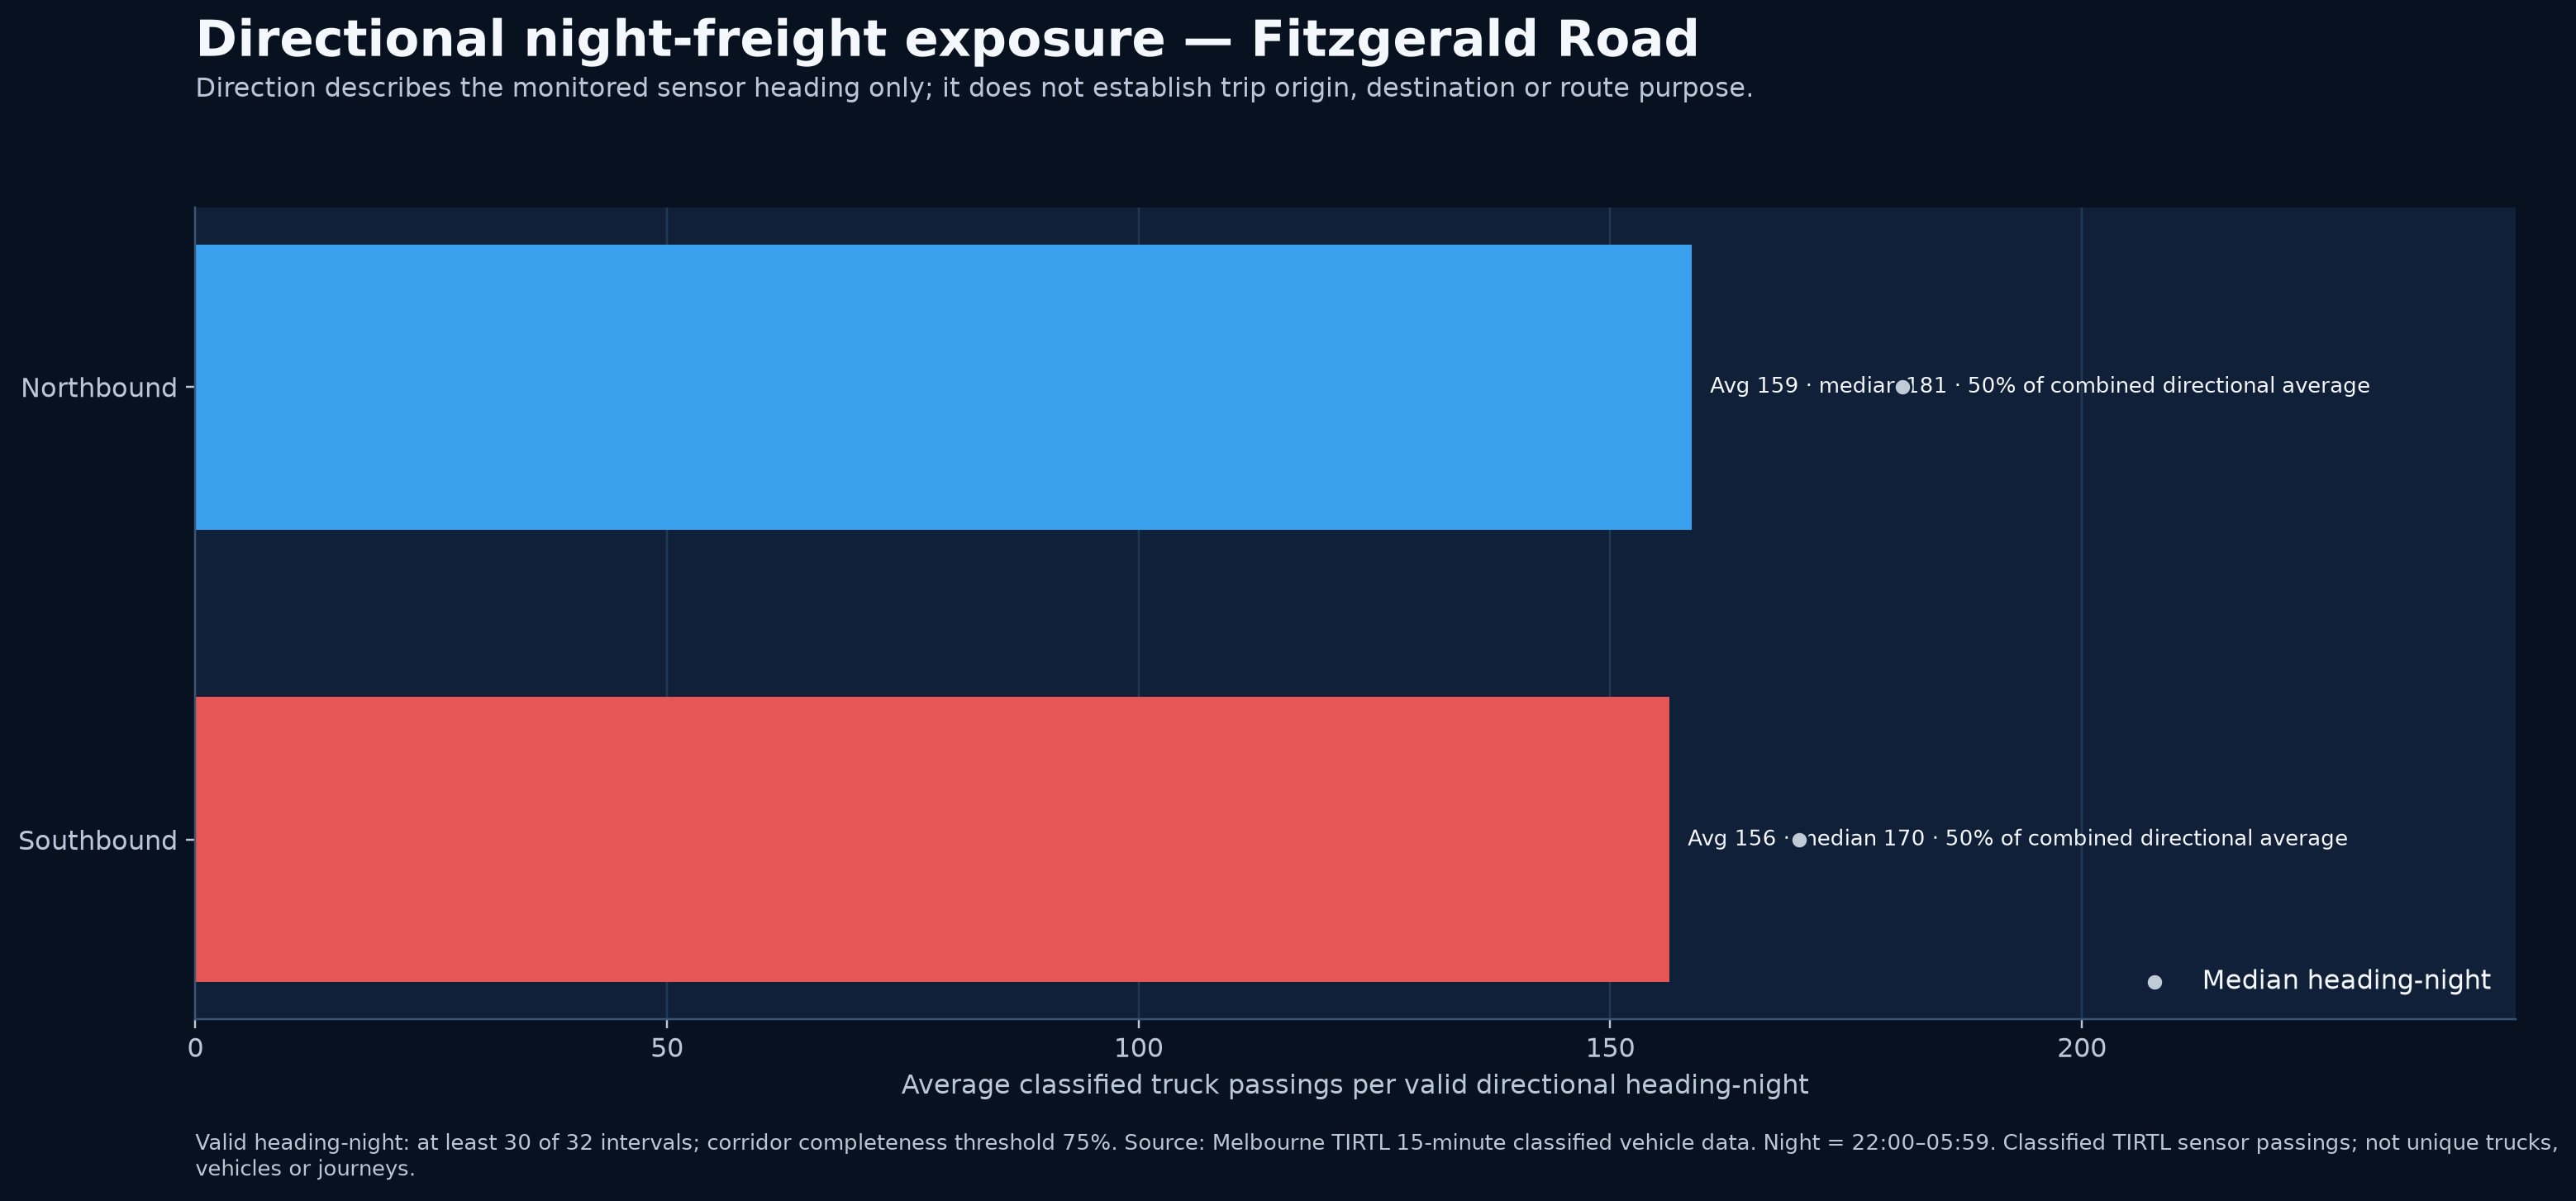
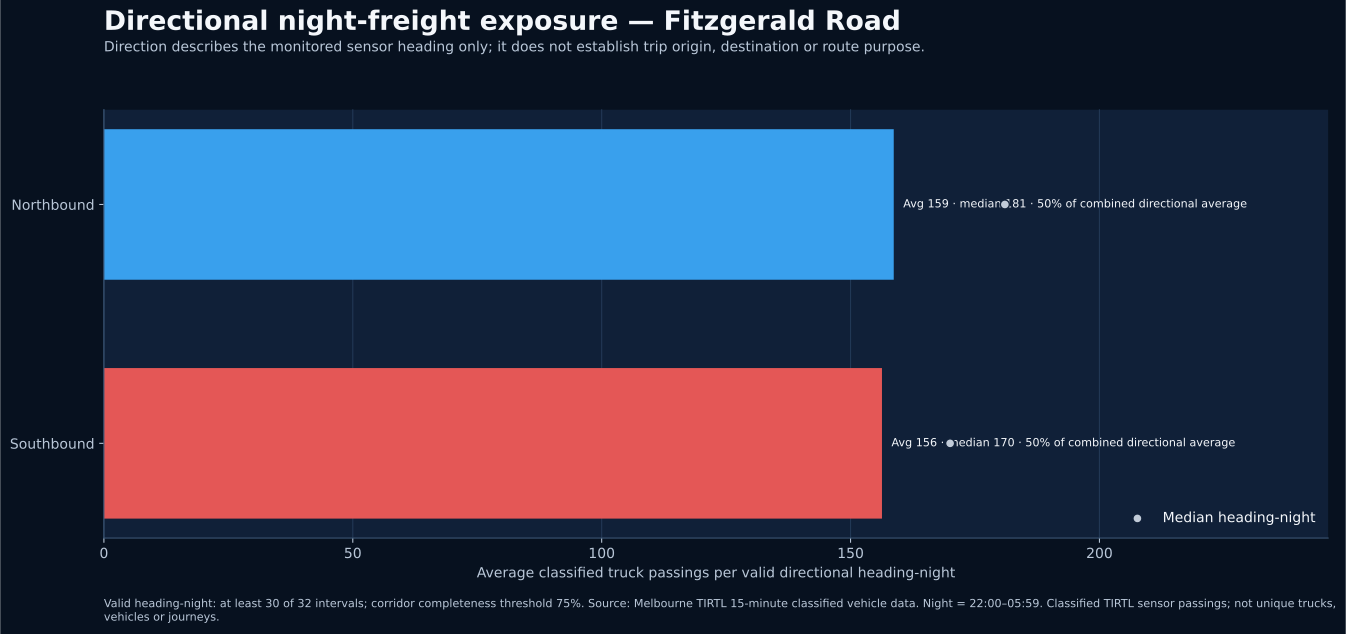
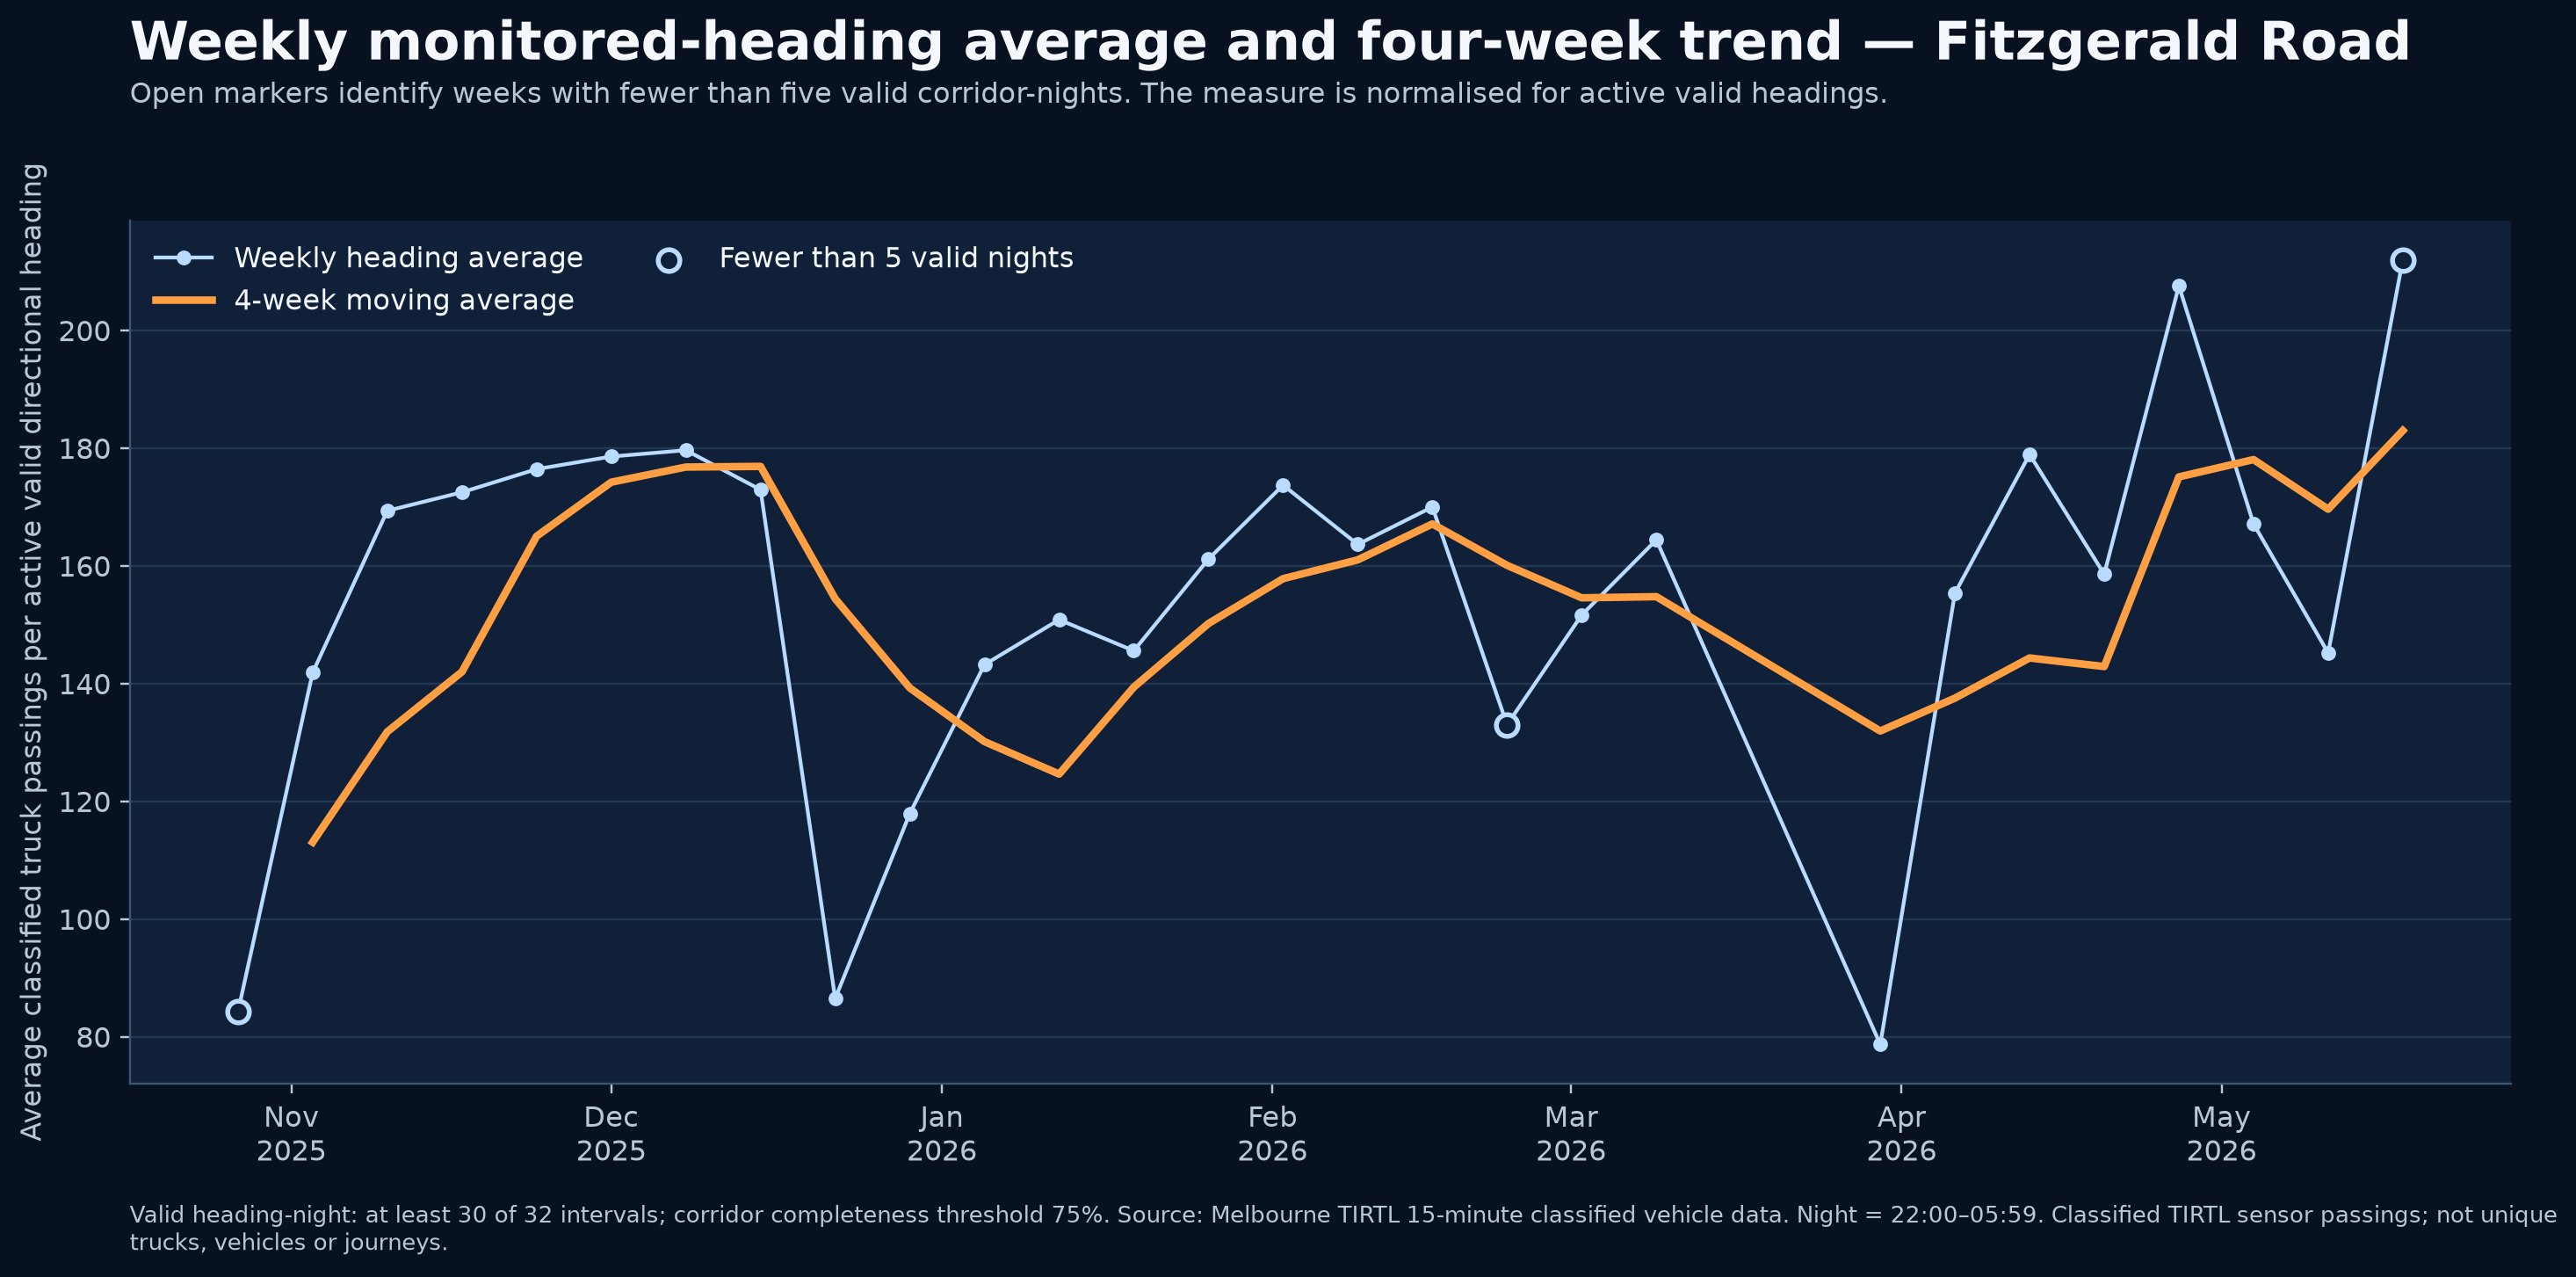
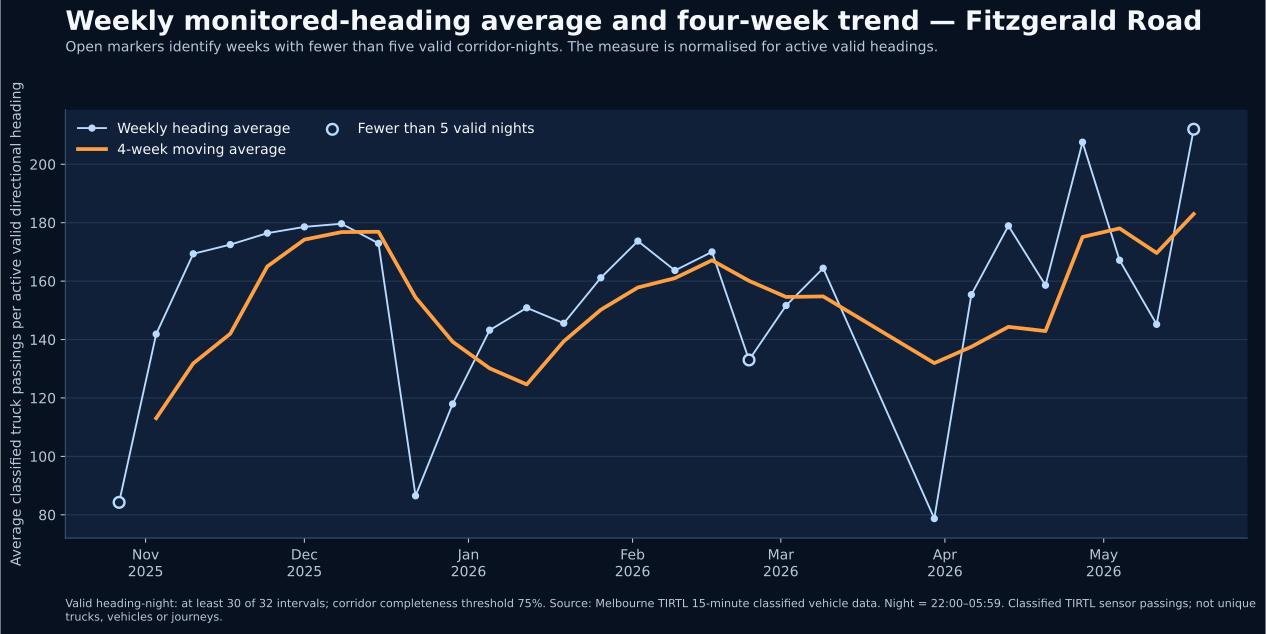
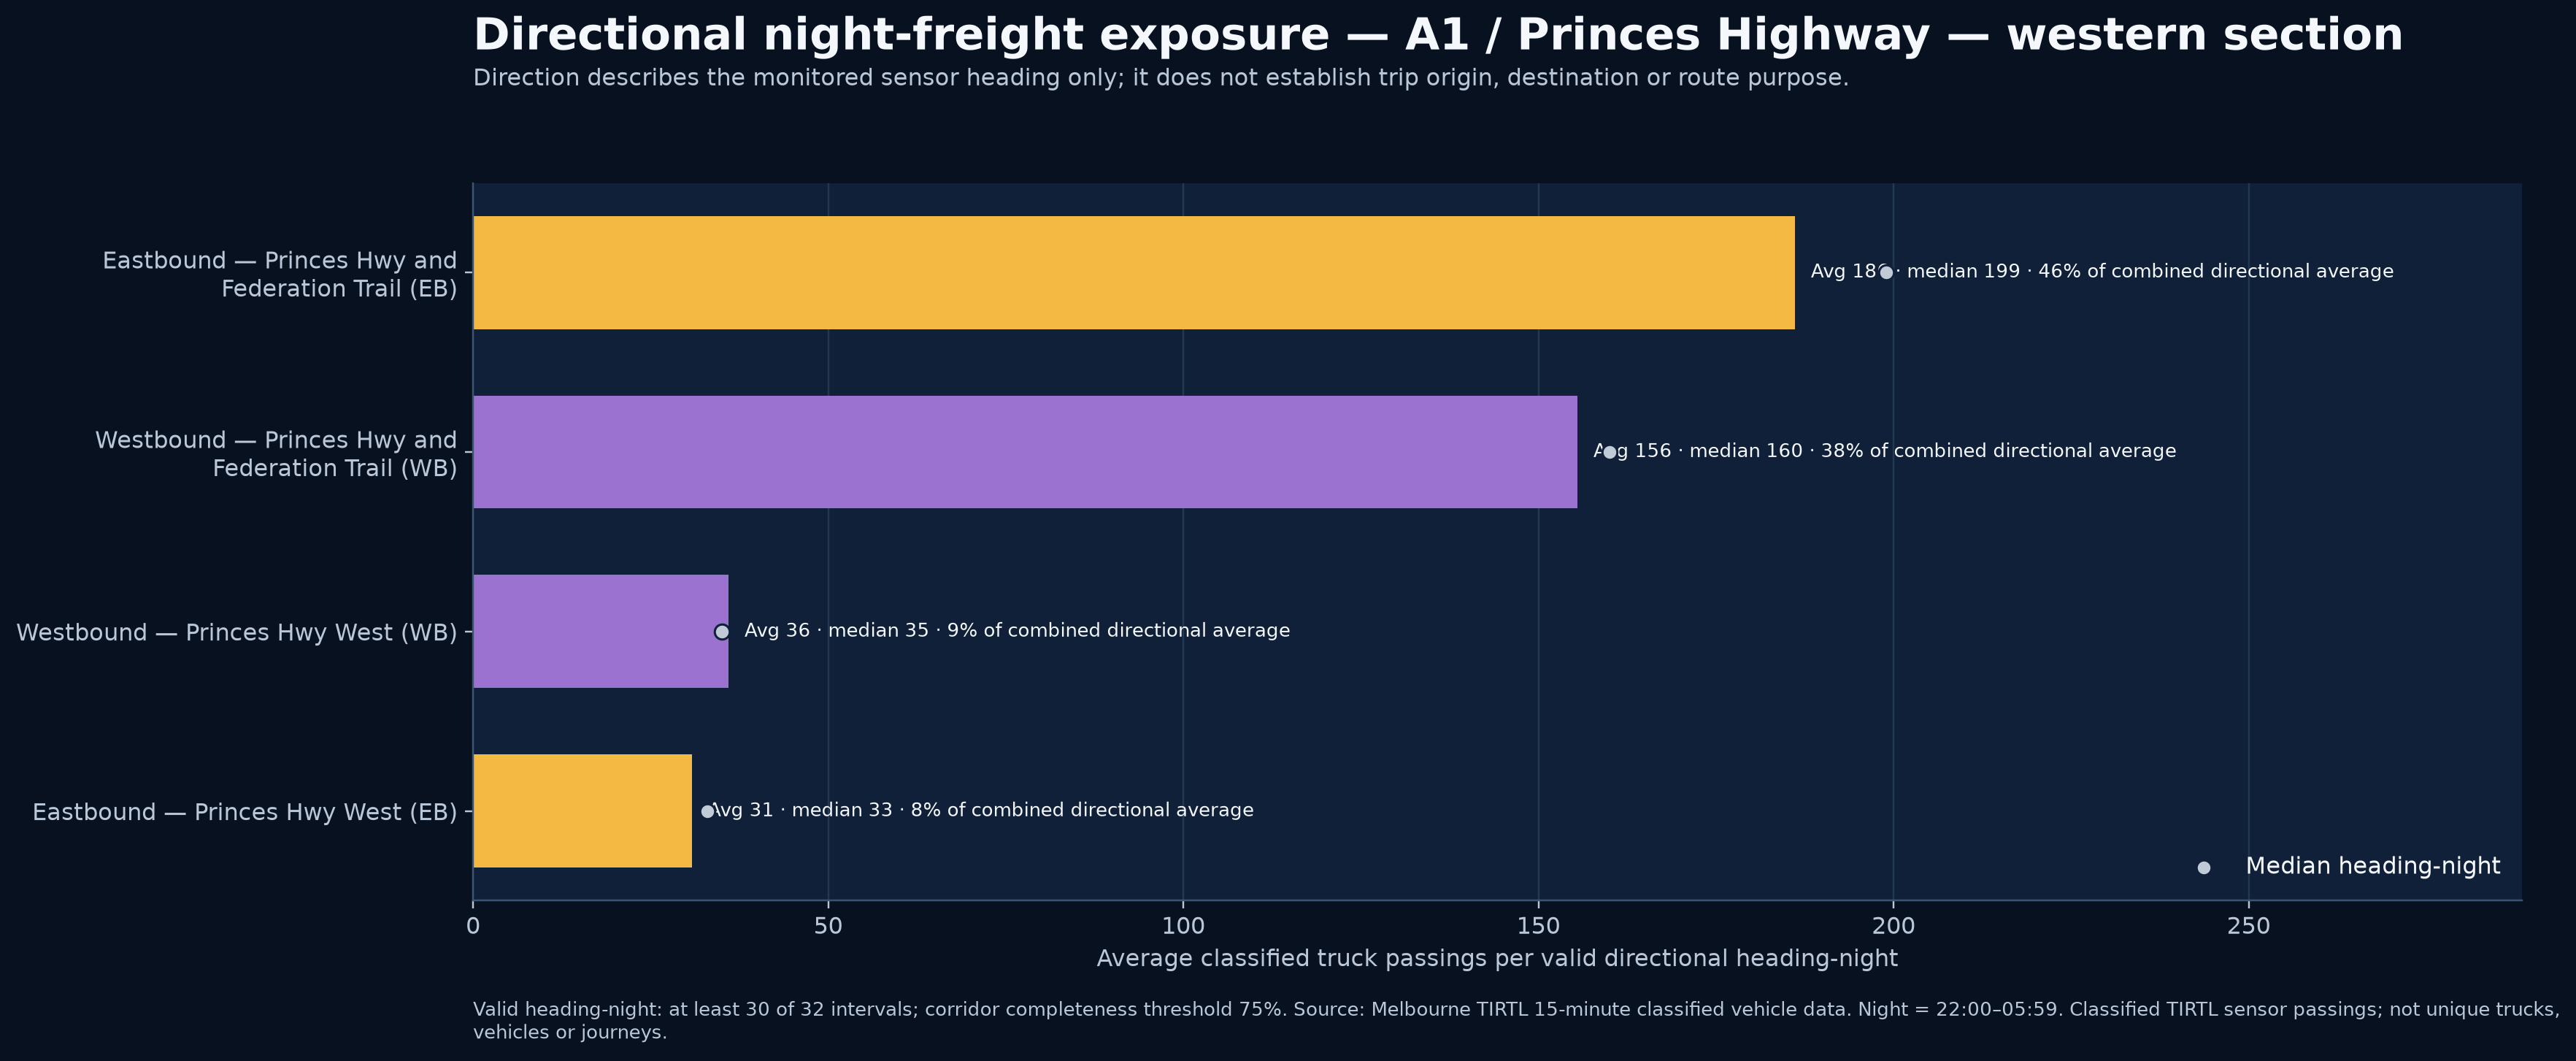
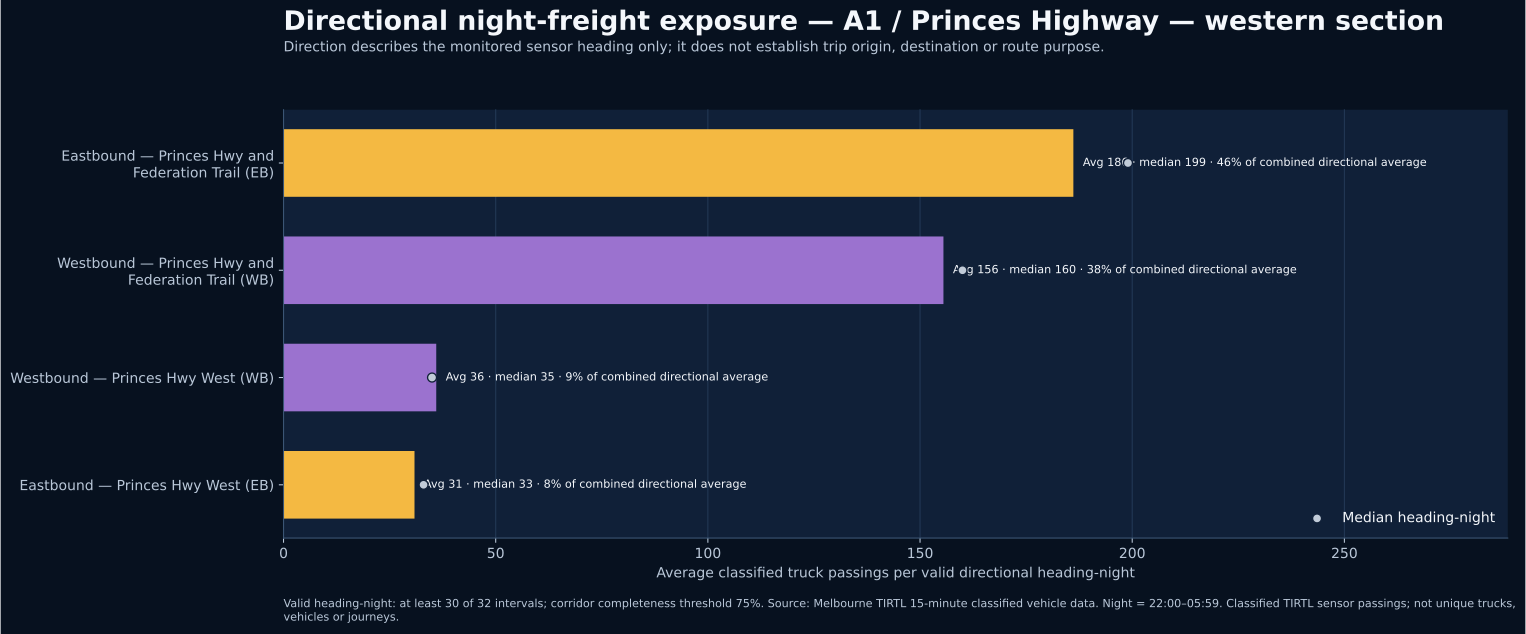
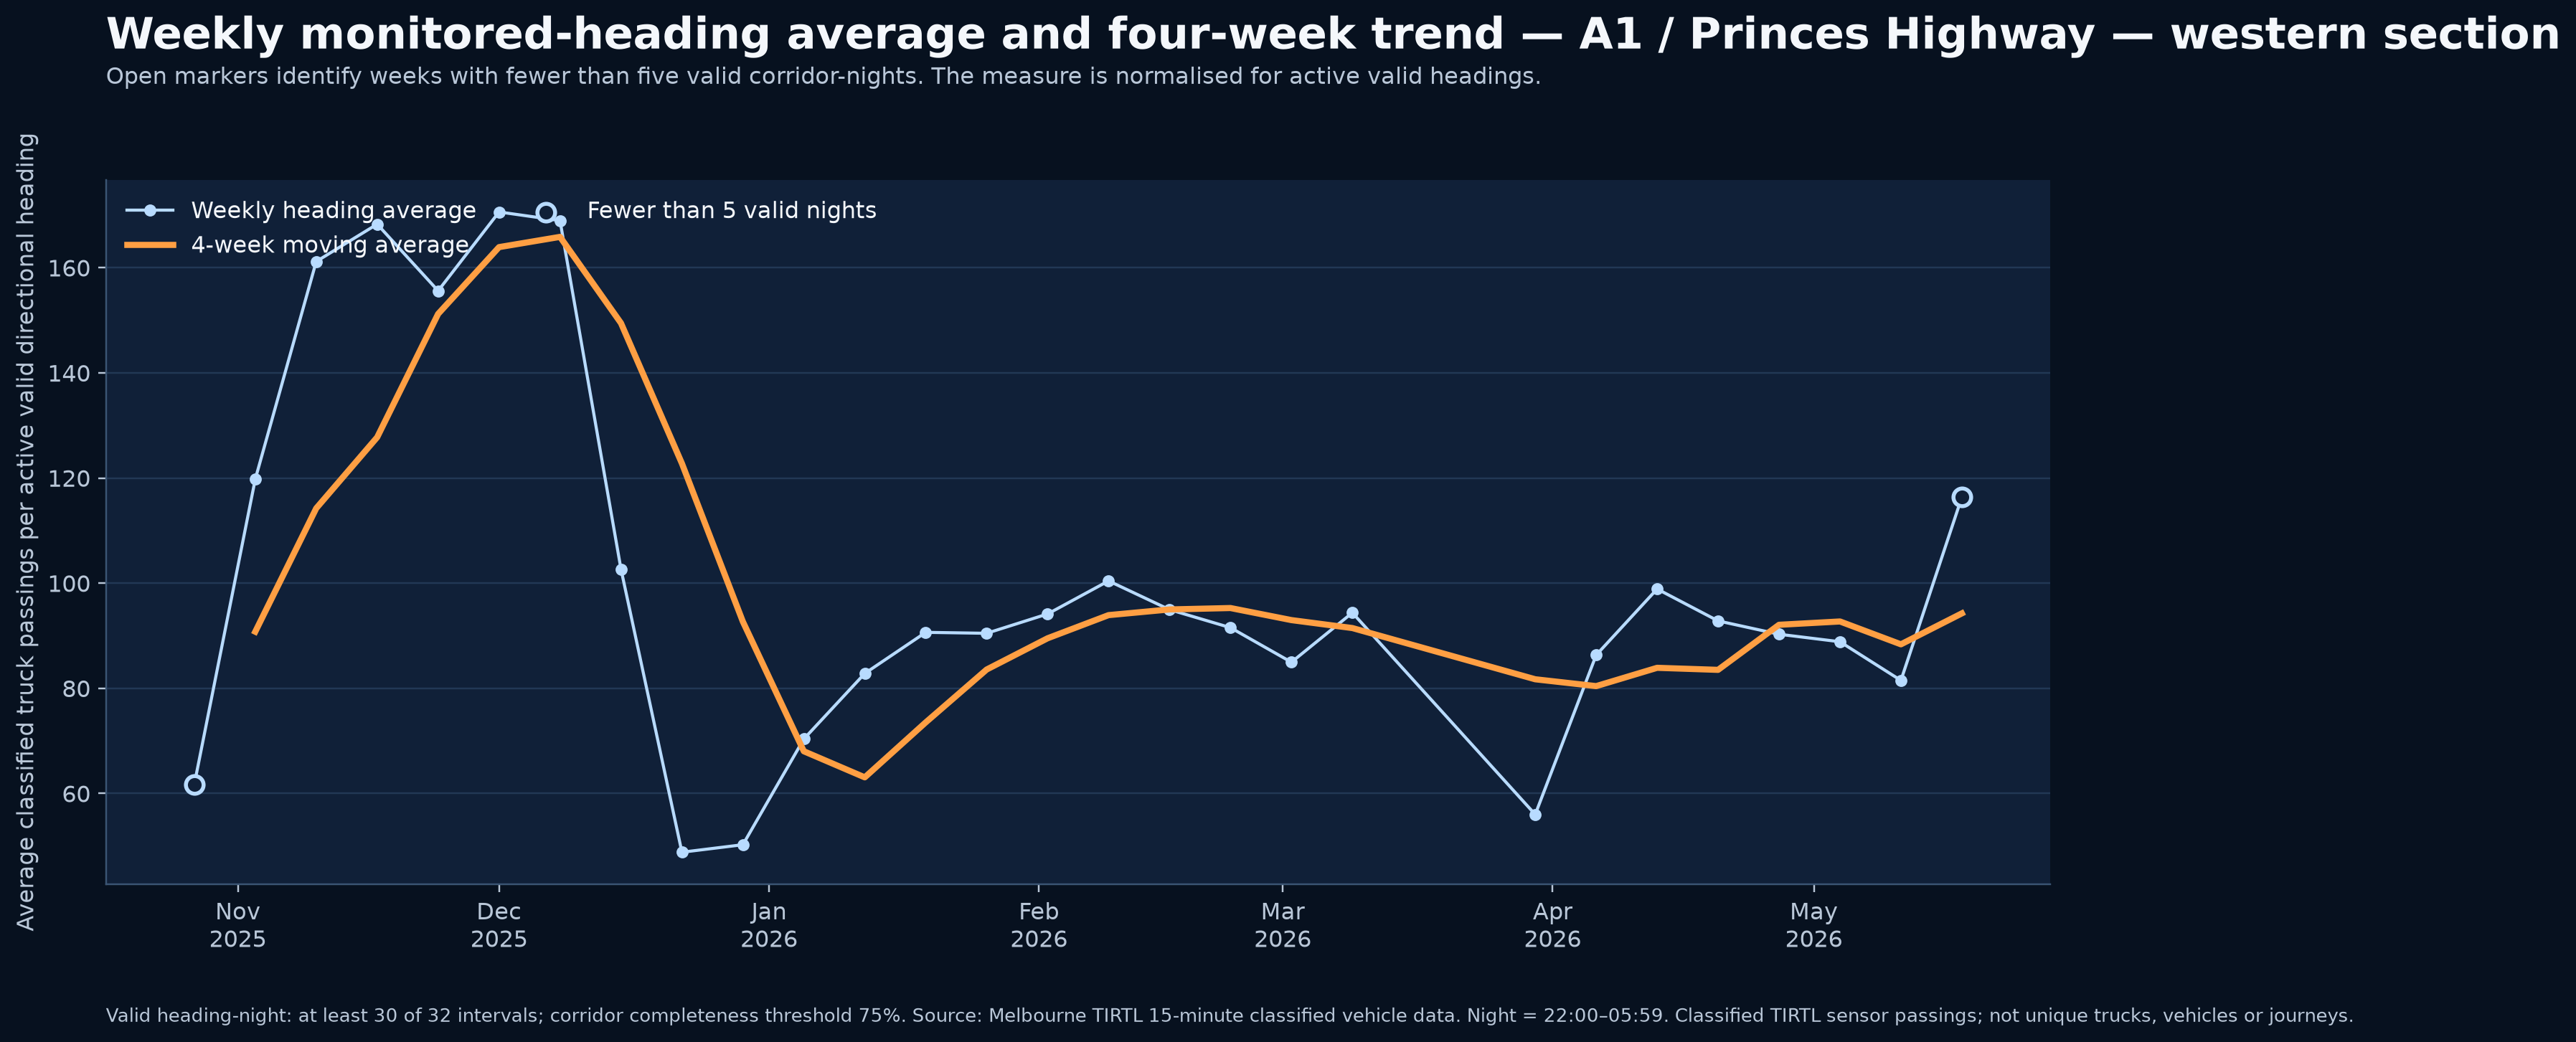
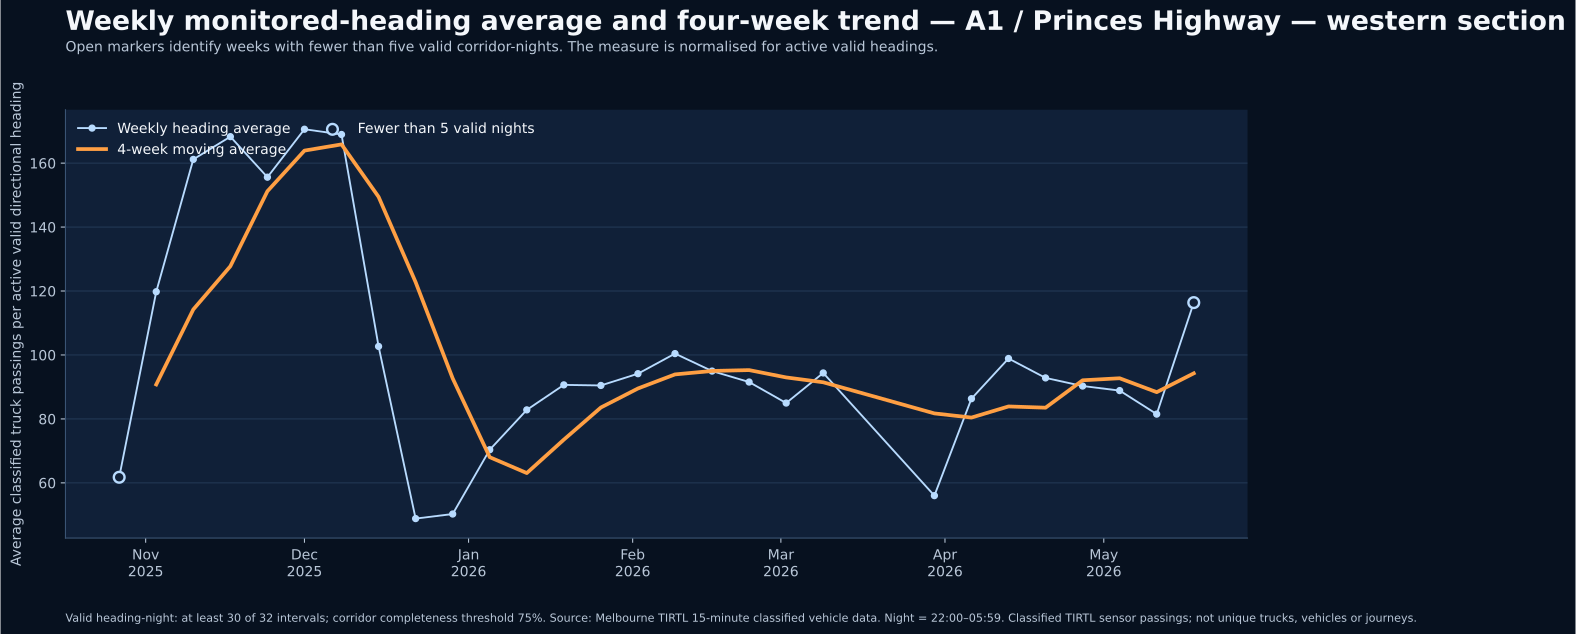
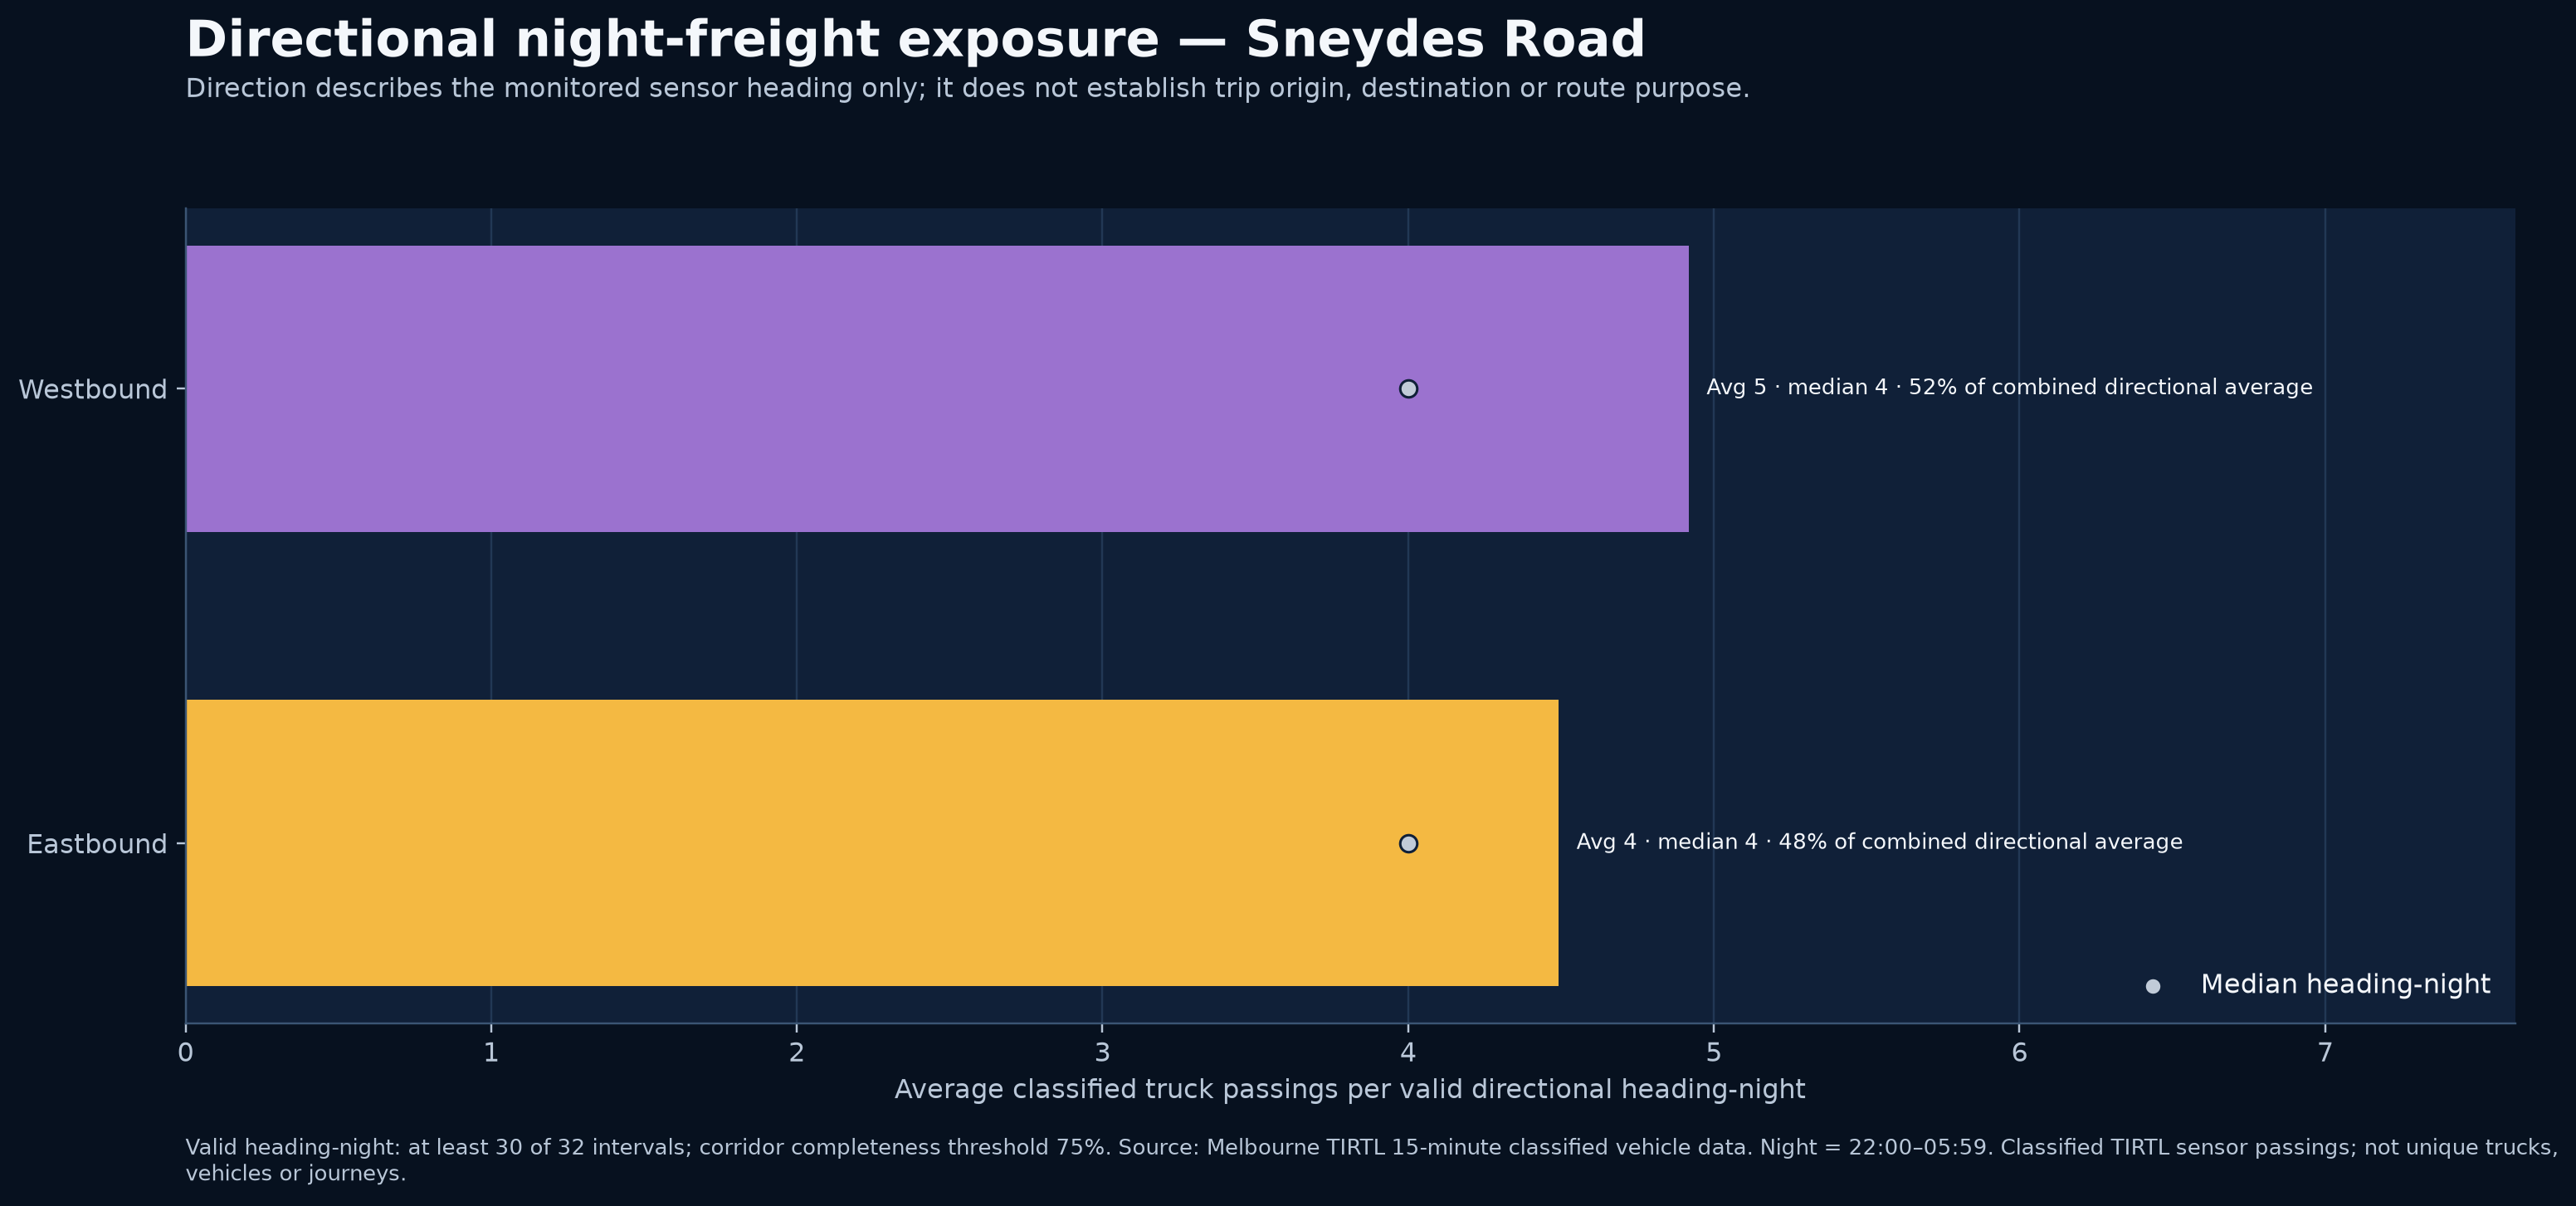
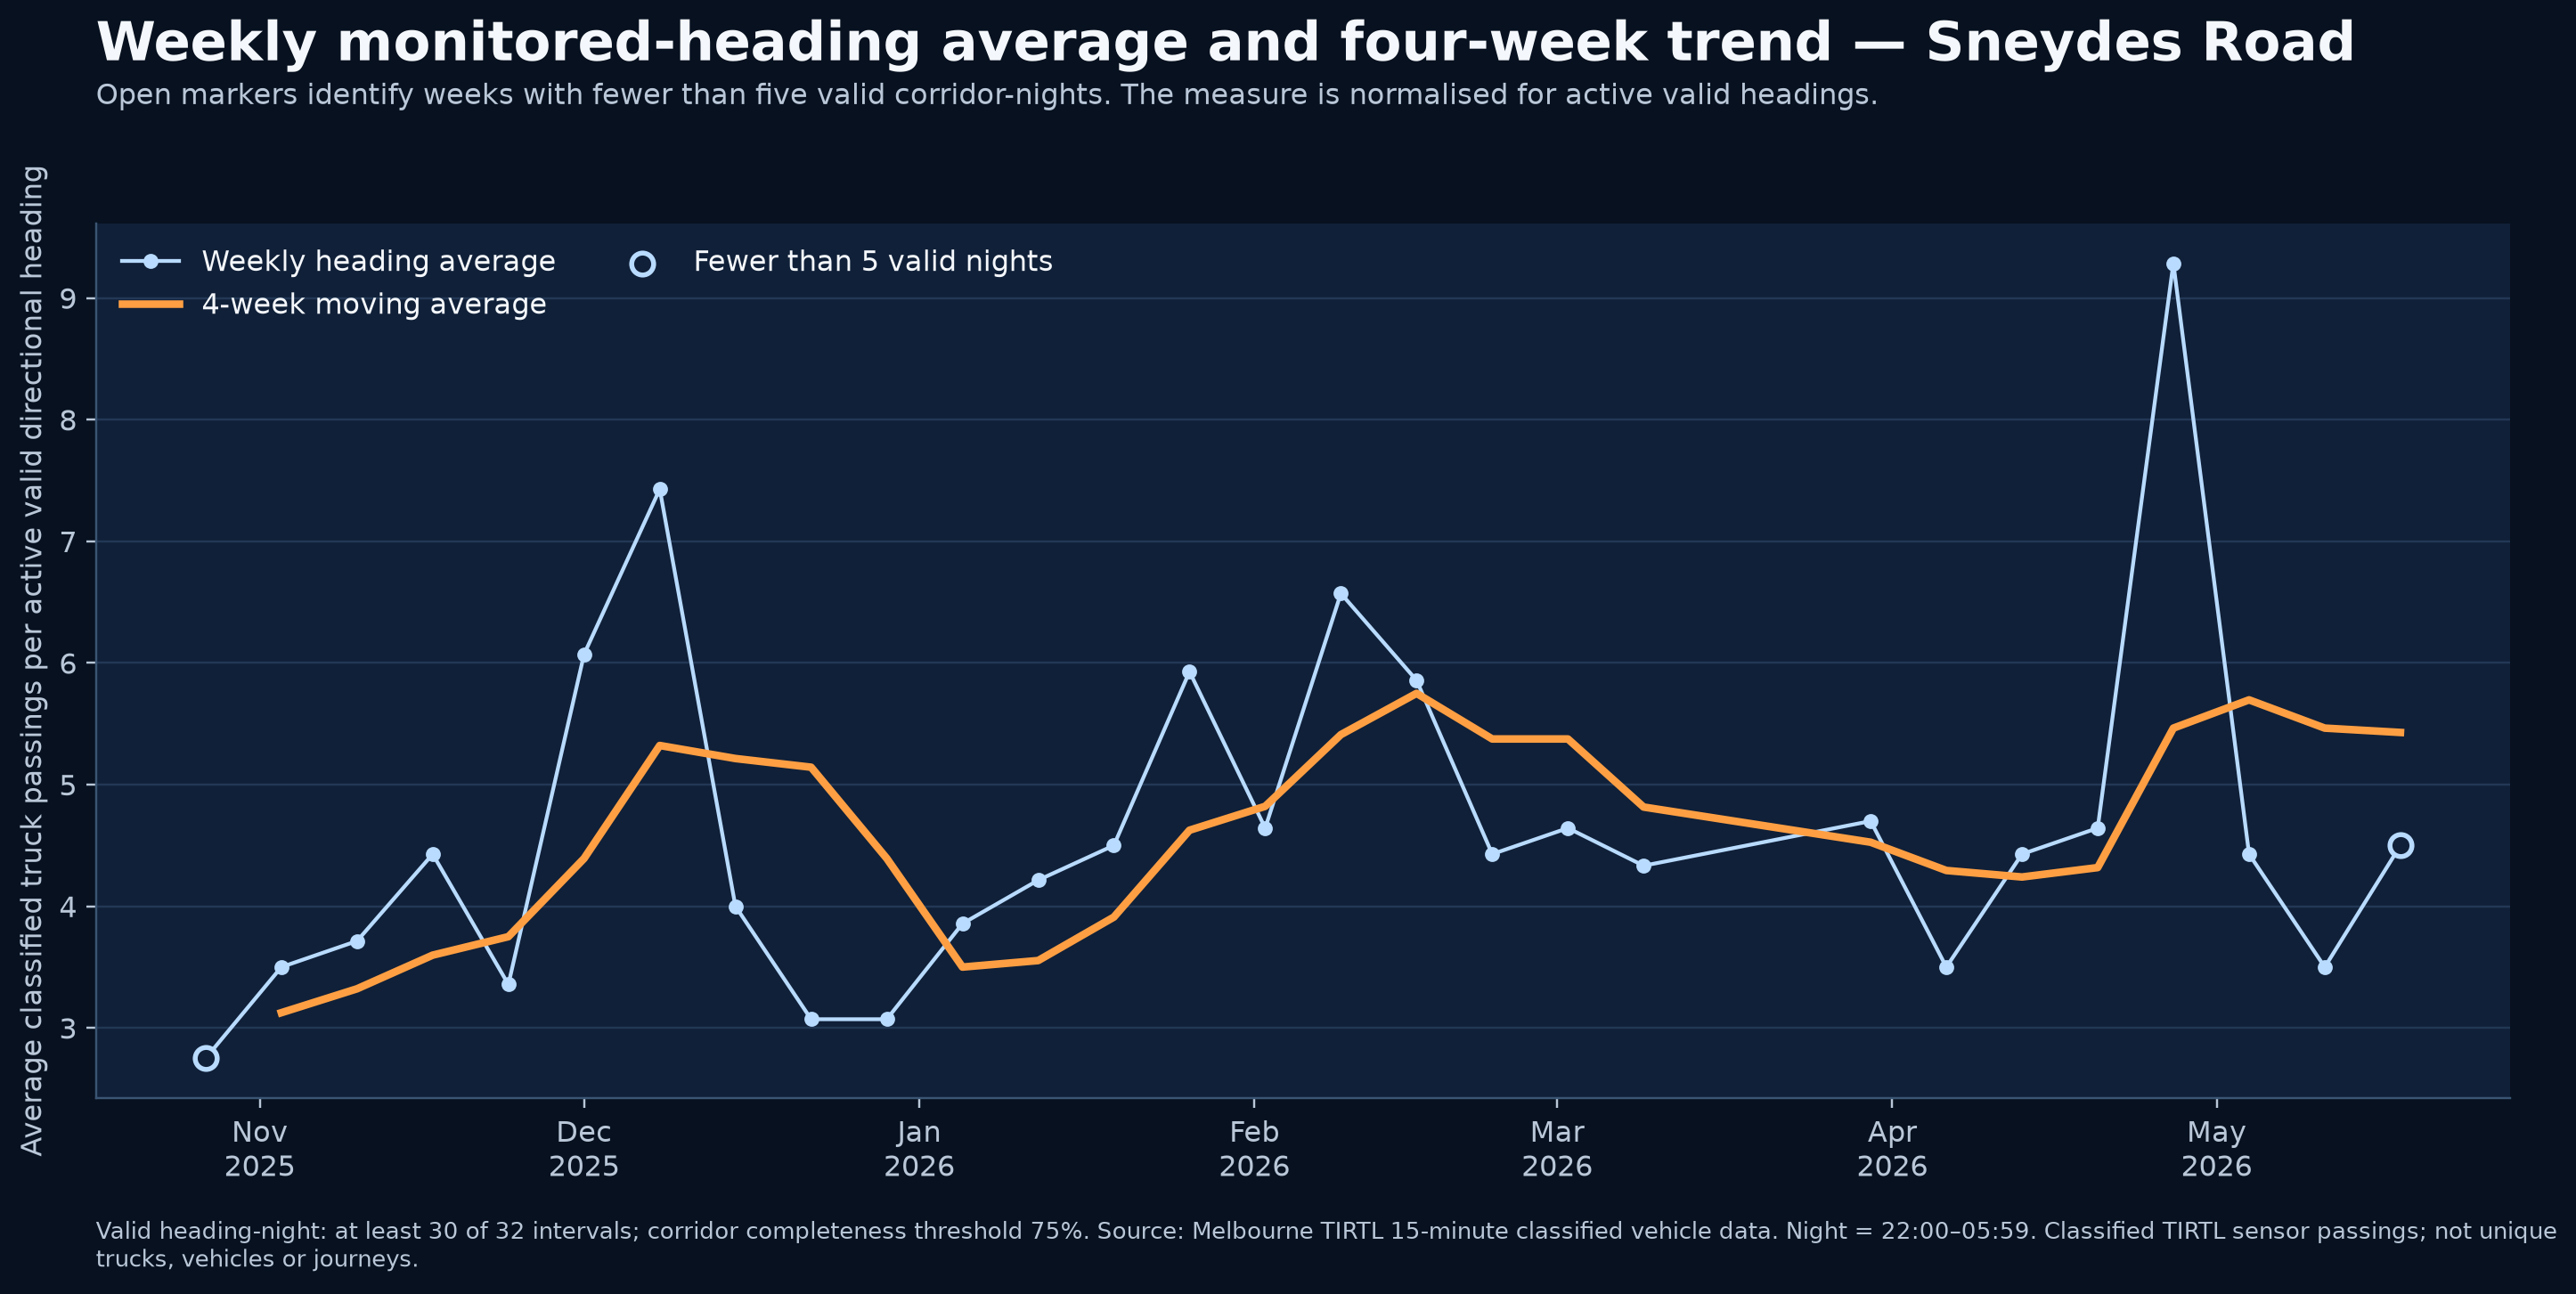
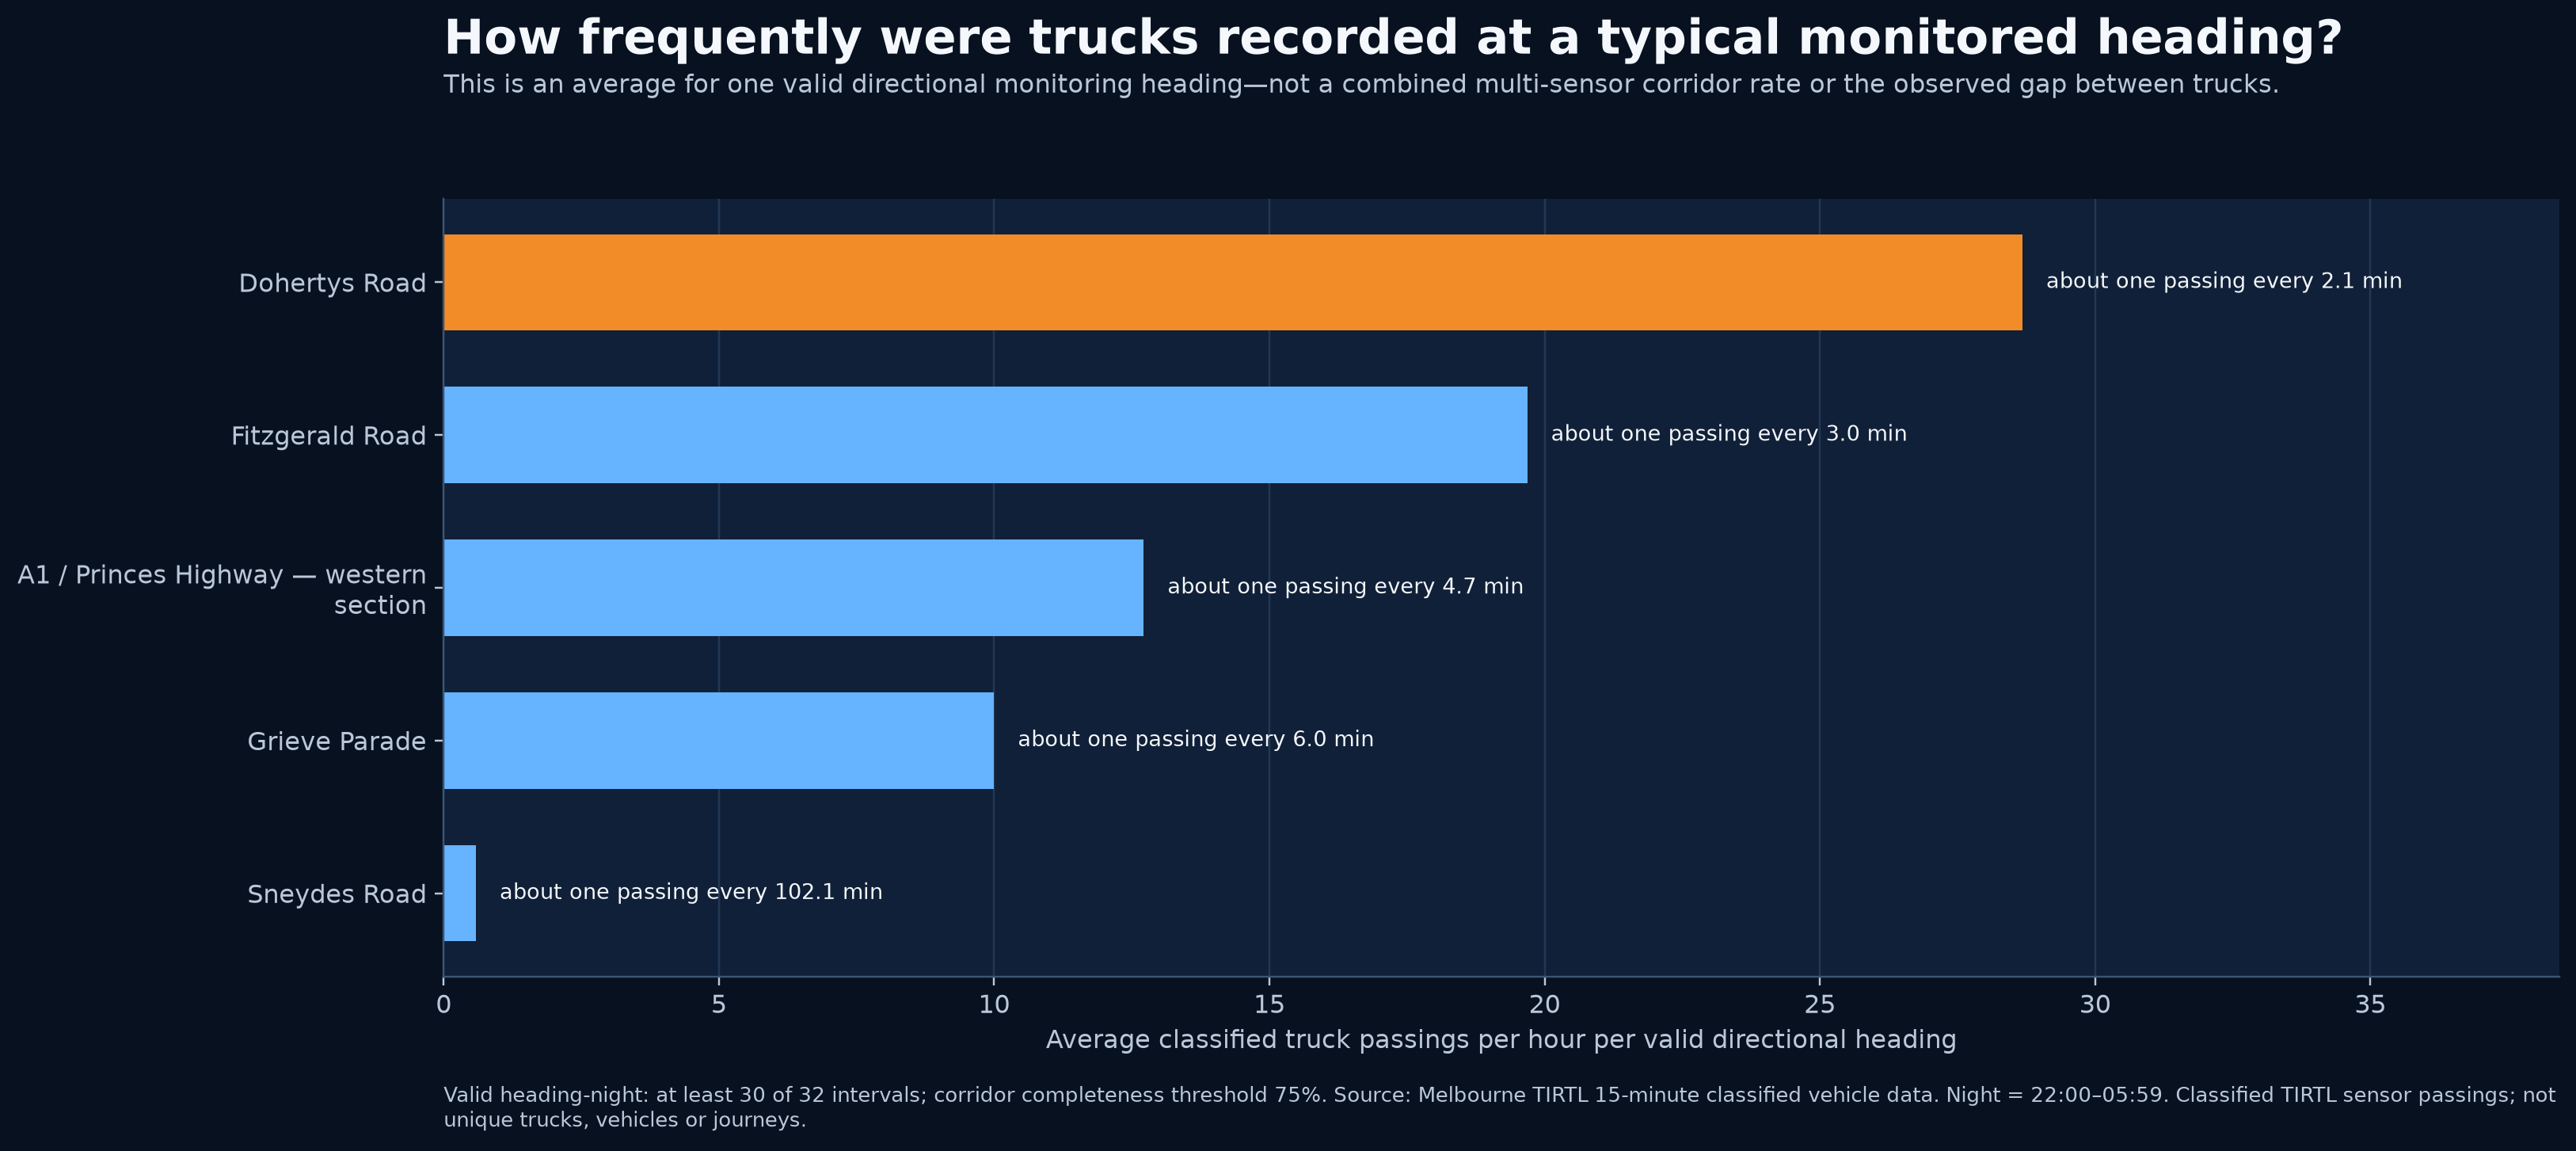
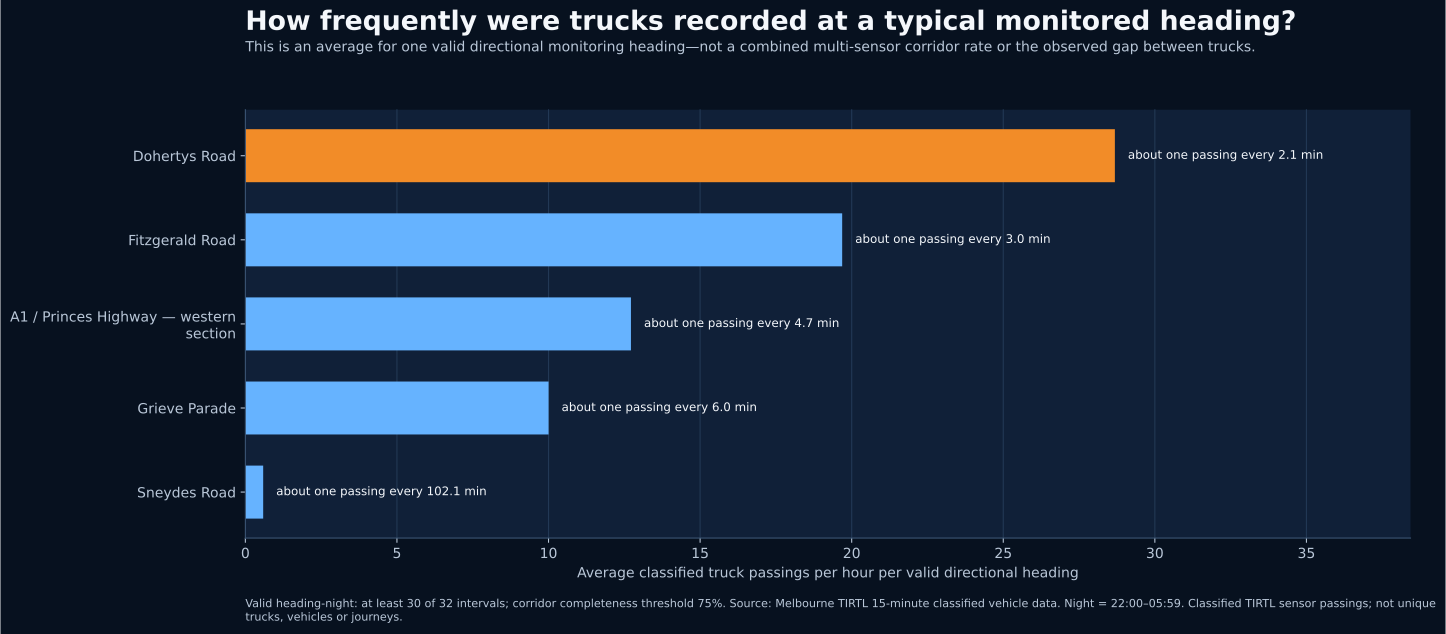
Average classified truck passings per valid directional heading-night, so roads with different sensor counts can be compared more fairly.
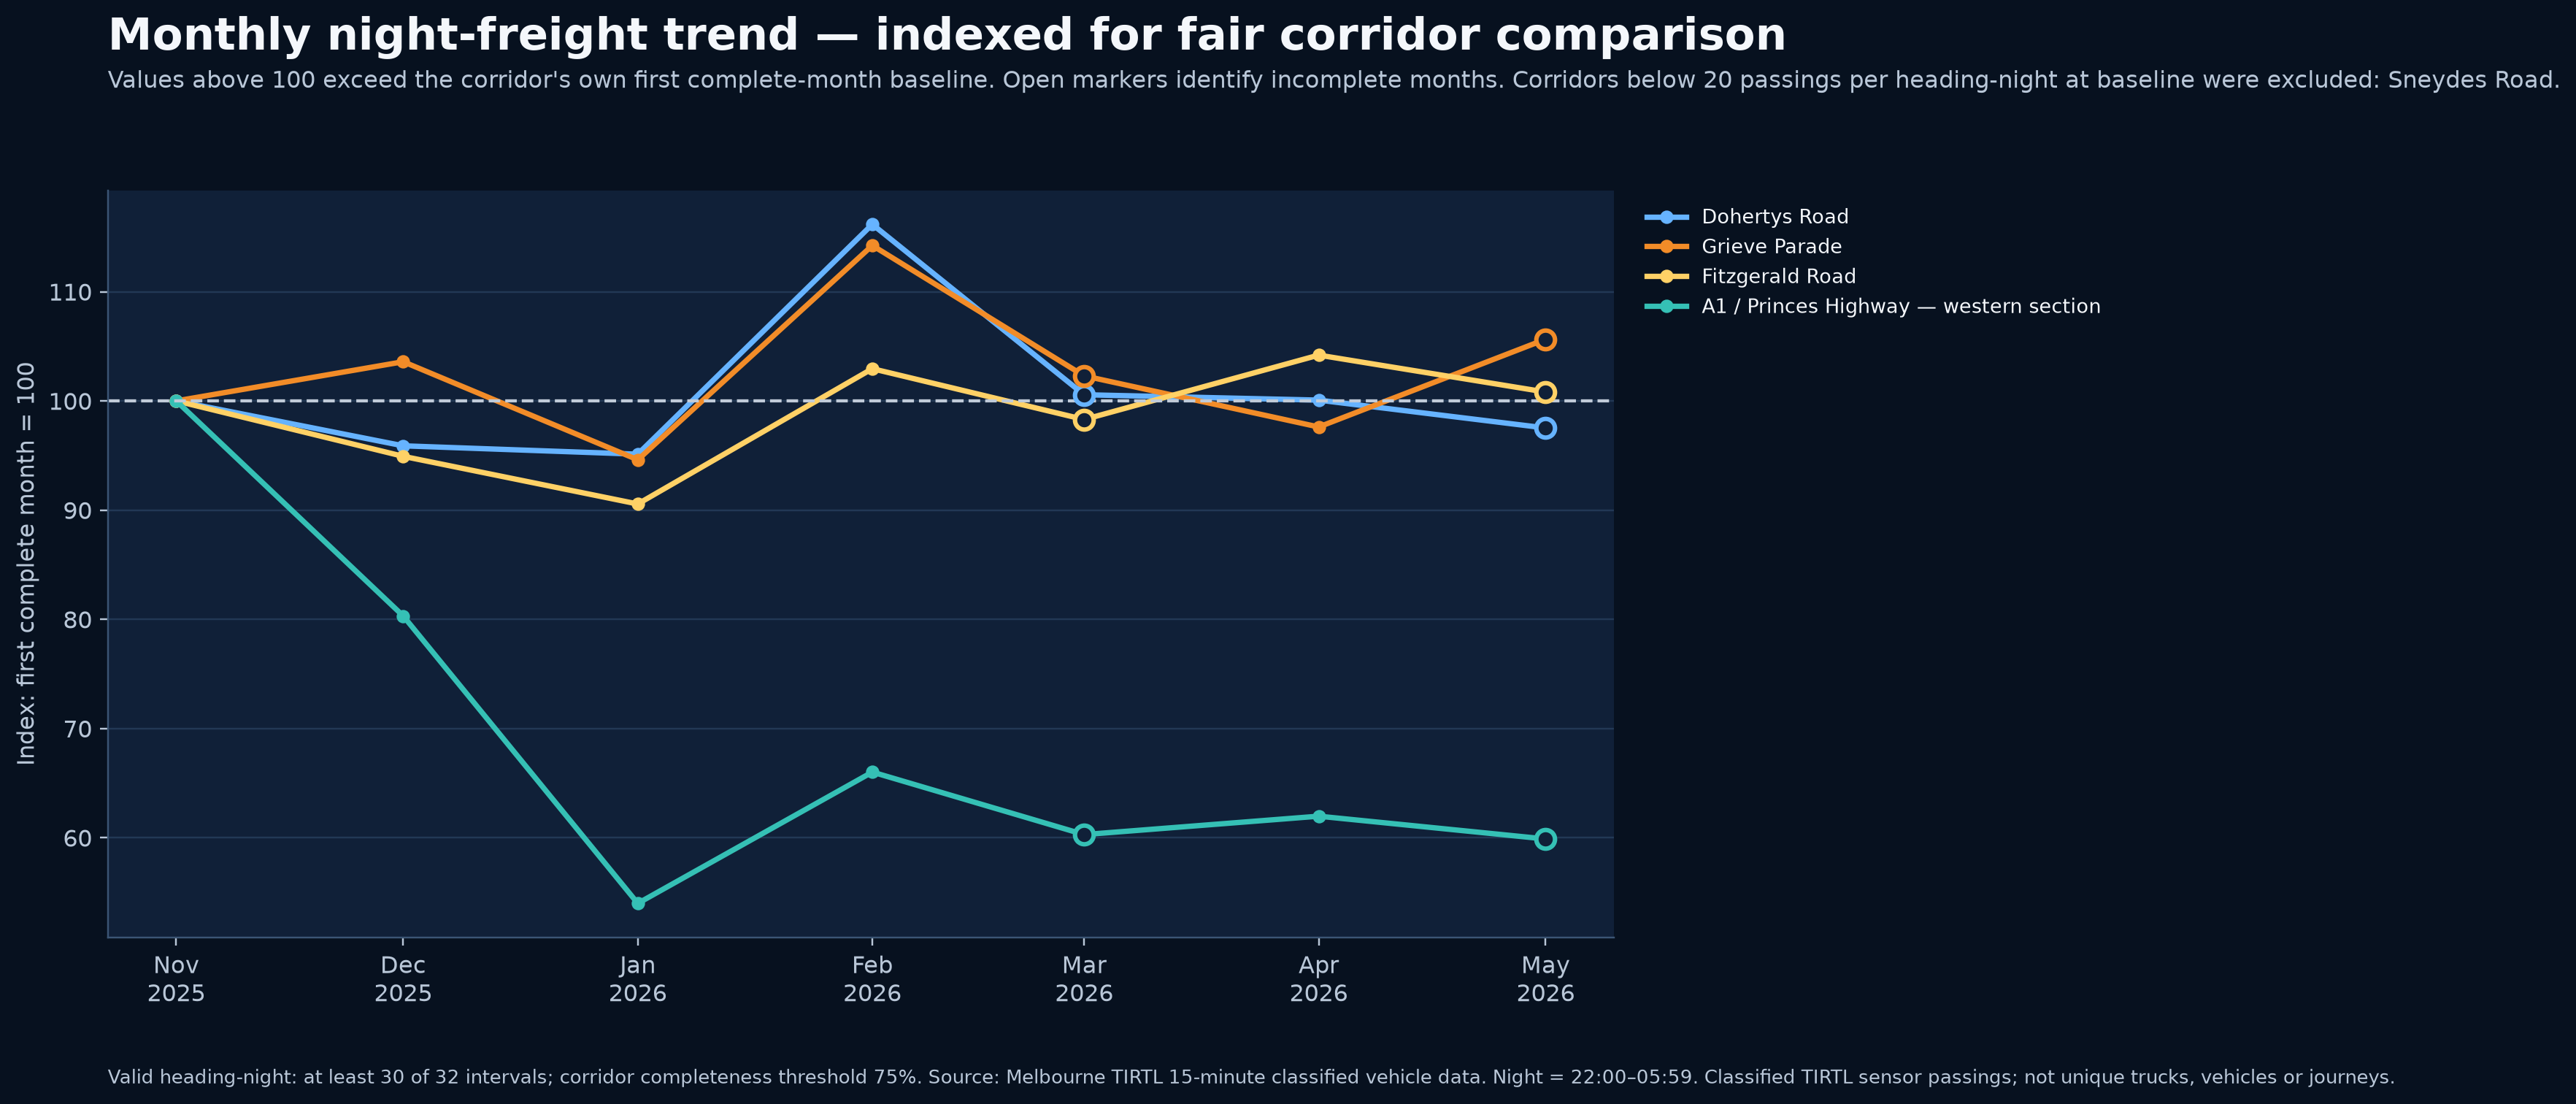
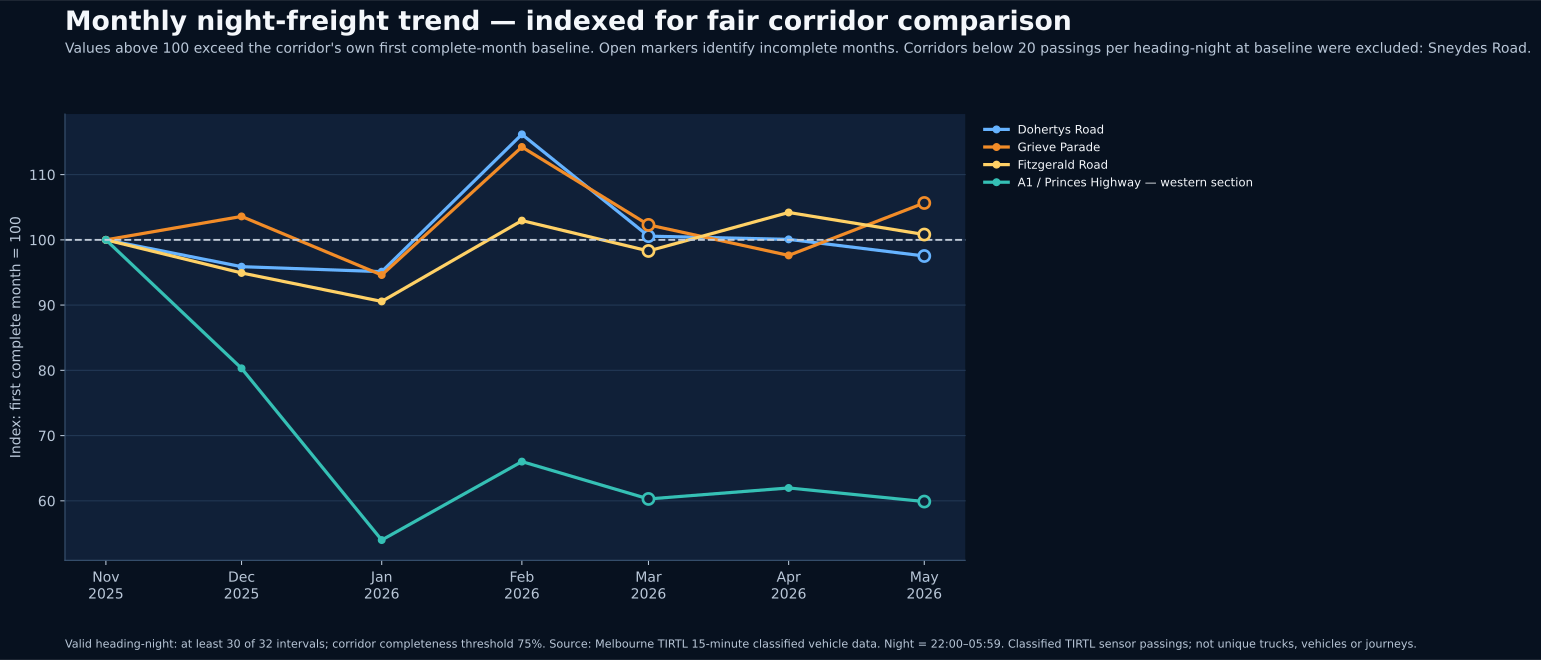
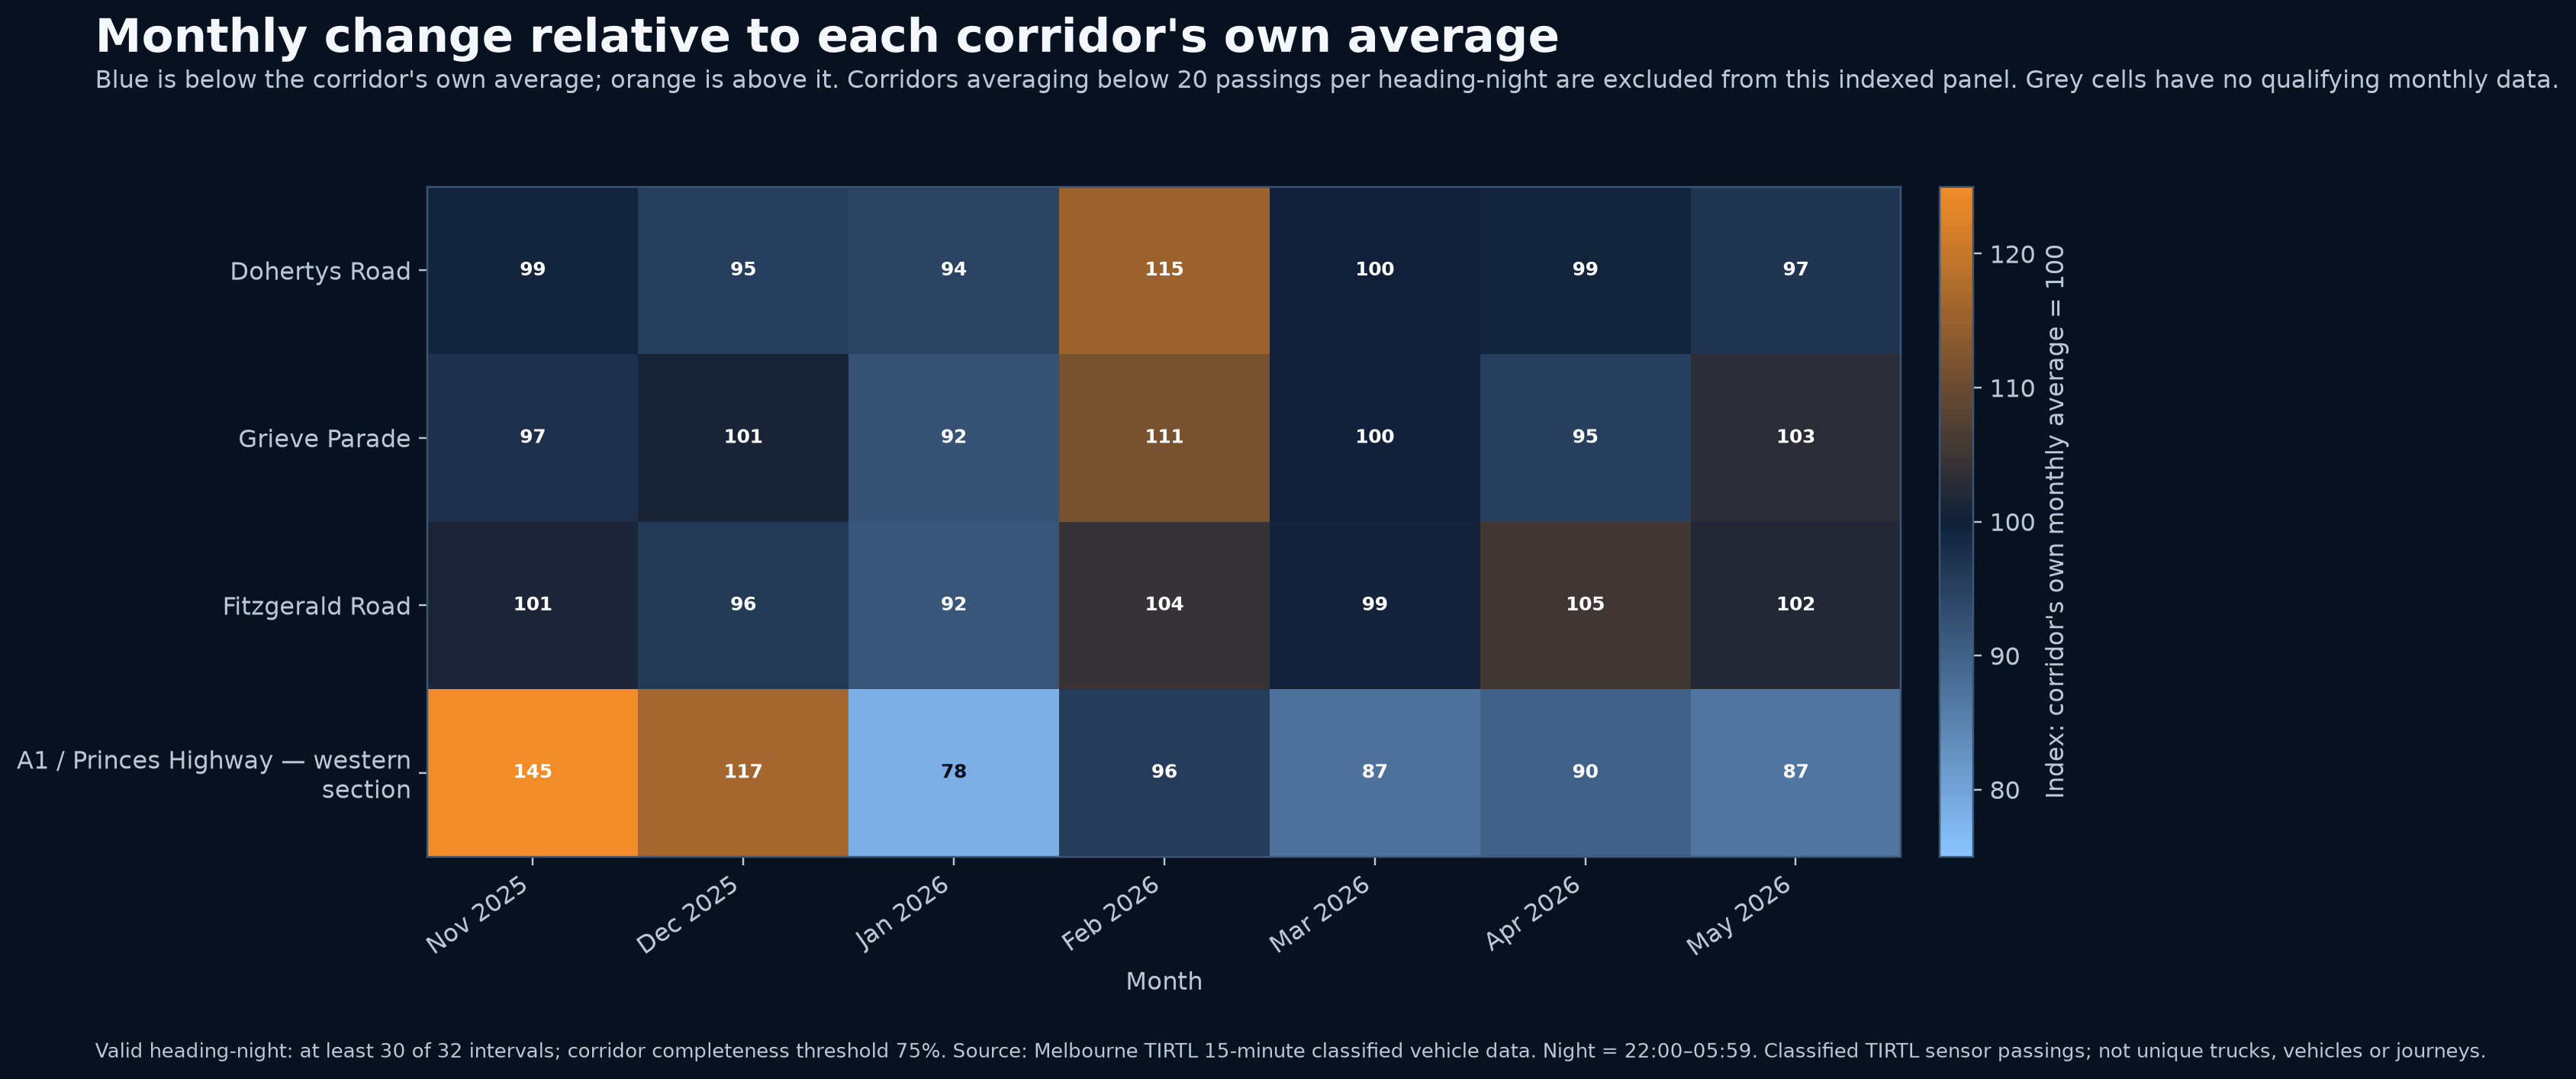
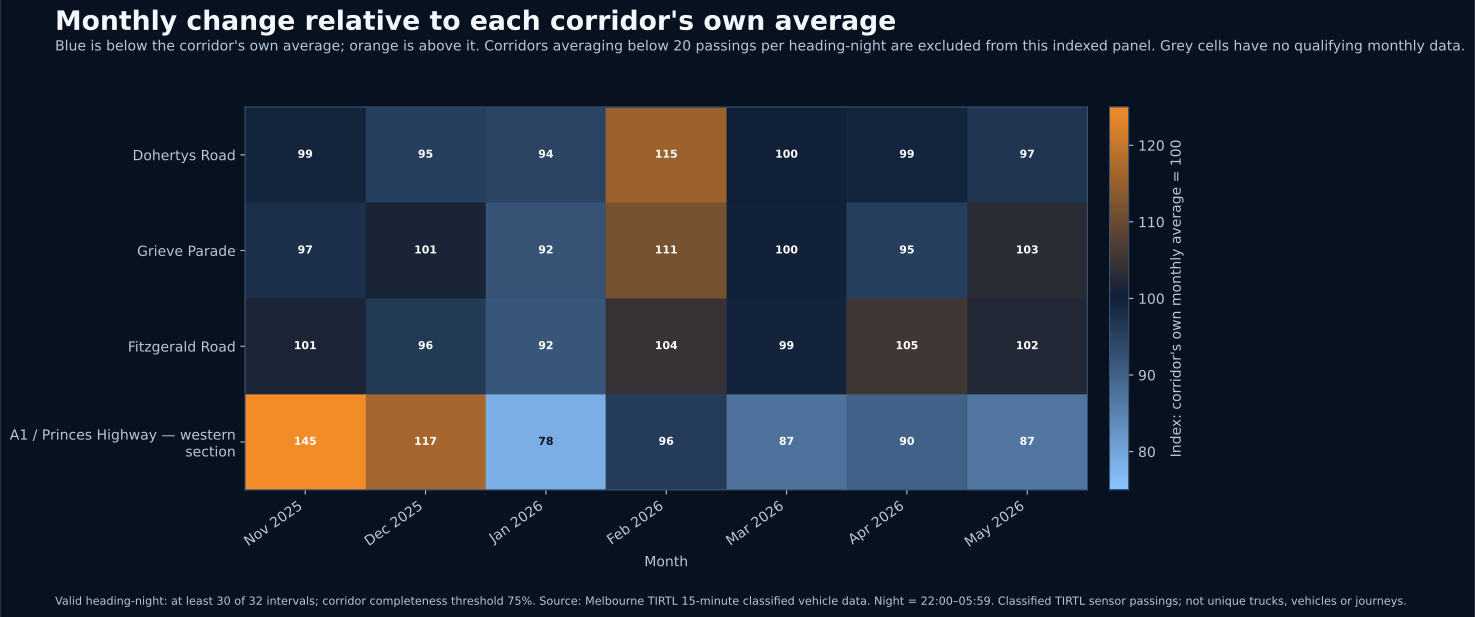
Monthly night-freight trend — indexed for fair corridor comparison
Each eligible corridor starts at 100 in its first complete month. Low-volume baselines are excluded to prevent small absolute changes from appearing as exaggerated percentage movements.