Why pay when the underlying platforms are public?
The public platforms provide the wider evidence. The paid report saves the work of finding, validating, selecting, ranking, interpreting and packaging the evidence most relevant to a particular commercial question.
What exactly do I receive?
You receive the purchased fixed 2026Q3 commercial intelligence PDF electronically after payment confirmation.
Does the report include access to the analyst if I have a question?
Yes. Each report purchase includes
one reasonable post-purchase question by email
about the report, its methodology, a ranking, chart, location or finding contained within the purchased edition. If something needs clarification after you have read the report, you can ask rather than being left to interpret it alone.
Questions requiring new research, new data processing, additional locations, custom modelling, new charts or organisation-specific analysis fall outside the fixed report and can be scoped separately.
Are these raw data downloads?
No. They are professionally prepared commercial reports containing selected findings, rankings, charts, profiles, interpretation and evidence boundaries.
Does buying a report make the public evidence exclusive?
No. Public source pages and publicly available analytical outputs remain public. The purchase is for the curated decision document.
Do the reports guarantee a commercial result?
No. They are screening and decision-support intelligence. Buyers should apply the appropriate operational, property, planning, audience, legal and financial due diligence for the decision at hand.
Which report is the most specialised?
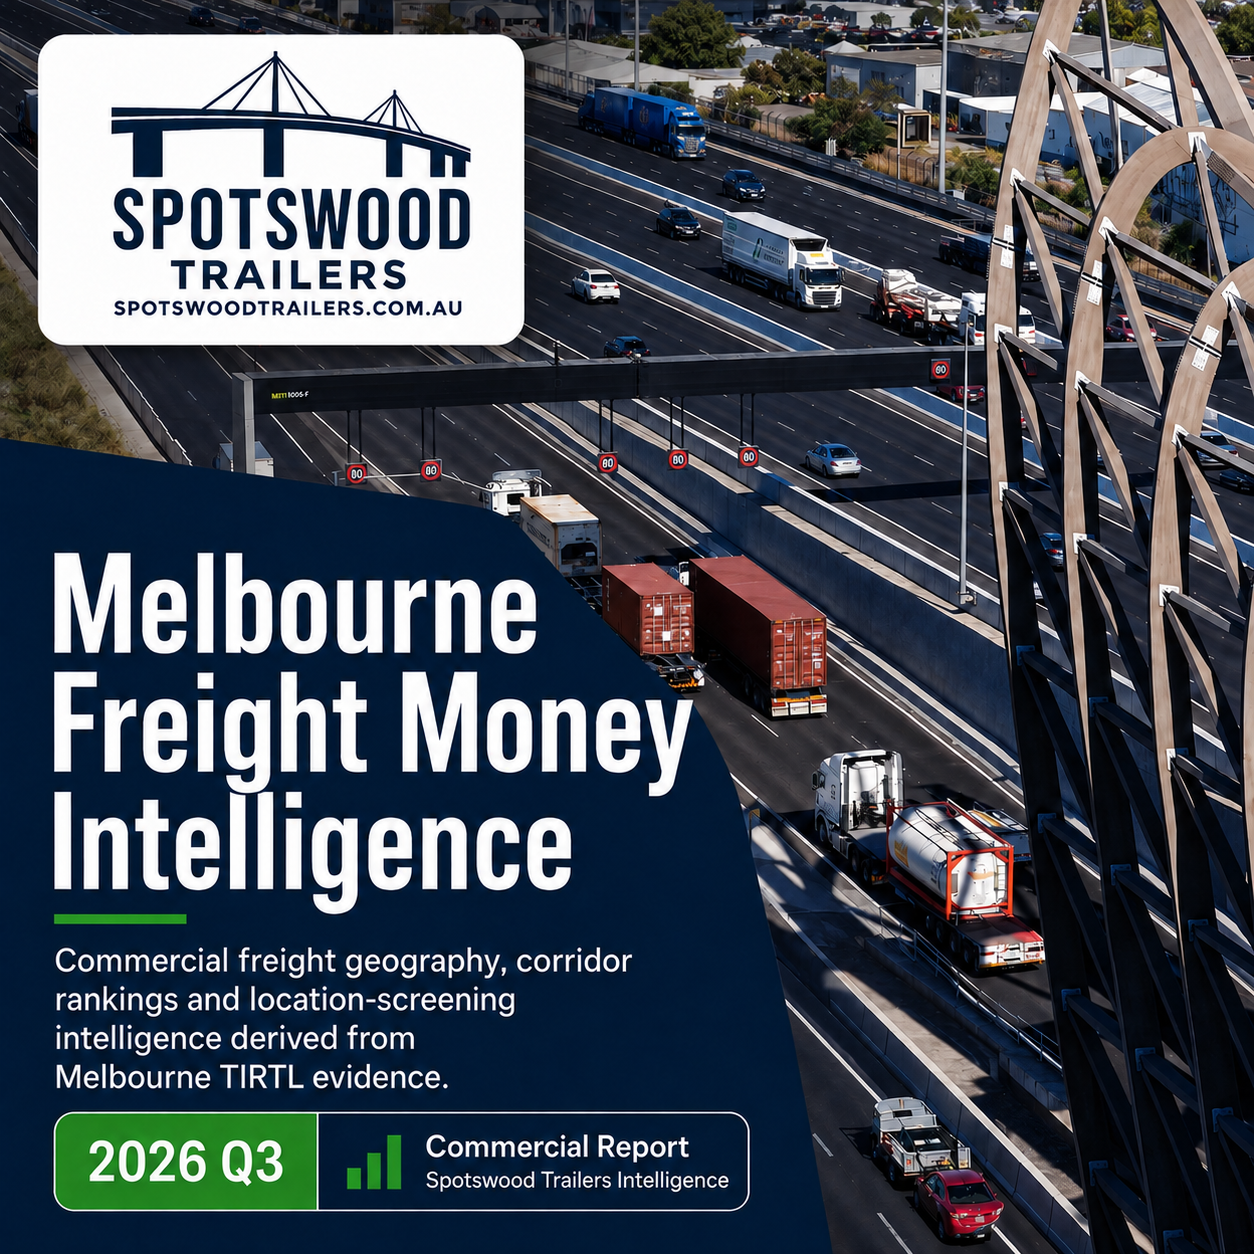
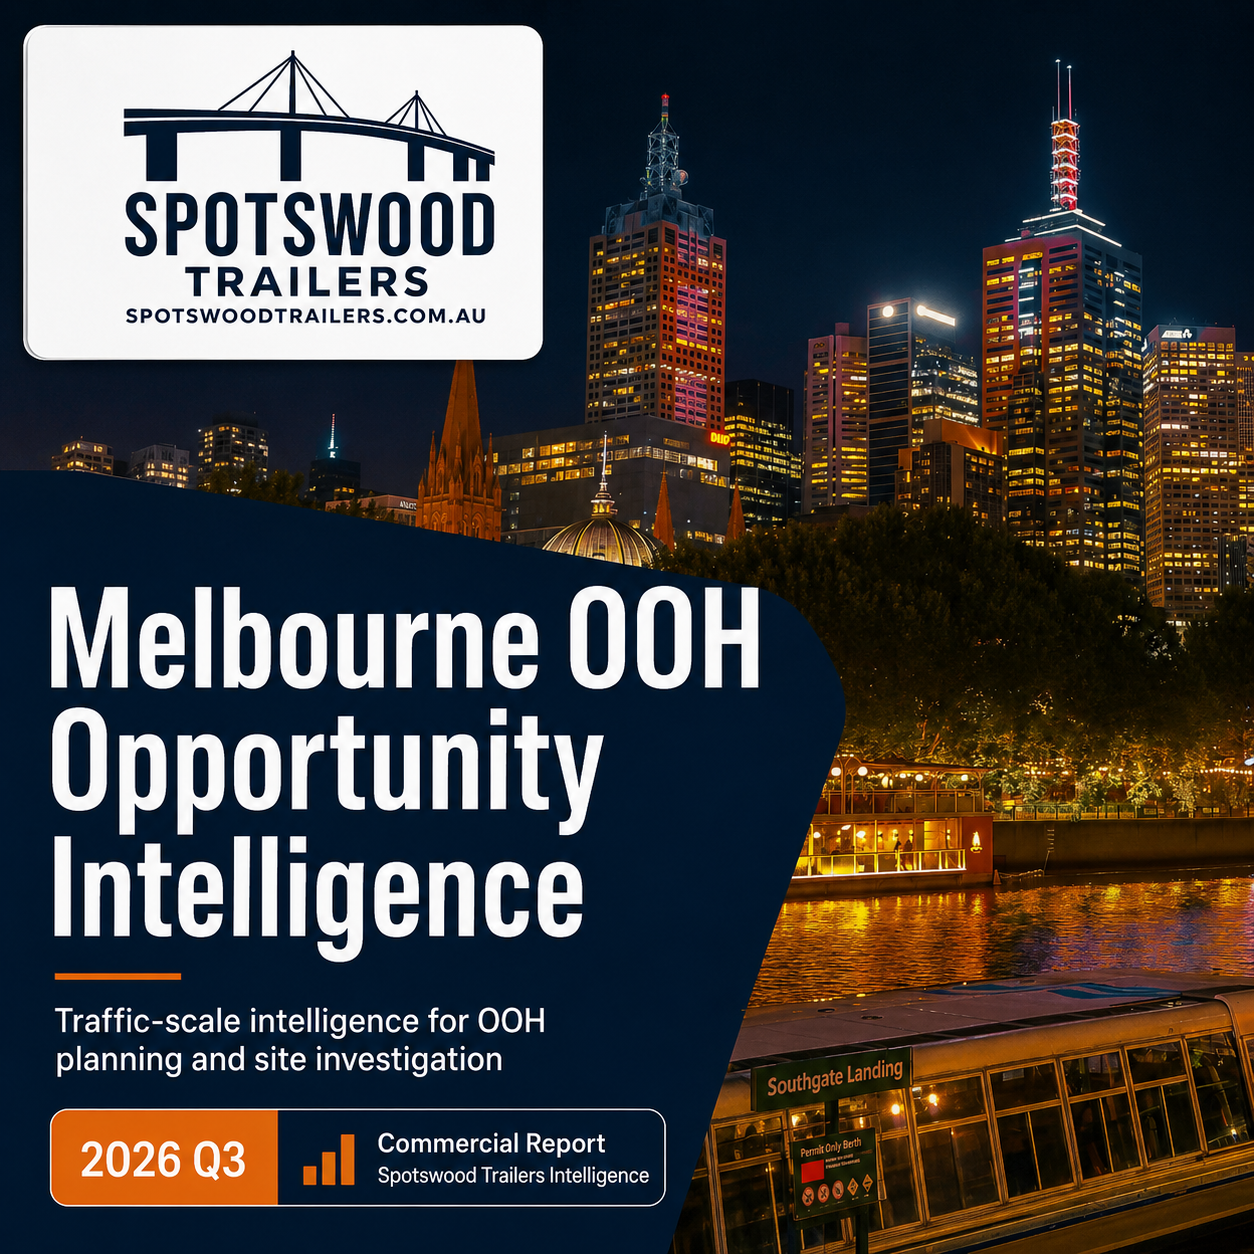
Commercial Gold is operator-specific. Freight Money is the broadest freight-location product. OOH Opportunity Intelligence is purpose-built for OOH network planning and site investigation.
What might an equivalent SCATS intelligence platform cost if an organisation commissioned it from scratch?
As an indicative replacement-cost exercise, recreating the data ingestion, cleaning, recovery, deduplication, quality assurance, long-horizon rankings, 15-minute temporal analysis, mapping, OOH intelligence layers, downloadable outputs and public publication environment could reasonably represent approximately
$500,000–$1.2 million AUD
of specialist consulting and delivery work. This is an illustrative planning range, not a quoted government contract price.
What might the TIRTL intelligence platform cost to reproduce?
A bespoke commission covering large-scale classified-vehicle data ingestion, database engineering, truck extraction, corridor analysis, temporal intelligence, speed and flow investigation, mapping, dashboards, quality assurance and publication could plausibly represent approximately
$300,000–$700,000 AUD
of specialist work, depending on scope, assurance and handover requirements.
What might the freight-analysis layer cost as a separate consultancy project?
Building freight-dependence rankings, corridor intelligence, locality analysis, temporal pressure measures, geographic overlays, mapping, screening tools and a public-facing freight analytical environment could represent approximately
$200,000–$500,000 AUD
if commissioned as a standalone specialist project. This work overlaps the underlying TIRTL infrastructure, so the two estimates should not simply be added together.
What might the complete SCATS + TIRTL + freight intelligence environment cost to recreate?
Allowing for substantial reuse between the different analytical layers, an integrated consultancy program of comparable breadth could plausibly fall within an indicative
$800,000–$1.8 million AUD
replacement-cost range. A formal organisational commission may also involve project management, stakeholder review, governance, assurance, documentation, accessibility work and handover in addition to the analytical development itself.
What kind of work sits behind an estimate of that scale?
An illustrative recreation could involve around
100–200 specialist days
for data architecture and ingestion,
80–150 days
for cleaning and recovery,
60–120 days
for quality assurance and coverage diagnostics,
120–220 days
for traffic and freight analytics,
60–120 days
for GIS and location intelligence,
80–150 days
for dashboards and public publication,
40–80 days
for commercial interpretation and reporting, and
60–120 days
for documentation, review, project management and handover. These workstreams overlap and are intended to show scale rather than act as a consultancy quotation.
What technical background sits behind the intelligence platform?
The system was developed by Clarke Towson, whose professional background
combines computer science, mathematical and scientific computing, large-scale
data processing and high-performance computing.
Before developing the Spotswood Trailers Intelligence platforms, Clarke
spent approximately 21 years with DST Group, working in
technical computing environments that included
high-performance computing (HPC), computational and
scientific workloads, large-scale processing and supporting technical
infrastructure.
That background is directly relevant to the current transport-intelligence
environment. The SCATS, TIRTL and freight systems require large analytical
databases, repeatable data-processing pipelines, resource management,
automation, validation and the ability to investigate results at scales
well beyond conventional spreadsheet analysis.
The commercial reports therefore sit on top of a wider engineering
approach shaped by long experience with computing systems, quantitative
analysis and large-scale technical workloads, rather than being created
as isolated desktop reports.
What did it take to build the intelligence system behind these reports?
The current SCATS, TIRTL and freight intelligence environment was built over approximately
four months of concentrated development
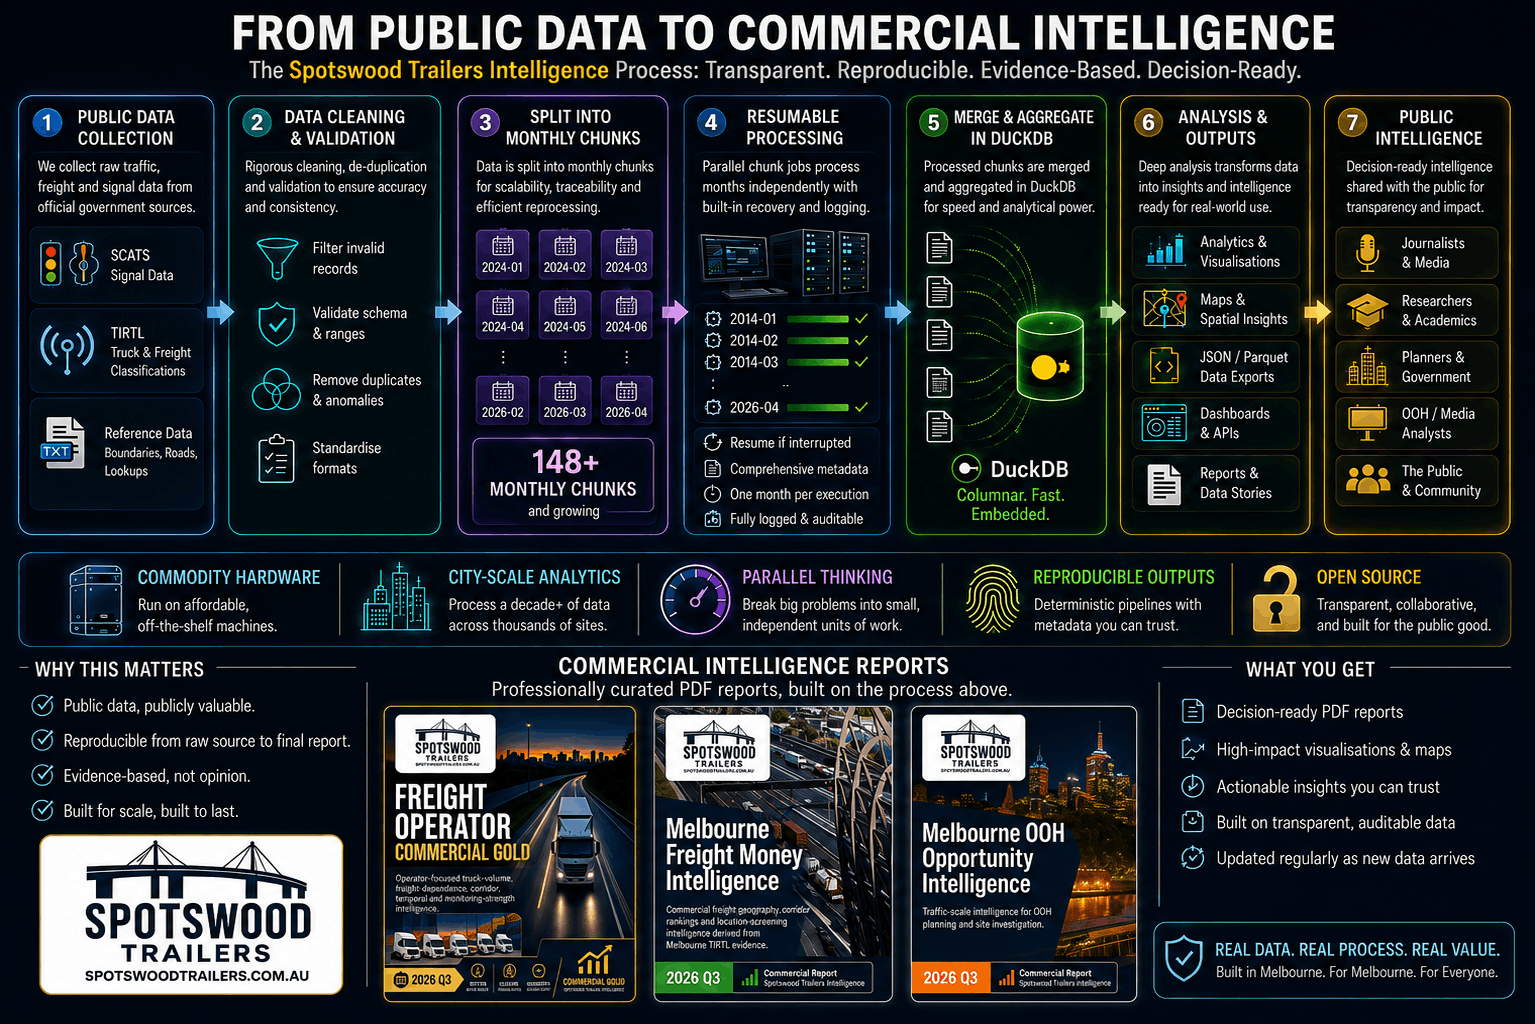
. That work was not simply writing reports. It involved building reusable data-ingestion pipelines, analytical databases, cleaning and recovery workflows, quality-assurance systems, ranking engines, temporal analytics, freight and traffic models, geographic intelligence, public web platforms, interactive maps and automated commercial-report production.
The technology stack includes
Python
for data engineering, analytics and report-generation workflows;
DuckDB
for high-performance analytical databases and large-scale querying;
PowerShell
for Windows automation and production orchestration; a combination of
Linux and Windows systems
for processing and hosting;
Apache
for public web publication; and
HTML, CSS and JavaScript
for the interactive intelligence platforms.
Mapping and location intelligence use technologies including
Leaflet
,
OpenStreetMap
,
Google Maps
,
Google Street View
and Victorian spatial, transport and cadastral datasets. Automated publication and report production also use tools including
Playwright
for browser-based rendering and quality assurance, together with automated chart, image, hyperlink and PDF generation workflows.
The engineering challenge is amplified by scale. The wider analytical environment works across many years of Melbourne transport evidence and analytical datasets containing
billions of recorded vehicle movements
. Processing data at that scale requires database design, memory and storage management, repeatable pipelines, recovery procedures and automated quality controls rather than conventional spreadsheet analysis.
The system is also supported by
dedicated on-site server infrastructure
. Rather than relying entirely on third-party cloud services, substantial parts of the processing, storage, web publication, monitoring and backup environment are operated on locally controlled Linux and Windows servers. This provides direct control over large analytical databases, long-running processing jobs, storage capacity, software configuration and publication workflows.
Operating that infrastructure is itself a specialised part of the system. It involves maintaining server operating systems, storage, networking, web services, automated jobs, monitoring, backups and recovery processes, while ensuring that resource-intensive analytical workloads can run without disrupting public-facing services. The wider infrastructure also supports other Spotswood Trailers technology projects, including continuous public web services and video-streaming workloads.
The result is therefore more than a set of reports or web pages. It is a
reusable transport-intelligence production environment
combining data engineering, high-performance analytical processing, geographic analysis, server infrastructure, software automation, web publishing and commercial reporting. New rankings, maps, profiles and investigations can be produced from that foundation without rebuilding the underlying system for every question.
That reuse is an important part of the value proposition. A customer buying a
$195–$395 AUD
report is not paying for four months of platform development, specialised server infrastructure and analytical engineering themselves. They are buying a focused commercial output from a system that has already been engineered, tested, quality-controlled and made partly available through the public SCATS, TIRTL and freight intelligence platforms.
How was artificial intelligence used in building the system?
AI was used as an engineering and analytical assistant, not as the source of record for the underlying transport evidence.
It assisted with activities such as software development, code review and debugging, analytical design, documentation, interpretation, report development and exploring ways to present complex findings more clearly.
The underlying datasets are far too large to simply be placed into a generative-AI prompt and asked for an answer. The SCATS, TIRTL and related analytical environments contain
billions of recorded vehicle movements
across many years of evidence. Working at that scale requires databases, structured queries, data pipelines, aggregation, indexing, filtering and deterministic analytical programs. AI operates around that engineering environment rather than replacing it.
In practice, large datasets are first processed using technologies such as
Python and DuckDB
. The system reduces very large source datasets into validated metrics, rankings, summaries, tables, charts and other manageable analytical outputs. AI can then assist with examining, explaining or presenting those outputs without pretending that the full underlying database has been absorbed into the AI model.
Human work remains a significant part of the process.
Decisions still have to be made about which datasets are appropriate, what individual fields mean, how different sources relate to one another, whether a result is plausible, whether coverage is sufficient, whether a metric supports the conclusion being drawn and whether an apparent finding is actually an artefact of incomplete or unusual data.
Human engineering is also required to design and operate the ingestion pipelines, databases, servers, storage, networking, monitoring, backups, publication systems and quality-control procedures. When an analytical result fails a validation test, resolving it can require investigation of source files, database schemas, geographic relationships, software logic and the physical meaning of the transport data rather than simply asking an AI system to produce a different answer.
For the commercial intelligence reports, numerical findings and rankings are derived from
repeatable database queries and deterministic analytical workflows
. AI can assist with development, interpretation and communication, but it is not allowed to invent missing measurements or silently convert an unsupported assumption into a published fact. Where the available evidence cannot support a conclusion, the appropriate result may be to state the limitation or leave the claim unmade.
The combination is therefore important:
large-scale data engineering provides the evidence, human expertise provides judgement and validation, and AI accelerates parts of the engineering, investigation and communication process.
The value of the finished system comes from integrating all three rather than treating AI as a replacement for the underlying analytical work.
What might a bespoke 40–45 page intelligence report cost if commissioned individually?
A bespoke report still requires the question to be defined, evidence located and validated, analysis performed, charts and maps produced, interpretation written, limitations documented and the finished report reviewed. An illustrative allowance of
10–30 specialist consulting days
at approximately
$1,000–$1,500 AUD per specialist day
implies an indicative bespoke cost of around
$10,000–$45,000 AUD
.
What might it cost me in time and money to do this analysis myself instead of buying a report?
The public intelligence platforms are deliberately available for buyers who want to conduct their own investigation. For a narrow question, that may be entirely appropriate. Reproducing something closer to a decision-ready commercial briefing, however, means spending time locating the relevant evidence, understanding the metrics, checking coverage and limitations, comparing locations, examining maps and temporal patterns, building a shortlist, validating conclusions and then turning the findings into something suitable for internal discussion.
For a professional analyst, manager, consultant or commercial decision-maker, that could readily mean
several hours to several working days
, depending on the question and how familiar they already are with the underlying SCATS, TIRTL and freight environments. A more ambitious attempt to reproduce the depth, charts, rankings, location profiles and documented methodology of an entire commercial report could require substantially longer.
There is also an internal cost to that time. As an illustration, if an organisation values professional staff or consulting time at around
$100–$250 AUD per hour
, even a relatively modest amount of research and preparation can represent
hundreds or thousands of dollars of professional time
. This is an illustrative opportunity- cost comparison rather than a claim about any particular buyer's salary, consulting rate or internal cost structure.
The choice is therefore not necessarily
“pay $195–$395 or get the information for free.”
The public evidence is free to inspect, but extracting the relevant evidence, understanding it, checking it and preparing a decision-ready briefing still consumes professional time. The commercial report is intended to let a buyer purchase much of that selection, validation, interpretation and presentation work already completed.
For an organisation making decisions involving vehicles, property, infrastructure, advertising assets or operating costs, the price of the report may be small compared with both the value of staff time saved and the value of getting the initial investigation focused on the right locations sooner.
Why can these commercial PDFs cost only $195–$395 if bespoke work could cost far more?
Because each buyer is not commissioning the analytical platform from zero. The underlying data engineering, reusable methods, ranking systems, maps, validation work and public evidence environments already exist. The report price is therefore for a fixed, professionally curated edition: selecting what matters, validating it, ranking it, interpreting it, presenting it clearly and freezing it into a dated, shareable decision document.
Does the $800,000–$1.8 million estimate mean the public websites themselves are worth that amount?
No. It is not a business valuation, accounting valuation or claim about what any government department, corporation or consultancy has actually charged or paid. It is an illustrative
cost-to-recreate
perspective showing the scale of professional work that could be involved if an organisation started with the source datasets and commissioned comparable analytical capability and outputs from scratch.
How does the public-versus-paid value comparison work?
The broad SCATS, TIRTL and freight intelligence environments can be explored publicly at no charge. Individual commercial reports cost only
$195–$395 AUD
because they reuse that existing analytical infrastructure and convert it into a focused, decision-ready briefing rather than requiring each customer to fund an entirely new analysis program.
Why might Chrysalis Australia appear when I pay?
The Square merchant facility used for these transactions is connected to Chrysalis Australia (Registration No. A0107285D). The report itself is a Spotswood Trailers Intelligence commercial publication associated with INTJ Billing Pty Ltd.
What is the relationship between Spotswood Trailers Intelligence and INTJ Billing Pty Ltd?
Spotswood Trailers and Spotswood Trailers Intelligence form part of the commercial activities of INTJ Billing Pty Ltd, ABN 30 607 261 398.
Can I ask whether a report suits my needs first?
Yes. Contact us before purchasing if you want to confirm whether a report is appropriate for your decision.
Can you analyse our own fleet, corridor, depot, property or OOH site?
Yes. The fixed reports are the starting point; organisation-specific commercial traffic and freight analysis can be scoped separately.