Independent Victorian freight evidence platform Coverage, operator intelligence, West Gate evidence and governed downloads connected
Independent analytical platform. Prepared by Traffic Analytics / Spotswood Trailers; not an official publication of the Victorian Transport Association or Victorian Government. Connected release · 8 August 2026 · Stage 23A.4.0 + governed WGT update
Spotswood Trailers
Prepared and published by Spotswood Trailers · Traffic Analytics

Independent Victorian freight intelligence developed from long-term SCATS traffic movements, classified TIRTL freight observations and governed analytical releases.

Independent evidence Melbourne, Victoria
Independent Victorian freight evidence

Evidence for a more productive, resilient and future-ready freight network.

A decision platform combining long-term SCATS traffic movements and TIRTL classified freight observations to reveal where Victoria’s network is under pressure, how performance is changing and where investment and further investigation may deliver the greatest value.

12+ yearsSCATS history
3.13B+TIRTL records
159.6M+classified truck passings
Statewidemonitored scope
Freight decision gateway

What are you trying to decide?

Choose the route closest to your role. Each path starts with a practical answer and then connects directly to the governed evidence behind it.

One evidence platform. Four ways to use it. Operators can protect margins, industry can strengthen advocacy, public bodies can examine accountability, and reviewers can inspect every evidence boundary.
Not sure where to begin? Start with the five current findings, then follow the evidence route most relevant to your decision.
Start with the key findings
Data coverage and freshness

Exactly what dates does the evidence cover?

The platform keeps official source availability, records used by the governed releases and the longer SCATS history deliberately separate. These dates are not interchangeable.

Core frozen Stage 23A.4 TIRTL analytical window 1 November 2025 to 21 May 2026 · 202 inclusive days · frozen Stage 17–23A.4 / Commercial Gold release family
Core frozen analytical family 1 Nov 2025 → 21 May 2026

Stage 17 through Stage 23A.4 and Commercial Gold remain frozen to this governed cutoff. Their results are not silently extended by newer source files.

WGT governed combined release 15 Dec 2025 → 1 Aug 2026

565_E / 566_E BASE+UPDATE analysis: 180 accepted days and 129 accepted weekdays. Truck rule vehicle_class >= 4; BASE and UPDATE reconciliation PASS_EXACT.

Official TIRTL source availability 1 Nov 2025 → 4 Aug 2026

Official source availability can extend beyond a governed analytical release. A later source date does not automatically alter a frozen result.

Publication pipeline

Where does the newest source data sit?

Platform page updated 8 August 2026
Official source available through4 August 2026Published by the Department of Transport and Planning.
Core frozen Stage 23A.4 cutoff21 May 2026Latest date represented by the frozen Stage 17–23A.4 and Commercial Gold release family.
Latest downloaded source date4 August 2026Latest source date explicitly recorded as downloaded by this public release manifest.
Latest future-release validation4 August 2026Latest source date explicitly recorded as quality-checked for a subsequent governed release.

Publication rule: the frozen Stage 17–23A.4 / Commercial Gold findings remain governed through 21 May 2026. The WGT 565_E / 566_E screenline is a separately governed BASE+UPDATE release through 1 August 2026, published only after exact raw-versus-aggregate reconciliation and quality gating. Later source files do not silently alter either release.

Classified traffic and freight

TIRTL coverage

Infra-red traffic loggers count, classify and measure the speed of passing vehicles. Published records are aggregated into 15-minute bins by site, heading, Austroads class and speed bin.

Official Transport Victoria source availability 1 November 2025–4 August 2026 Last updated 5 August 2026 · updated daily
Official source duration 277 days 39 weeks and 4 days
Calendar months represented 10 November 2025 to August 2026; first and last months are partial
Core frozen Stage 23A.4 period 202 days 28 weeks and 6 days
Governed record scale 3.13B+ 159.6M+ classified truck passings
Open the official DTP TIRTL source
Long-term signal movement history

SCATS coverage

SCATS contributes the long-run traffic-movement context used to understand network pressure, local-road change and the relationship between general traffic and freight.

Current platform coverage 2014–7 April 2026 12+ years of history · 517 Victorian suburbs
Coverage begins 2014 Earliest year represented in the current platform
Latest record 7 April 2026 Current SCATS platform cutoff
Duration 12+ years Earliest coverage is currently expressed to year precision.
Resolution 15-minute Signal-derived movement observations

Important: SCATS movements are signal-derived movement observations. They should not be described as simple unique-vehicle counts.

TIRTL coverage timelineOfficial availability versus the core frozen Stage 23A.4 period

The public source continues beyond the core frozen Stage 23A.4 window. The WGT screenline update is a separately governed BASE+UPDATE release through 1 August 2026; it does not retroactively alter the frozen Stage 17–23A.4 results.

1 Nov 2025Official source begins
14 Dec 2025West Gate Tunnel opens
21 May 2026Core frozen release ends
4 Aug 2026Latest official source date
Official DTP source: 277 days Core frozen Stage 23A.4 window: 202 days
01

Officially available

What the Department of Transport and Planning has published through its daily-updated TIRTL Open Data collection.

02

Core governed release

The frozen Stage 17–23A.4 / Commercial Gold period after completeness, density, outage and evidence-class safeguards.

03

Used in this analysis

Each section carries its own governed period. The WGT combined screenline release extends through 1 August 2026 after separate BASE+UPDATE validation; core frozen products remain through 21 May 2026.

Detailed governed TIRTL coverageOpen dates, releases and quality context
Core frozen start1 November 2025
Core frozen end21 May 2026
WGT combined start15 December 2025
WGT combined end1 August 2026
WGT accepted days180
WGT accepted weekdays129
Overnight window10:00 pm to 6:00 am
Reference classificationMixed opening-transition period
Pre-opening nights43
Nights on/after opening159
Site-headings examined562
Robust site-headings283
Governed paired sites119
Tier A speed headings269
Complete speed hours374,900
Broadly excluded nights20
Governed data coverage periods and analytical uses
Public evidence sectionPeriodDurationWhat the period supports
Overnight freight rankingsStage 17 1 Nov 2025–21 May 2026 202 days Direction-level recorded overnight TIRTL rankings and evidence classes.
Political accountabilityStage 20.2 1 Nov 2025–21 May 2026 202 days Corrected community and strategic-network exposure joined to political geography.
Temporal pressureStage 21 1 Nov 2025–21 May 2026 202 days Complete eight-hour overnight onset, persistence and release profiles.
Two-way corridor evidenceStage 22.0.1 1 Nov 2025–21 May 2026 202 days Governed paired-site two-way volume, balance, dominance and persistence.
Speed pressure and reliabilityStage 23A.4.0 1 Nov 2025–21 May 2026 202 days Tier A governed point-speed pressure, hourly reference and reliability evidence.
Freight operator commercial intelligenceCommercial Gold 1 Nov 2025–21 May 2026 202 days Operator-facing screens derived from governed Stage 22 and Stage 23A.4 evidence.
West Gate Tunnel governed screenline updateWGT BASE + UPDATE 15 Dec 2025–1 Aug 2026 180 accepted days 565_E / 566_E eastbound Brooklyn screenline trend, recent accepted-weekday headline metrics and mature-period comparison; 129 accepted weekdays.
Coverage safeguardOverall dates do not imply continuous coverage at every location.

The overall date range does not mean every detector or heading operated continuously. Devices can experience outages, commissioning or decommissioning, and individual locations can have different temporal ranges. Missing intervals are not interpreted as zero traffic. Sensor passings are not unique vehicles or complete journeys.

Official TIRTL source and licence Department of Transport and Planning — TIRTL Traffic Counts and Classification

Official Victorian Open Data collection, updated daily and licensed under Creative Commons Attribution 4.0.

Operational evidence platform

A working evidence layer for freight advocacy and investment decisions.

The platform turns billions of observations into clear, defensible answers for government engagement, infrastructure planning, freight operations and public communication.

Priority freight corridors Ranked by strategic freight evidence
Classified truck passings Represented by ranked corridors
Abnormal network episodes Speed–flow episodes indexed
01

Productivity

Where are freight speeds, reliability and operating windows deteriorating—and what is the measurable cost to network performance?

SCATSTIRTL
02

Resilience

How do closures, major projects and abnormal events redistribute traffic across the network, and how quickly does freight recover?

TIRTLDisruptions
03

Infrastructure

Which corridors perform a critical freight function, and is road, bridge and intersection investment aligned with measured demand?

Combined evidence
04

Decarbonisation

Where do low speeds and stop-start conditions create inefficient operating environments, and where could interventions improve them?

Speed–flowTruck share
Start here

The five findings that define the current connected release.

Loading release details...
Executive briefing sentence

Loading the current evidence statement...

Open the corrected evidence
Choose an evidence route Move from the conclusion to the proof.
Current release files Take the briefing or inspect the underlying evidence.
Strategic case for VTA

One independent evidence capability. Four freight priorities.

The connected platform presents a boardroom-ready case for productivity, resilience, decarbonisation and data-led freight planning.

Loading showcase metrics…
Loading strategic alignment…
Connected visual layer Initialising maps and analytical charts

Checking Leaflet maps, Google Charts and connected SCATS/TIRTL evidence.

0/6charts rendered
0/2maps rendered
0connected records
Network intelligence map

See freight function, pressure and opportunity in place.

The connected layers show ranked freight corridors, combined SCATS–TIRTL pressure points, quality-labelled overnight TIRTL evidence and major-project monitoring locations.

Connected data Leaflet · OpenStreetMap
Loading network map Leaflet · OpenStreetMap
Mapped points represent monitored locations or analytical centroids. TIRTL values are classified sensor passings, not unique vehicles or complete journeys.
Overnight freight rankings

Compare where recorded overnight truck activity is most intense.

Only robust recorded series receive a statewide rank. Short, intermittent, limited and unavailable evidence remains visible separately rather than being forced into the league table.

#1 recorded overnight directionLoading…
Shortest average truck intervalLoading…
Robust ranked directionsLoading…Statewide comparisons exclude non-robust evidence.

Busiest overnight freight directions

Loading ranking data… Click “Map” to open the location in the Overnight freight layer.
Overnight freight ranking results
Ranking method. Figures are classified TIRTL sensor passings recorded between 10:00 pm and 6:00 am. They are not unique vehicles or complete journeys. Missing source rows are not treated as zero, overnight record presence is not described as independent sensor coverage, broad network-gap nights and daylight-saving transition nights are excluded, and only ROBUST_RECORDED_SERIES headings receive a statewide rank.
Explore all 562 site-headings, including unranked and unavailable evidence
All TIRTL site-heading evidence including unranked and unavailable records
Corridor evidence profiles

Move from a statewide view to a specific freight case.

Profiles combine only compatible connected records. Missing fields remain visibly unavailable rather than being inferred or silently substituted.

Loading corridor profiles…
Western freight showcase

Loading western freight evidence…

Political accountability

Who carries the measured overnight freight burden?

Corrected corridor-direction evidence is joined to Victorian local and state political boundaries, with community-facing roads separated from controlled-access network throughput.

Loading political-geography evidence...

Checking mapped headings, boundary coverage and assignment safeguards.

Headline evidenceLeading monitored political areas

Rankings describe the available monitored evidence and retain explicit coverage qualifications.

Political geography
Evidence view
Political evidence mapCommunity-facing freight evidence
Exact polygon joins

Boundary colour describes the selected evidence measure. Grey areas indicate insufficient evidence or unavailable monitoring, not a measured absence of freight.

Community-facing exposureLoading rankings...
0 areas
Political geography freight evidence rankings
Loading political-area evidence...
Evidence coverageSeparate measured pressure from monitoring gaps

The coverage classification prevents unmonitored political areas from being misreported as low-burden areas.

Interpretation safeguards

What the political rankings do - and do not - prove

Evidence downloads

Inspect the source and coverage tables

When it happens

When overnight freight pressure builds - and how long it lasts

Eight-hour profiles show the onset, persistence and morning peak of corrected corridor-direction freight pressure, with incomplete hours, network outages and source-boundary nights excluded.

Loading Stage 21 temporal evidence...

Checking complete-hour semantics, exclusions and governed thresholds.

Road context
Community-facing persistence Loading rankings...
0 units
Temporal freight pressure rankings
Loading temporal rankings...

Selected corridor-direction Loading hourly profile...
Community-facing
Political timing accountability Where persistent overnight pressure sits

These rankings count corrected corridor-direction components with persistent timing evidence. Only 48 political areas currently contain robust Stage 21 timing evidence.

Political timing accountability rankings

Areas absent from these timing rankings are not zero-burden areas. Stage 20.2 coverage classifications remain the authority for monitoring adequacy.

Data integrity Twenty nights excluded before timing calculations
Interpretation safeguards

What these time profiles mean

Two-way corridor evidence

What happens when both carriageways are measured together?

Stage 22 pairs complementary robust monitoring locations, requires complete records in both directions and distinguishes balanced two-way burden from one-direction dominance.

Road context
Community-facing whole sitesCombined overnight freight
Two-way corridor freight evidence rankings

Selected paired siteLoading paired profile...
Direction A Direction B Per-direction pressure threshold
Political whole-site accountabilityWhere persistent two-way burden is concentrated

Political rollups include only paired sites with at least 30 eligible nights and exact same-polygon assignments for both carriageways.

Two-way political-area evidence rankings
Pairing governanceFive candidates remain outside public metrics
Truck operating-speed pressure

See where overnight truck speeds fall below each location's own upper-normal operation.

Tier A detector headings are compared with a frozen heading-and-hour P85 observed speed. Community and strategic-network contexts remain separate, and the result is an operating-pressure indicator rather than a journey-delay estimate.

-Tier A headings
-reference-ready heading-hours
-complete speed hours
-eligible heading-nights
60-second decision brief

What a minister, MP or adviser should remember.

About 60 seconds
Bottom line

Loading the governed decision summary...

1
Pressure is concentrated

Loading...

2
The leading network pattern persists

Loading...

3
There is a clear community-road standout

Loading...

Questions worth putting to agencies
  1. What operational, roadwork, incident, merge or capacity conditions explain the recurring patterns at the named locations and hours?
  2. Which directions and overnight windows should receive targeted operational investigation first?
  3. Will performance be reported monthly against the frozen baseline rather than redefining the benchmark each month?
Ready-to-quote line
Loading the governed quote...
-governed Tier A headings
-complete speed hours
-eligible heading-nights

Use the evidence to prioritise explanation and investigation. Do not describe the pressure index as journey delay, economic loss or truck-hours lost.

How to read the ranking

A higher score means the detector heading operates below its own P85 reference more frequently or severely. It does not necessarily have Victoria's lowest absolute speed.

Community pressureGoverned Tier A ranking

Governed operating-speed pressure and reliability rankings
Loading ranking evidence...
Heading evidence profile

Inspect the eight-hour pattern behind a ranking.

Worst eligible nights

Tier B

Long-period descriptive evidence

Twelve headings remain descriptive and unranked because nightly truck density is lower.

Tier C

Sparse evidence exclusions

Sneydes Road eastbound and westbound remain excluded from public comparative speed products.

Method and thresholds

Interpretation boundaries

    Controlled method note

    West Gate Bridge remains Tier A.

    The complete 25,767-row legacy validation passed. The two governed synthetic bridge assets retain a controlled method exception that does not by itself remove either direction from ranking.

    Executive graph suite

    See the pressure, timing and reliability evidence visually.

    Eight curated graphs summarise the governed Stage 23A.4 baseline. The complete evidence gallery contains all 48 executive and heading-level graph designs.

    Open all 48 graphs
    Executive ranking

    Community-road operating-speed pressure

    All 12 governed Tier A community headings, ranked against their own heading-and-hour P85 references.

    Open full size
    Executive ranking

    Top 20 strategic-network operating-speed pressure headings

    Colour indicates governed pressure severity; labels show threshold occurrence and sustained nights.

    Open full size
    Relationship

    Operating-speed pressure versus night-to-night reliability

    High-right points combine frequent speed pressure with large variation between better and worse nights.

    Open full size
    Hourly heatmap

    Community-road hourly pressure heatmap

    Rows follow the community pressure ranking; cells show the hourly pressure index.

    Open full size
    Hourly heatmap

    Top 30 network headings: hourly pressure heatmap

    The colour progression runs from lower pressure through amber and orange to severe red.

    Open full size
    Reliability interval

    Community-road night-to-night reliability ranges

    Thin line is P10–P90, thick line is P25–P75, and the diamond is the median nightly ratio.

    Open full size
    Reliability interval

    Top 20 network reliability-risk headings

    Longer intervals indicate greater variation between better and worse eligible nights.

    Open full size
    Governance

    Governed speed-evidence tiers

    The 283 robust headings partition into full temporal, aggregate-only and sparse evidence.

    Open full size
    Interpretation boundaryThese are detector point-speed pressure and reliability graphs. They do not calculate journey delay, monetary loss or truck-hours lost.

    Evidence downloads

    Inspect the governed analytical release and supporting tables.

    Freight operator profit and cost intelligence

    Ten commercially important questions the governed data can answer now.

    The evidence can already identify cheaper operating windows, recurring pressure, unreliable lanes, quoting-risk candidates, schedule-contingency classes, fuel-and-wear exposure signals, directional imbalance and high-volume two-way freight opportunities.

    Commercial gold — with disciplined boundaries

    These findings can improve dispatch, quoting, customer-window negotiation, contingency planning and sales targeting. They do not yet calculate exact dollars, litres, journey-time savings or truck-hours.

    269Tier A headingsInteractive operating-window lookup
    2,152governed heading-hoursEight overnight hours per heading
    119paired freight sitesTwo-way flow and imbalance evidence
    10commercial questionsAnswered with current evidence
    CG-014:00 am-5:00 am

    What overnight hour has the lowest measured operating pressure across the governed Tier A network?

    Across all 269 Tier A headings, this hour has the lowest mean pressure index at 2.43, mean speed at 98.1% of reference and mean below-90% occurrence of 3.6%.

    Operator action

    Test flexible departures in this window, then use the heading lookup because the best hour varies by location.

    Interpretation boundary

    This is a network-wide overnight average, not a guarantee for every route or a complete journey-time result.

    CG-02Tullamarine FWY Inbound - Before Mickleham Rd (SB)

    Which monitored network heading has the greatest recurring truck-speed pressure?

    Pressure index 56.03; below 90% of its own hourly reference during 75.5% of eligible hours; sustained pressure on 76.9% of eligible nights.

    Operator action

    Prioritise departure-time review, quoting review and route-specific operational investigation for work exposed to this heading.

    Interpretation boundary

    The pressure index is relative point-speed pressure, not journey delay or a dollar loss.

    CG-03Tullamarine FWY Outbound - After Mickleham Rd Exit (NB)

    Which monitored network heading is least reliable from night to night?

    Its nightly P90-P10 observed-to-reference spread is 32.6 percentage points, with pressure index 41.65.

    Operator action

    Use a larger evidence-based contingency class and avoid promising the same tight arrival window used on stable lanes.

    Interpretation boundary

    The evidence supports a relative contingency class, not an exact number of buffer minutes.

    CG-04Tullamarine FWY Inbound - Before Mickleham Rd (SB) — SEVERE REVIEW

    Which lanes should receive the first route-pricing risk review?

    The screening class combines governed pressure, night-to-night spread, sustained pressure and severe below-reference occurrence. The page lists the leading 20 candidates for commercial review.

    Operator action

    Review quoted allowances, fixed time windows, waiting clauses and corridor-risk terms before changing actual prices.

    Interpretation boundary

    This is a risk-screening class, not a recommended tariff or proof that an existing contract is unprofitable.

    CG-05Tullamarine FWY Outbound - After Mickleham Rd Exit (NB) — LARGEST CONTINGENCY CLASS

    Which lanes justify the largest schedule-contingency class?

    The class is driven by nightly reliability spread, sustained-pressure frequency and longest pressured runs.

    Operator action

    Apply larger contingencies only to genuinely variable lanes and reduce unnecessary padding on stable lanes.

    Interpretation boundary

    No minute value is assigned because journey distance, customer time and operator practices are not in the dataset.

    CG-06M80 - WRR East of Mahoneys Rd GB

    Which monitored headings provide a lower-risk operating benchmark?

    The leading lower-risk benchmark has pressure index 0.00, nightly reliability spread 1.4 points and observed speed at 98.7% of reference.

    Operator action

    Use low-risk headings as operational benchmarks and compare candidate times or corridors before dispatch.

    Interpretation boundary

    A low-risk monitored heading is not automatically a valid alternative route; route connectivity and restrictions must be checked separately.

    CG-07WGB_OUTBOUND_W for severe-hour exposure

    Where is the signal for fuel and vehicle-wear exposure strongest?

    WGB_OUTBOUND_W is below 70% of reference during 30.4% of eligible hours. Tullamarine FWY Inbound - Before Mickleham Rd (SB) has the largest long-period observed-reference speed deficit at 16.5 km/h.

    Operator action

    Prioritise these locations for departure-time changes, telematics review and operator-specific fuel analysis.

    Interpretation boundary

    The current data identifies operating exposure; it does not calculate litres, maintenance dollars or emissions.

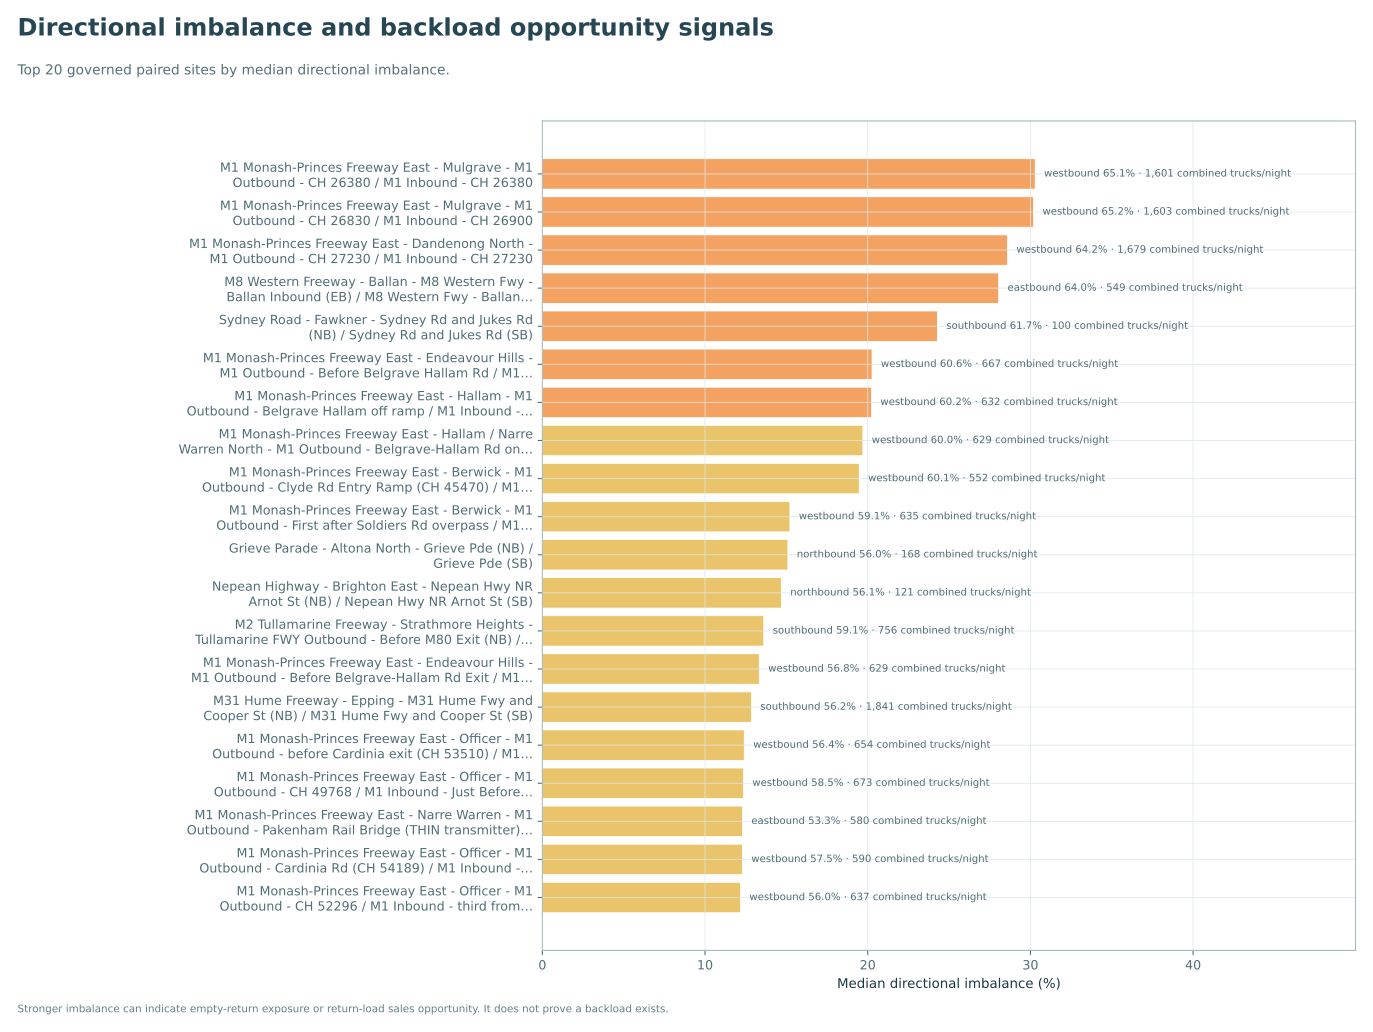
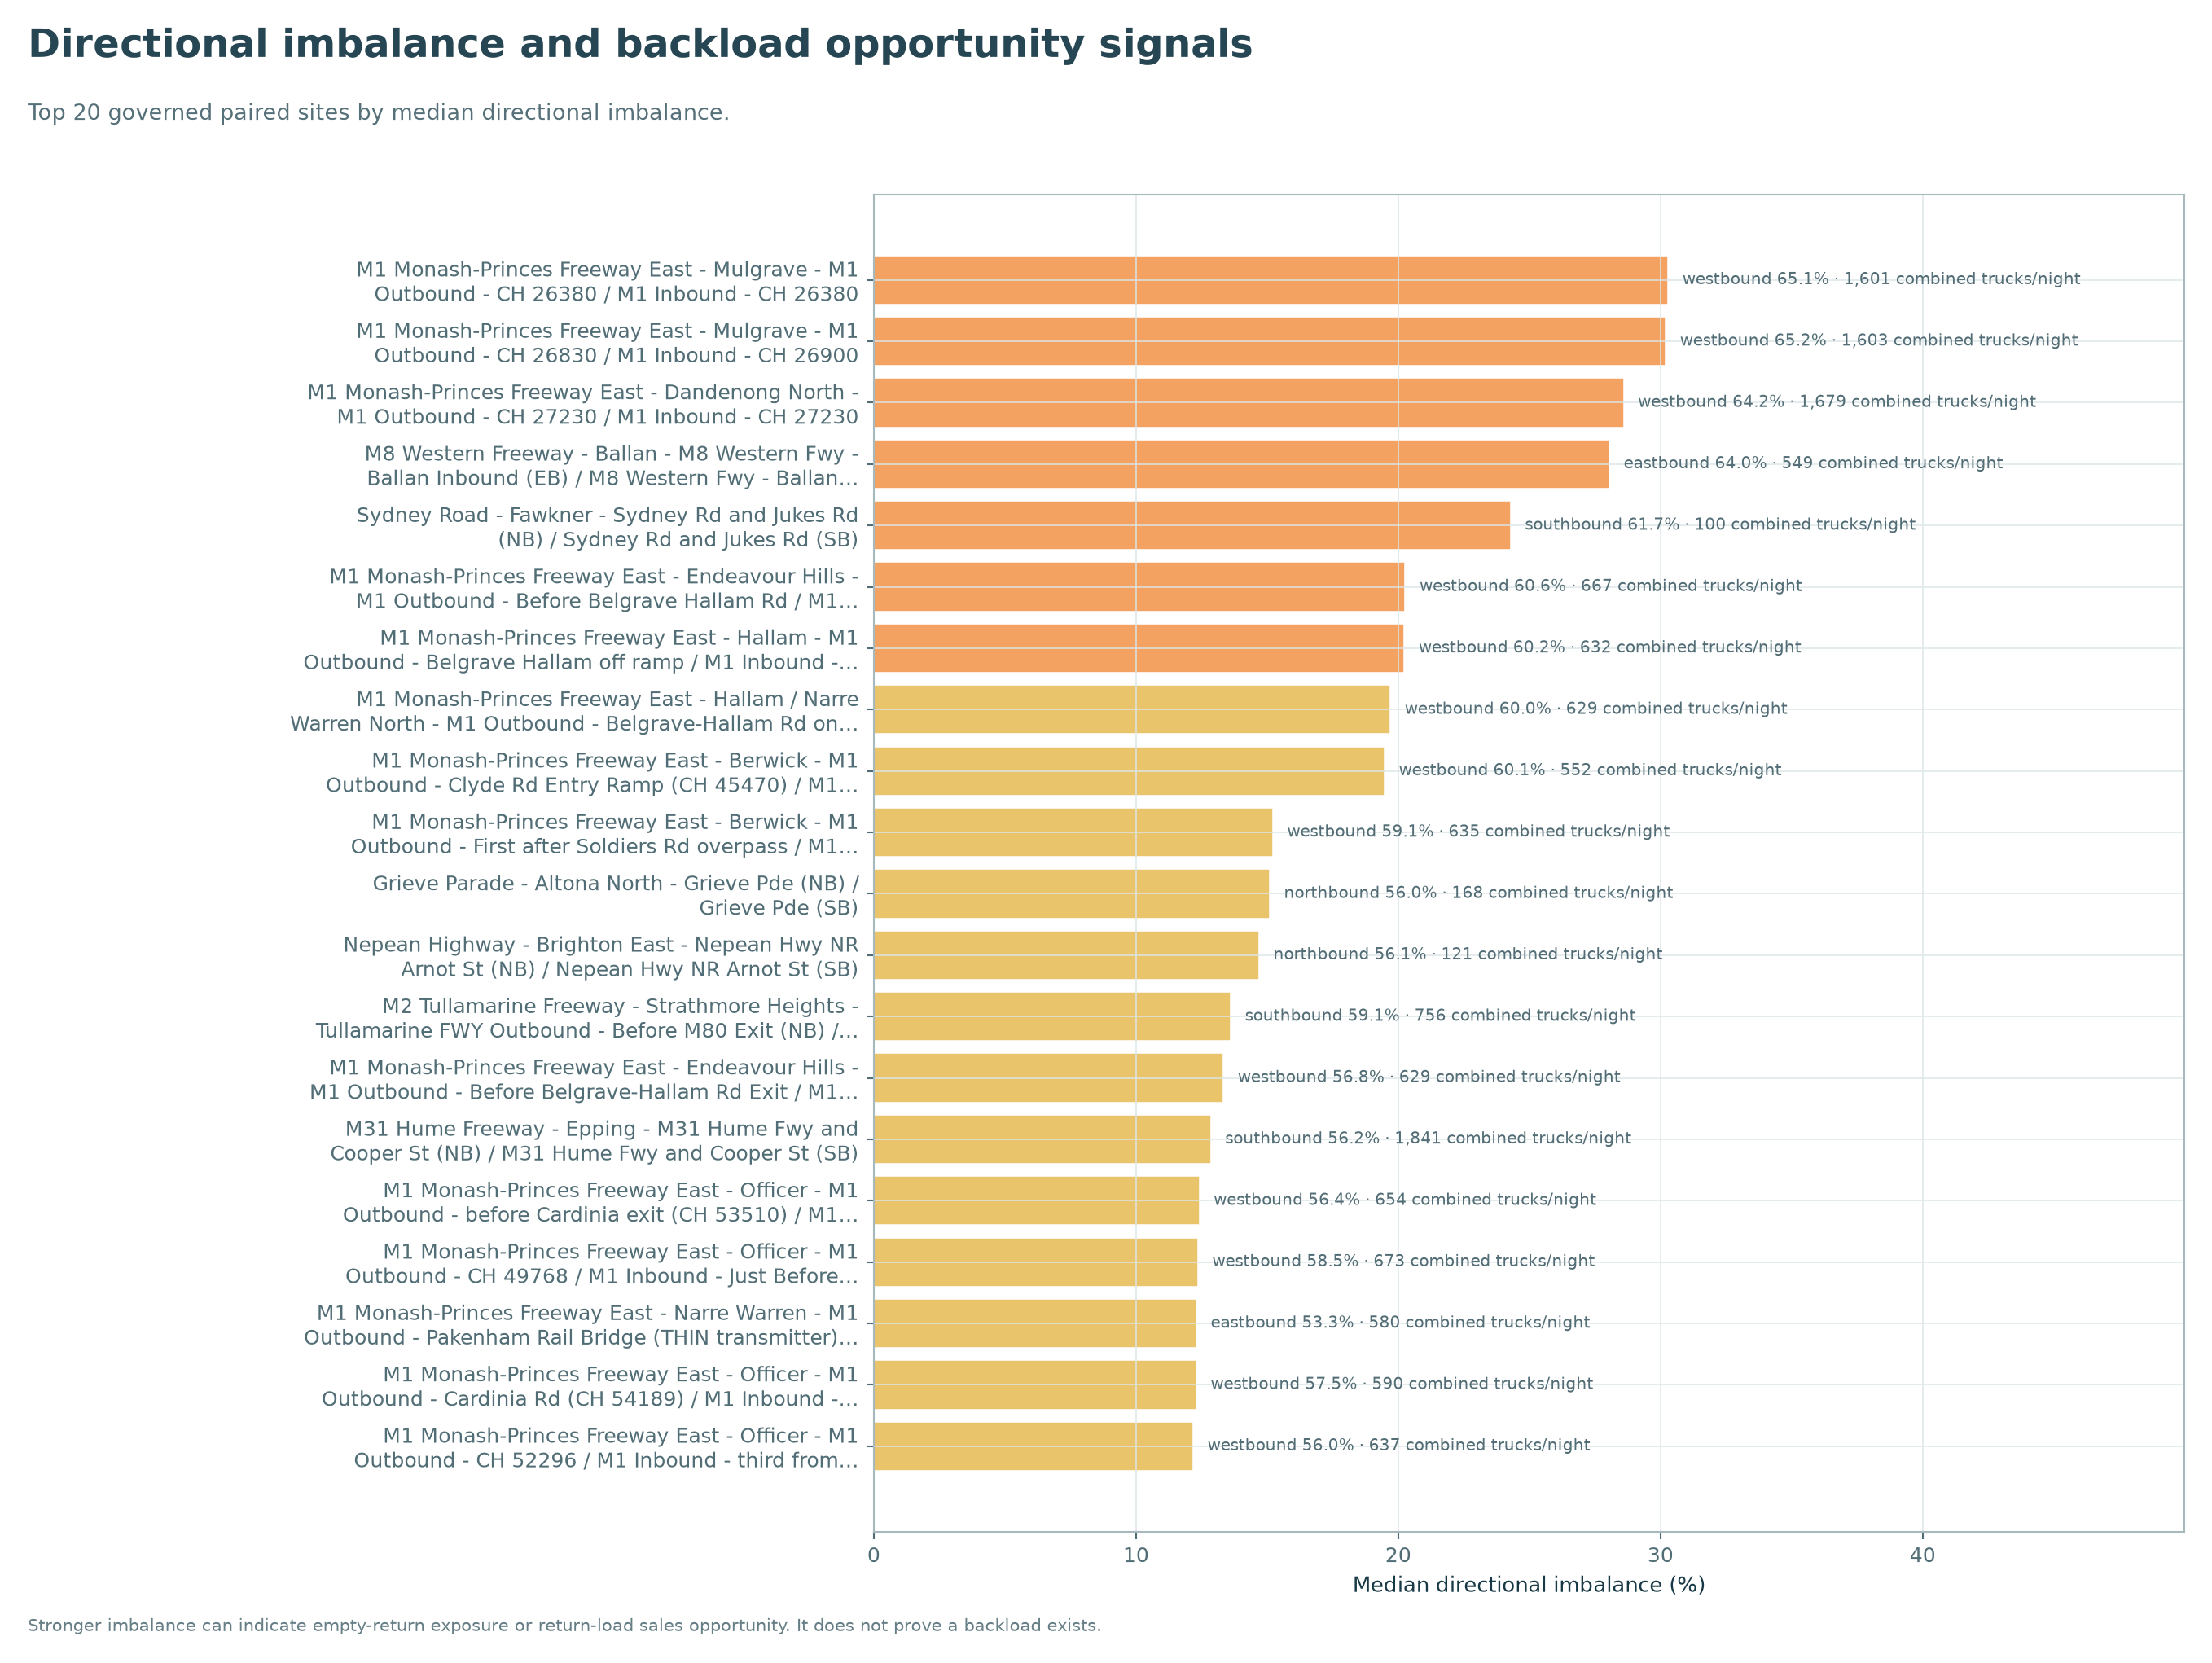
    CG-08M1 Monash-Princes Freeway East - Mulgrave - M1 Outbound - CH 26380 / M1 Inbound - CH 26380

    Where does directional imbalance suggest the strongest empty-return or backload risk signal?

    Median directional imbalance is 30.3%, with 65.1% in the dominant westbound direction.

    Operator action

    Target return-load sales and contract pairing toward the weaker direction, or ensure the dominant-direction job price covers likely empty running.

    Interpretation boundary

    Directional sensor imbalance is an opportunity signal; it does not prove that a backload is available.

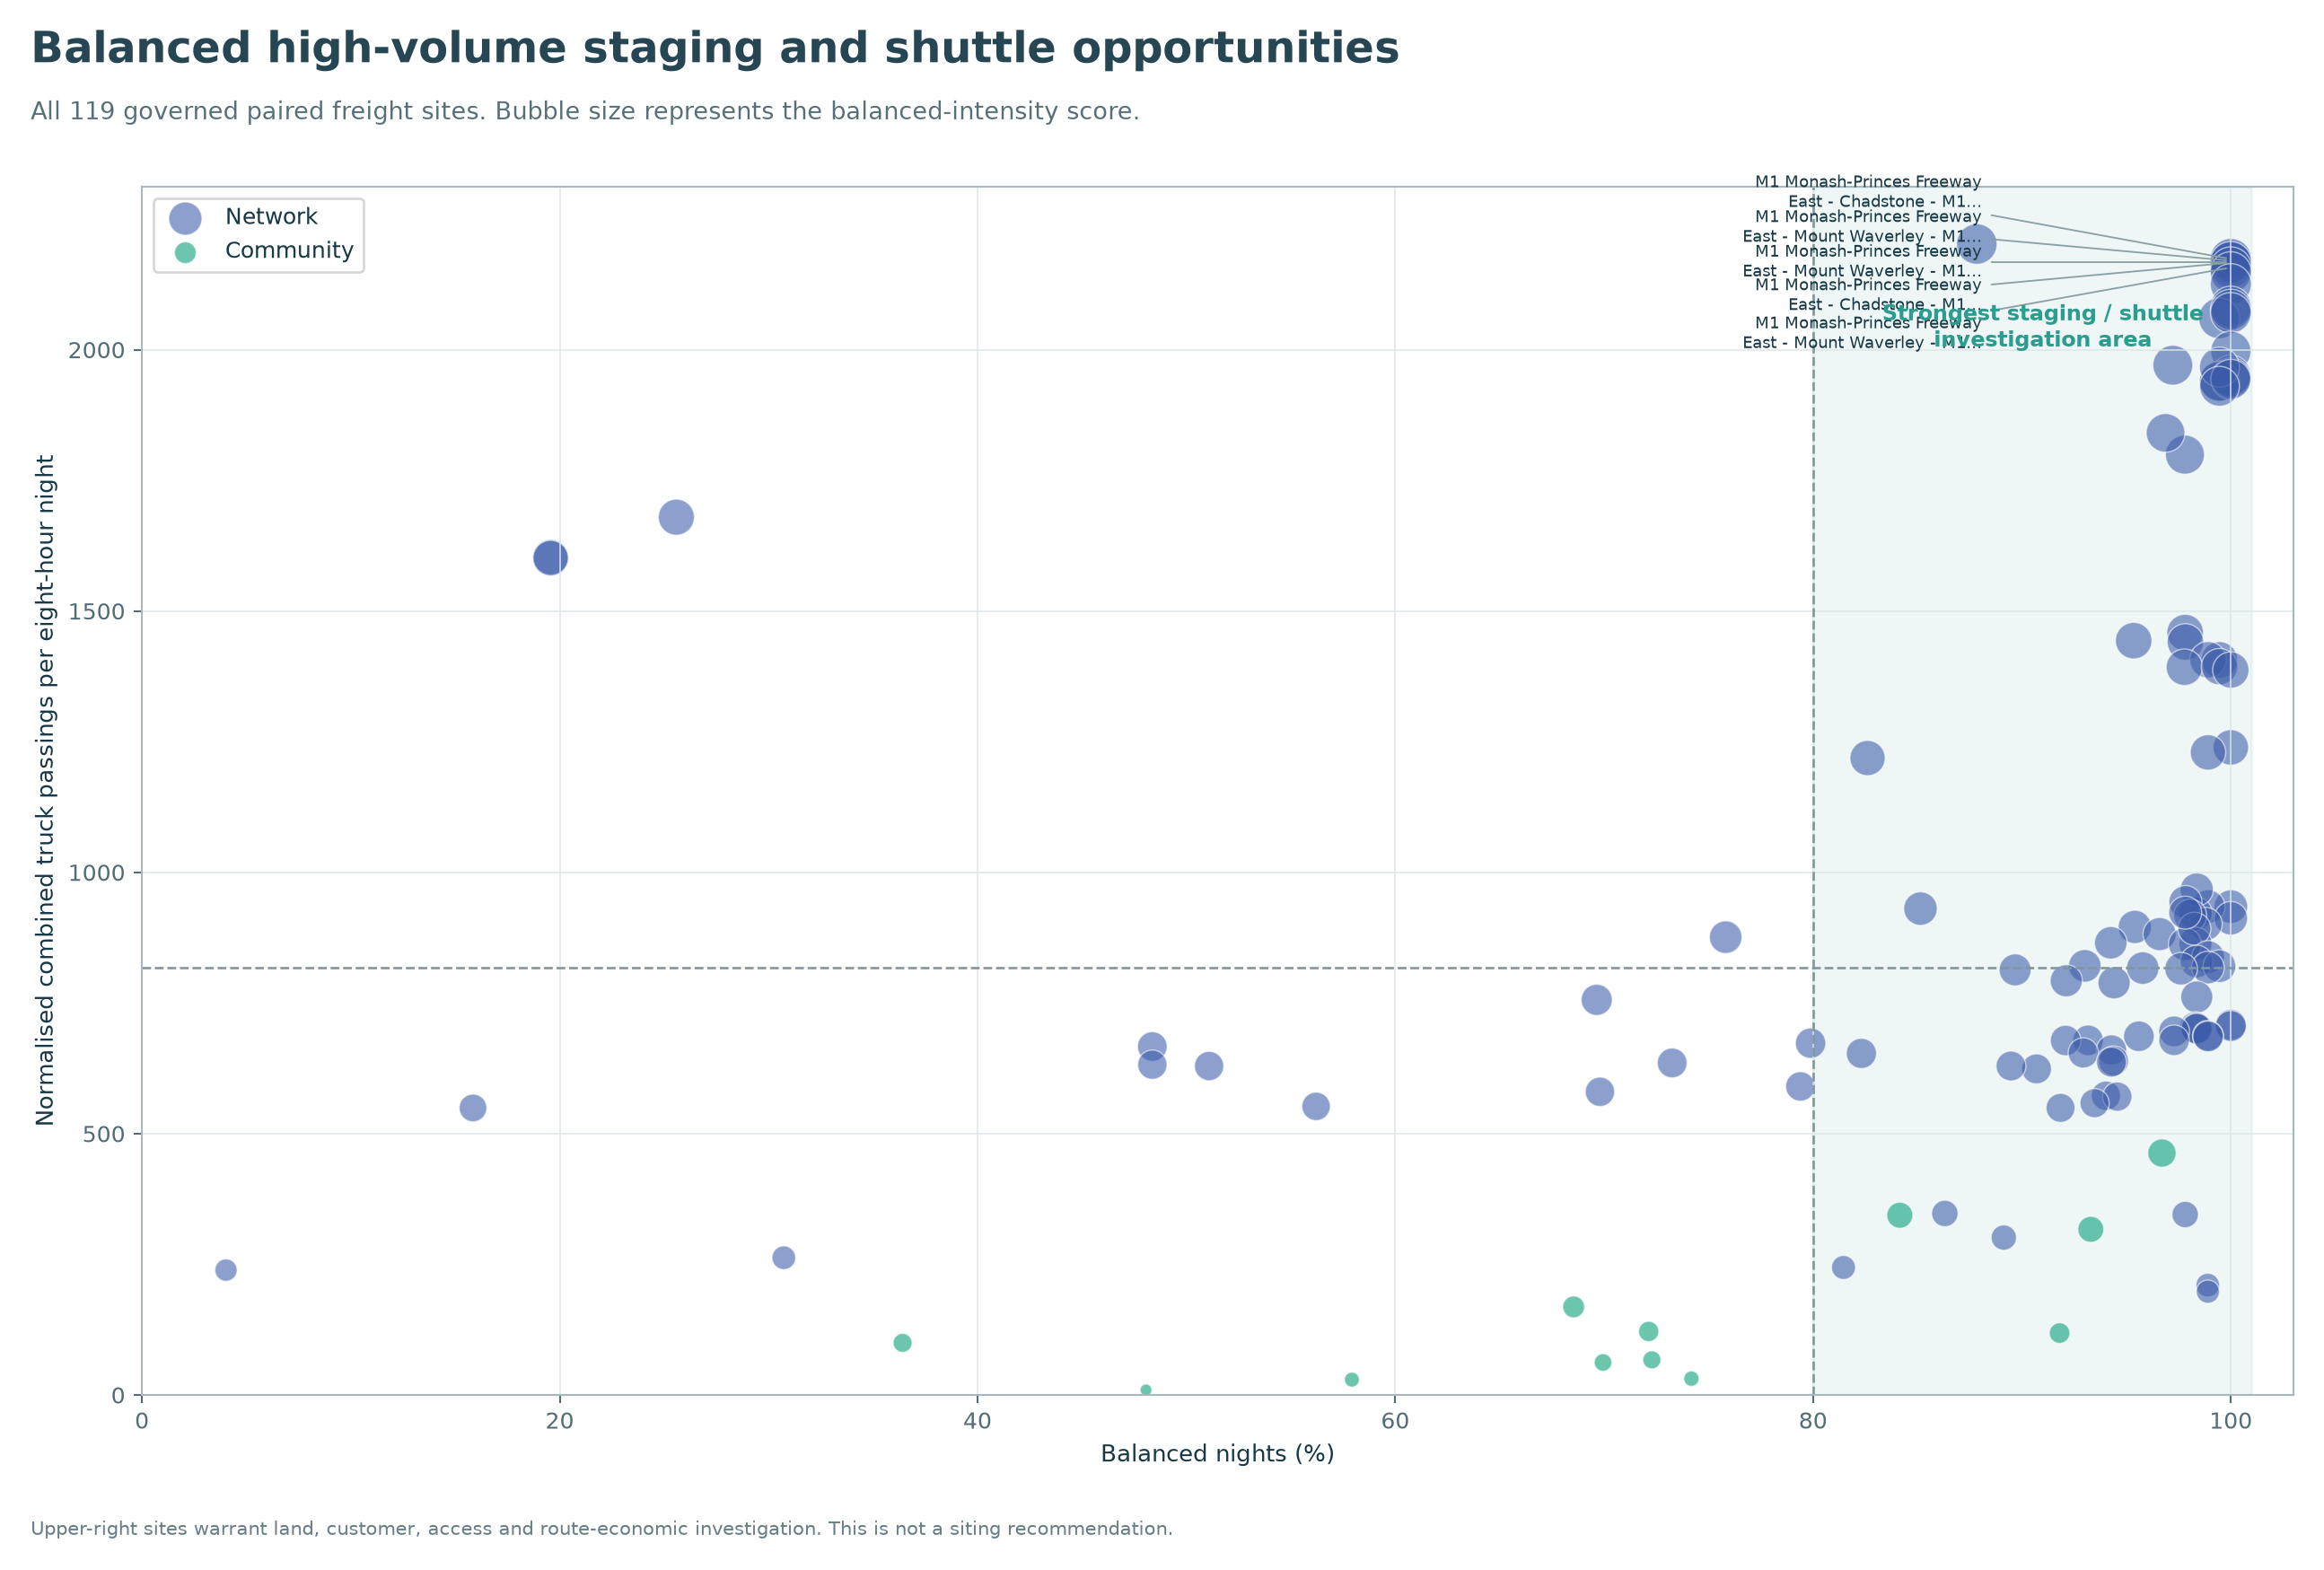
    CG-09M1 Monash-Princes Freeway East - Mount Waverley - M1 Outbound - CH 17390 / M1 Inbound - CH 17390

    Where does balanced high-volume activity support staging, shuttle or depot investigation?

    It averages 2,170.2 combined truck passings per normalised eight-hour night, 100.0% balanced nights and median imbalance of 2.5%. The highest combined-volume paired asset overall is West Gate Bridge - Corridor_Only - WGB_INBOUND_E / WGB_OUTBOUND_W at 2,202.1.

    Operator action

    Use these freight-flow signals to shortlist areas for shuttle, trailer-staging, cross-dock or depot investigation.

    Interpretation boundary

    A siting decision still requires land cost, customer locations, access restrictions, zoning and complete route economics.

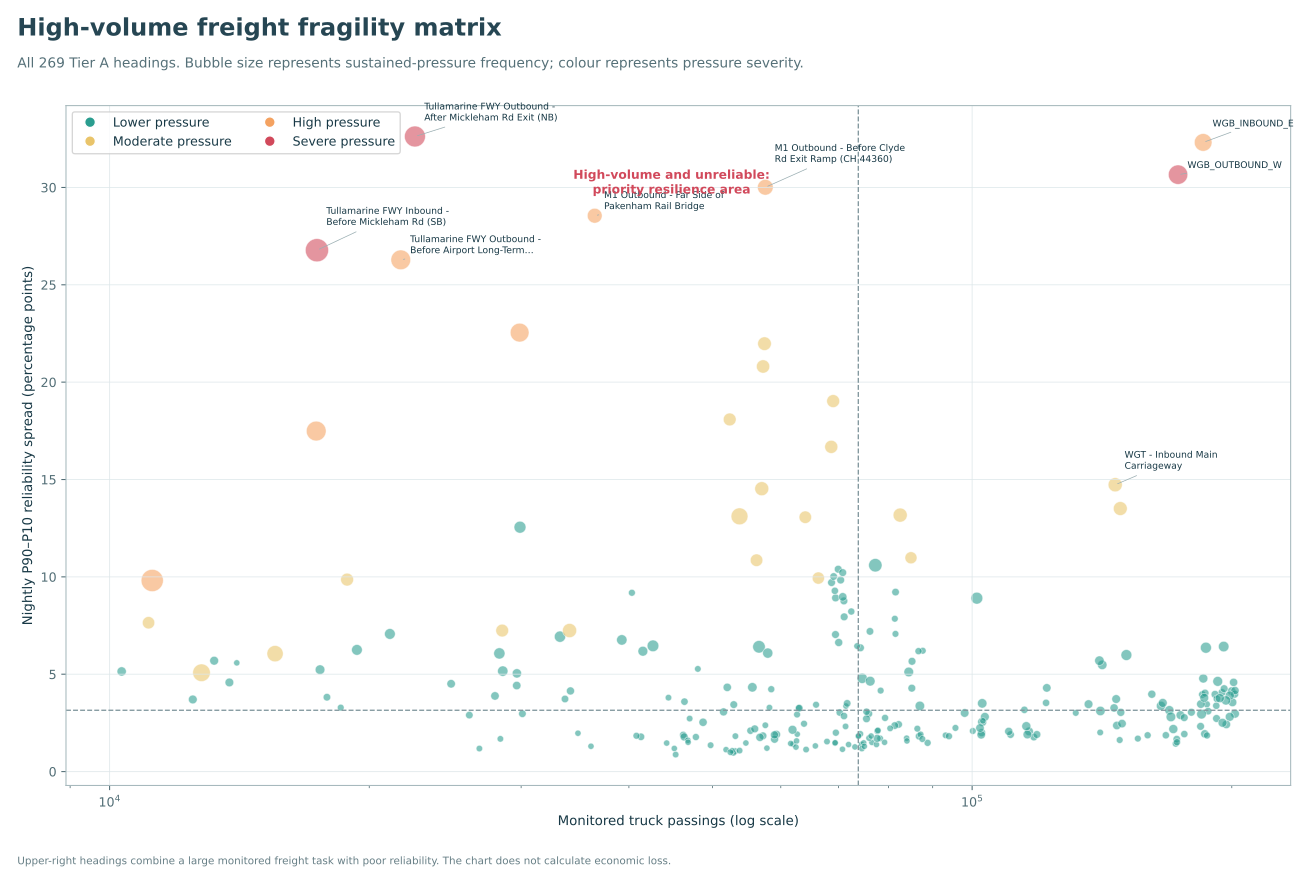
    CG-10Tullamarine FWY Outbound - After Mickleham Rd Exit (NB)

    Which locations need the strongest disruption and recovery playbooks?

    The leading reliability-risk heading has a 32.6-point nightly spread. West Gate Bridge inbound and outbound are also among the top three reliability-risk headings and both have recorded worst-night pressure runs spanning all eight overnight hours.

    Operator action

    Pre-plan customer notifications, departure holds and approved alternatives for jobs dependent on these locations.

    Interpretation boundary

    Worst-night and reliability evidence identifies fragility; it does not identify the external cause of each episode.

    Commercial evidence graphs

    Ten graphs that turn freight evidence into operating and commercial decisions.

    Each graph answers one of the Commercial Gold questions and includes a plain-language explanation for freight company owners, dispatchers, VTA members and policy decision-makers.

    Read the commercial implication—not only the chart.

    The sections beneath every graph explain what it shows, why it matters, how an operator can use it, why it matters to VTA and what the evidence cannot prove.

    CGG-01Operate more efficiently

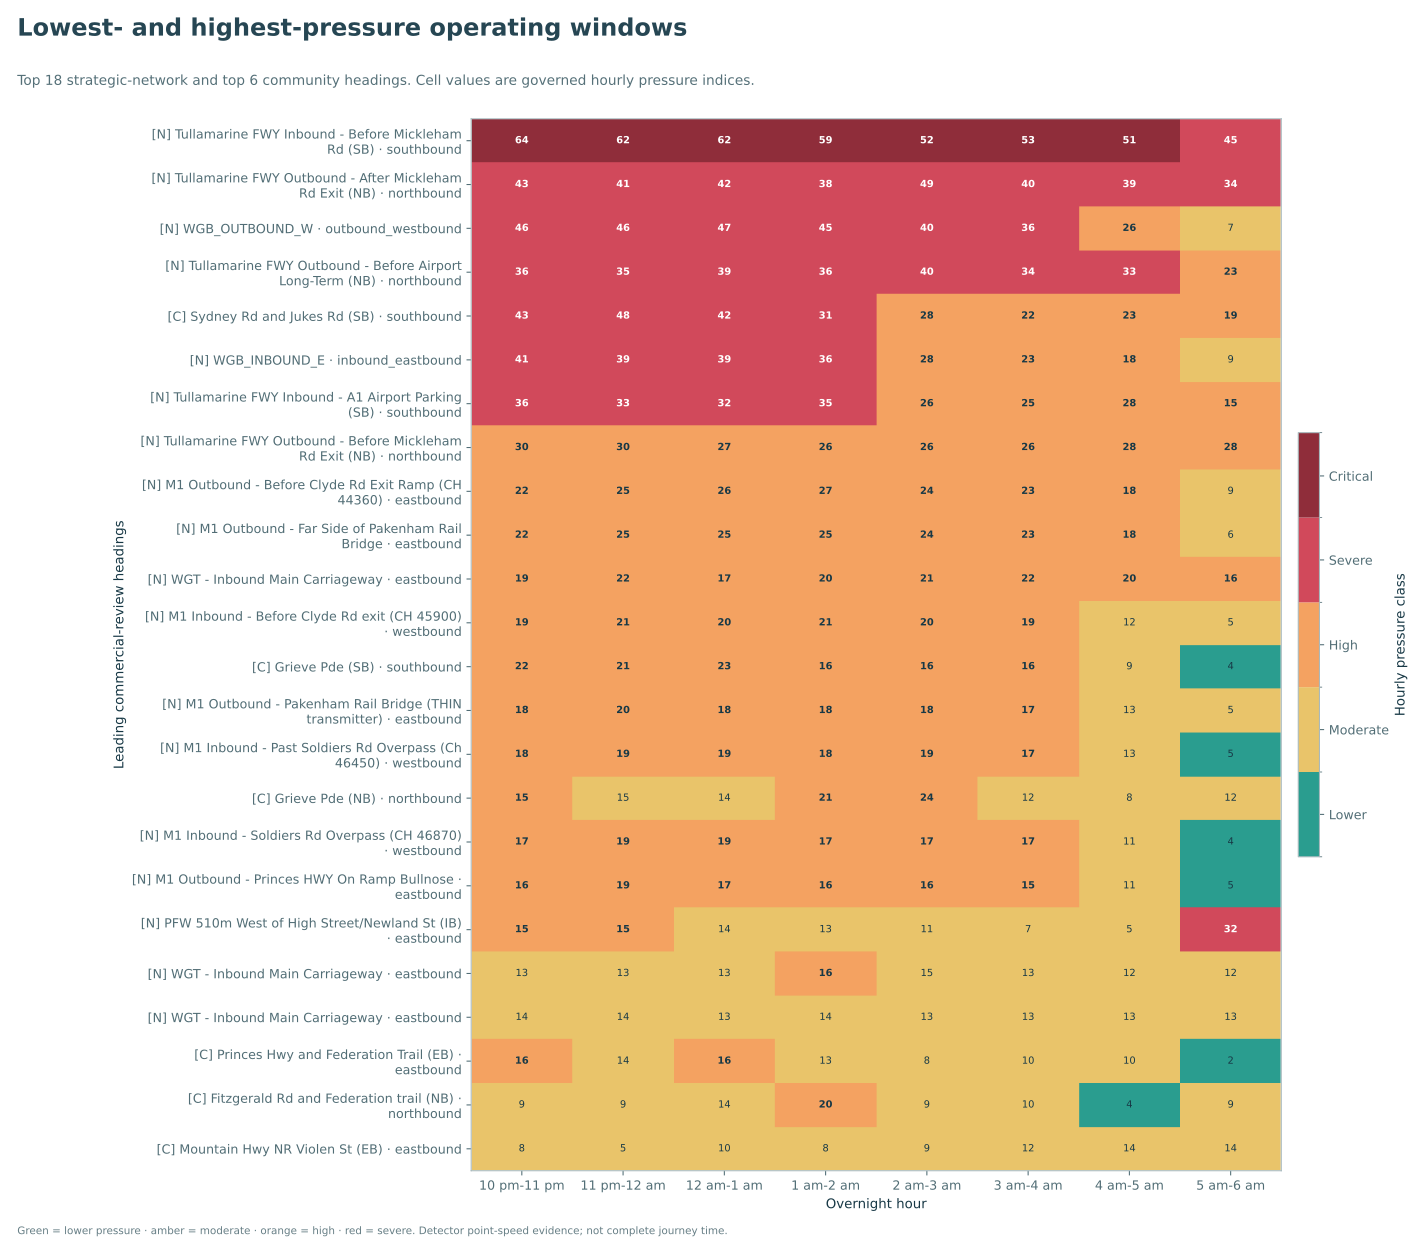
    Lowest- and highest-pressure operating windows

    When is the least pressured time to operate each commercially exposed heading?

    What this shows

    Hourly pressure from 10 pm to 6 am for the leading commercial-review headings. Green cells are lower-pressure windows; amber, orange and red indicate progressively greater pressure.

    Why it matters commercially

    A job moved by one or two hours can encounter a very different operating environment. This helps owners and dispatchers identify where customer appointment times may be adding avoidable risk.

    How operators can use it

    Use the greenest hour as the first window to test for flexible work, then confirm customer access, fatigue, curfew and route requirements.

    Why VTA should care

    Shows where receiving-hour flexibility, roadwork scheduling or freight-access policy could improve network productivity.

    Interpretation boundaryThe heatmap covers detector headings and point-speed pressure. It is not a complete journey-time forecast or a guaranteed saving.
    CGG-02Protect job margins

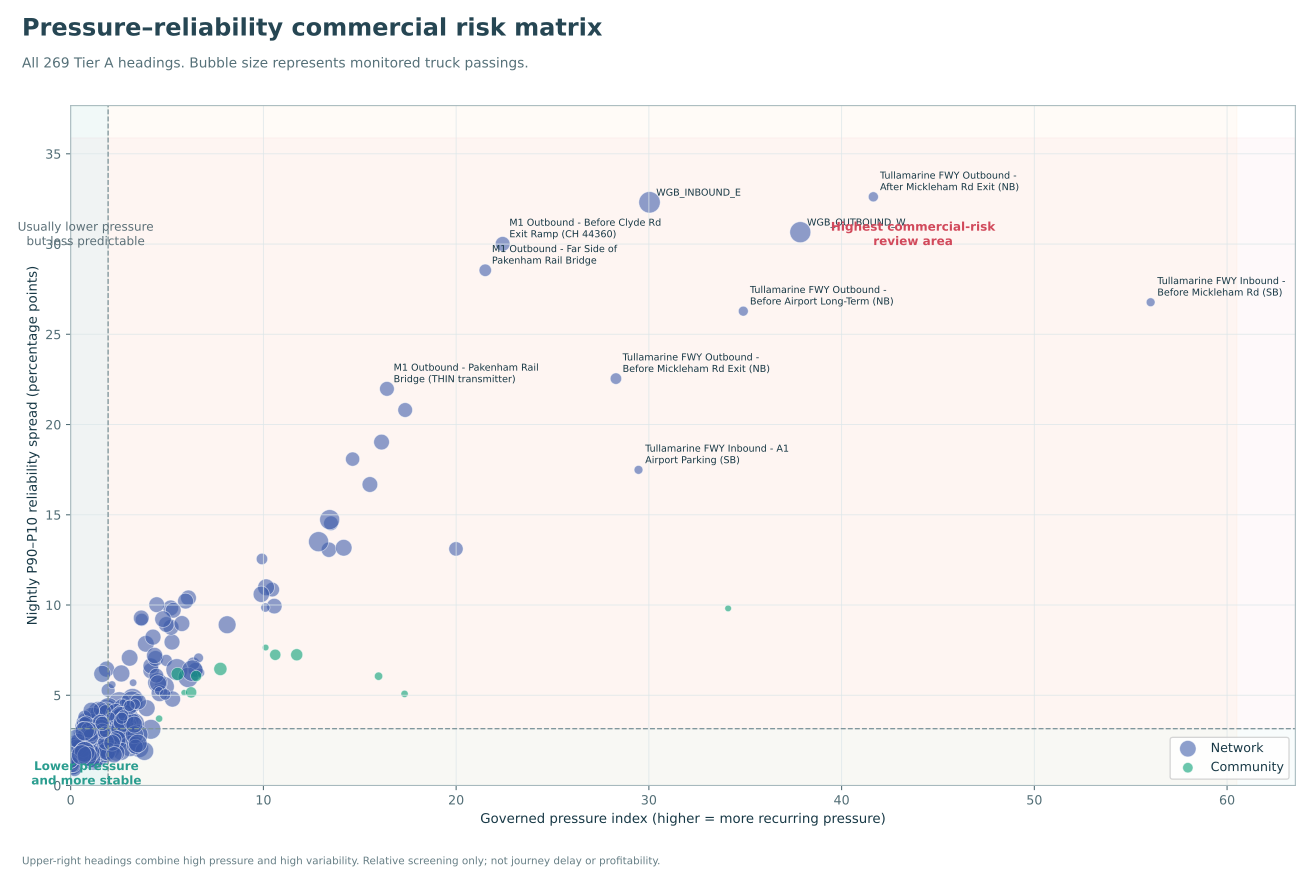
    Pressure–reliability commercial risk matrix

    Which lanes combine recurring pressure with night-to-night unpredictability?

    What this shows

    Each bubble is a Tier A heading. Pressure increases from left to right, unreliability increases from bottom to top, and bubble size reflects monitored truck passings.

    Why it matters commercially

    The upper-right area contains lanes that are both difficult and unpredictable—the combination most likely to undermine tight quoting and delivery commitments.

    How operators can use it

    Prioritise upper-right headings for rate review, contingency review, customer-window negotiation and disruption planning.

    Why VTA should care

    Identifies where commercially significant freight function overlaps with operating fragility.

    Interpretation boundaryThe matrix is a relative screening tool. It does not calculate delay minutes, lost truck-hours or contract profitability.
    CGG-03Operate more efficiently

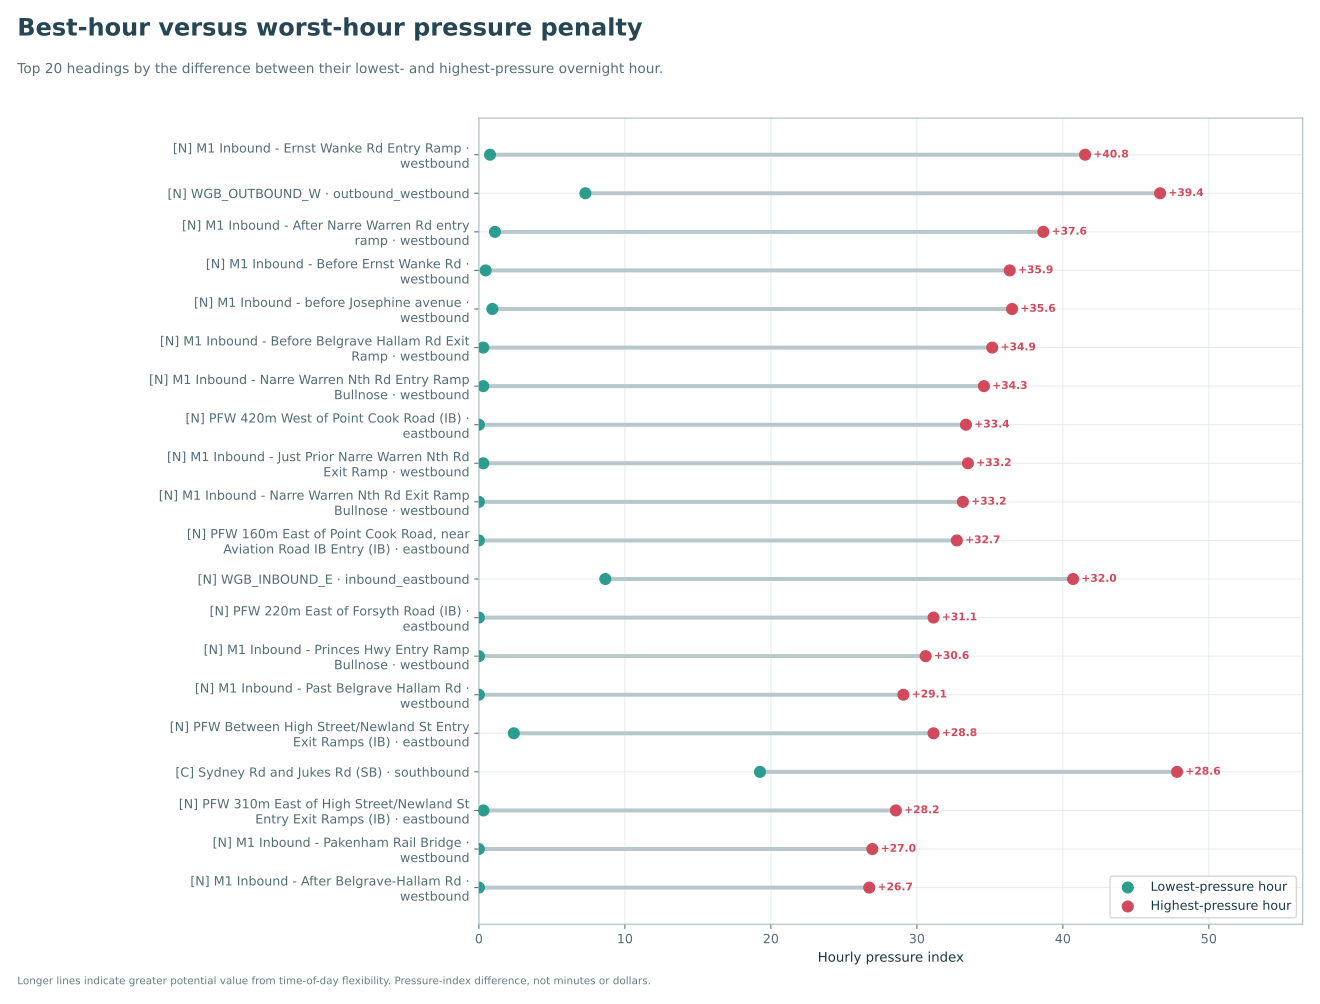
    Best-hour versus worst-hour pressure penalty

    How much additional pressure is associated with operating in the wrong overnight hour?

    What this shows

    For each heading, the green point is its lowest-pressure hour and the red point is its highest-pressure hour. The connecting distance is the measured hourly penalty.

    Why it matters commercially

    Large gaps indicate lanes where schedule flexibility has the greatest potential operational value.

    How operators can use it

    Use the largest gaps when negotiating receiving windows or deciding which jobs should be moved away from fixed high-pressure slots.

    Why VTA should care

    Quantifies the network-productivity value of time-of-day flexibility without inventing dollar savings.

    Interpretation boundaryThe penalty is a difference in the governed pressure index, not a journey-time or fuel-cost difference.
    CGG-04Protect job margins

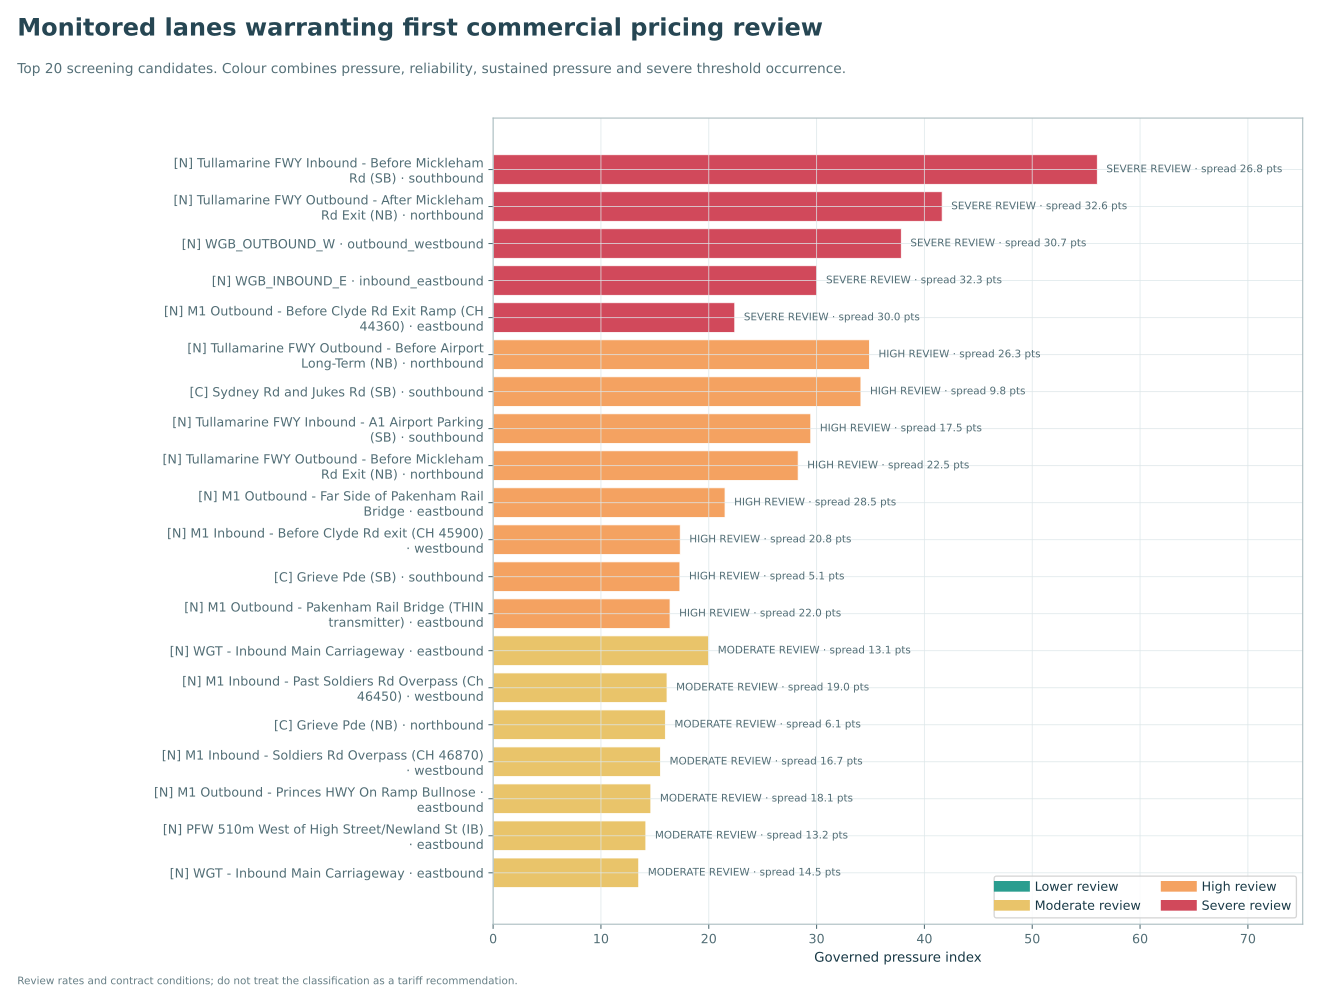
    Monitored lanes warranting first commercial pricing review

    Which lanes most strongly justify examination of quoted allowances and contract conditions?

    What this shows

    The leading commercial-review headings ranked by governed pressure. Bar colour shows the screening class from lower through severe review.

    Why it matters commercially

    A lane with recurring pressure and poor reliability can consume margin even when its invoice value appears acceptable.

    How operators can use it

    Review—not automatically increase—rates, fixed-window obligations, waiting clauses and corridor-risk allowances for the leading candidates.

    Why VTA should care

    Shows where network performance may be creating systemic commercial pressure for freight operators.

    Interpretation boundaryThe classes are investigation priorities, not recommended tariffs or proof that a contract is unprofitable.
    CGG-05Protect job margins

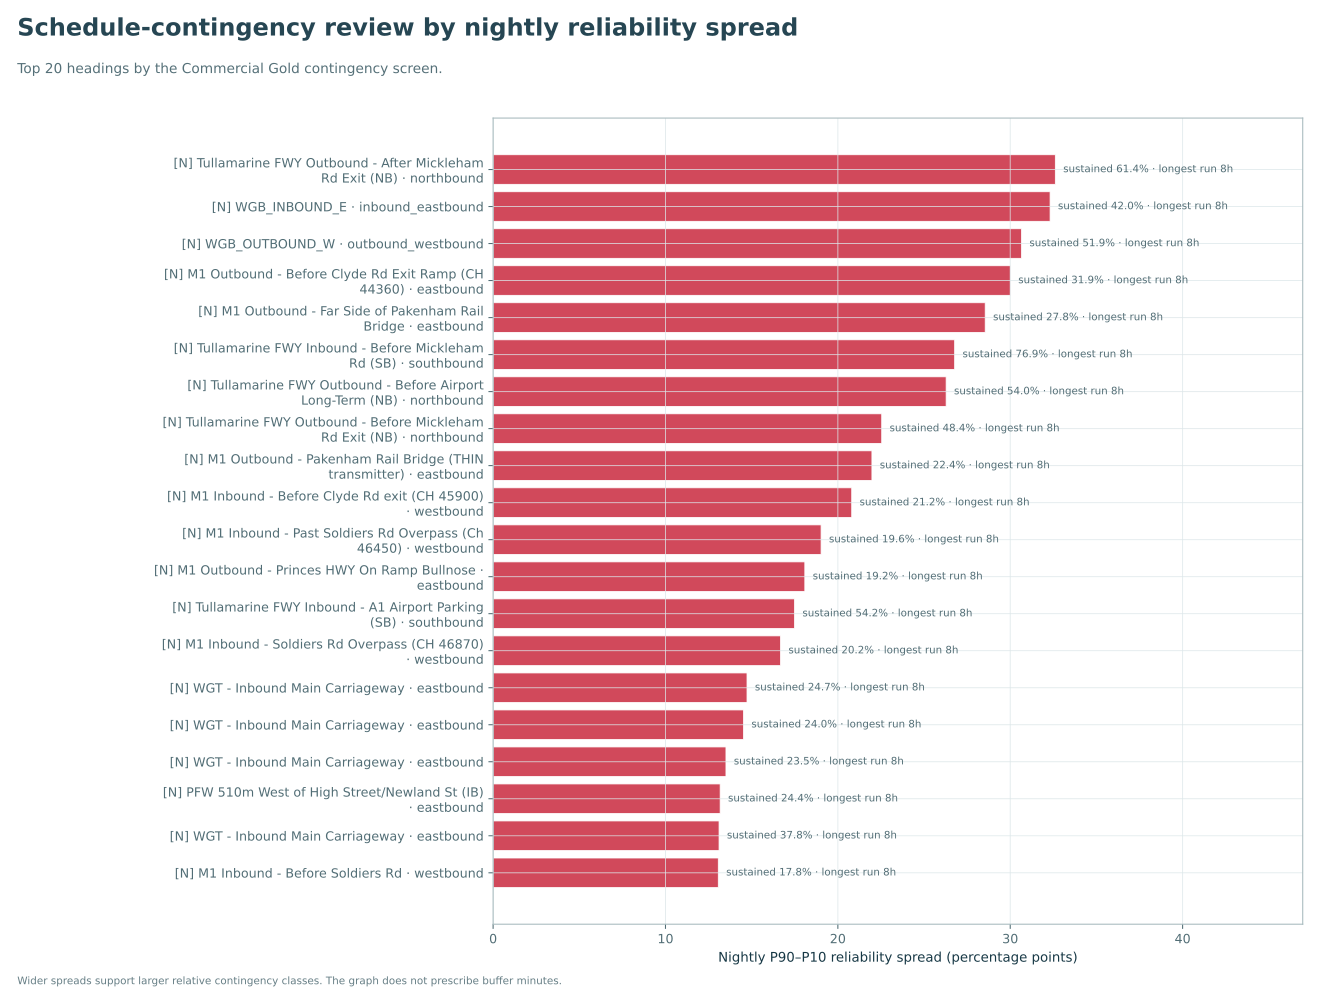
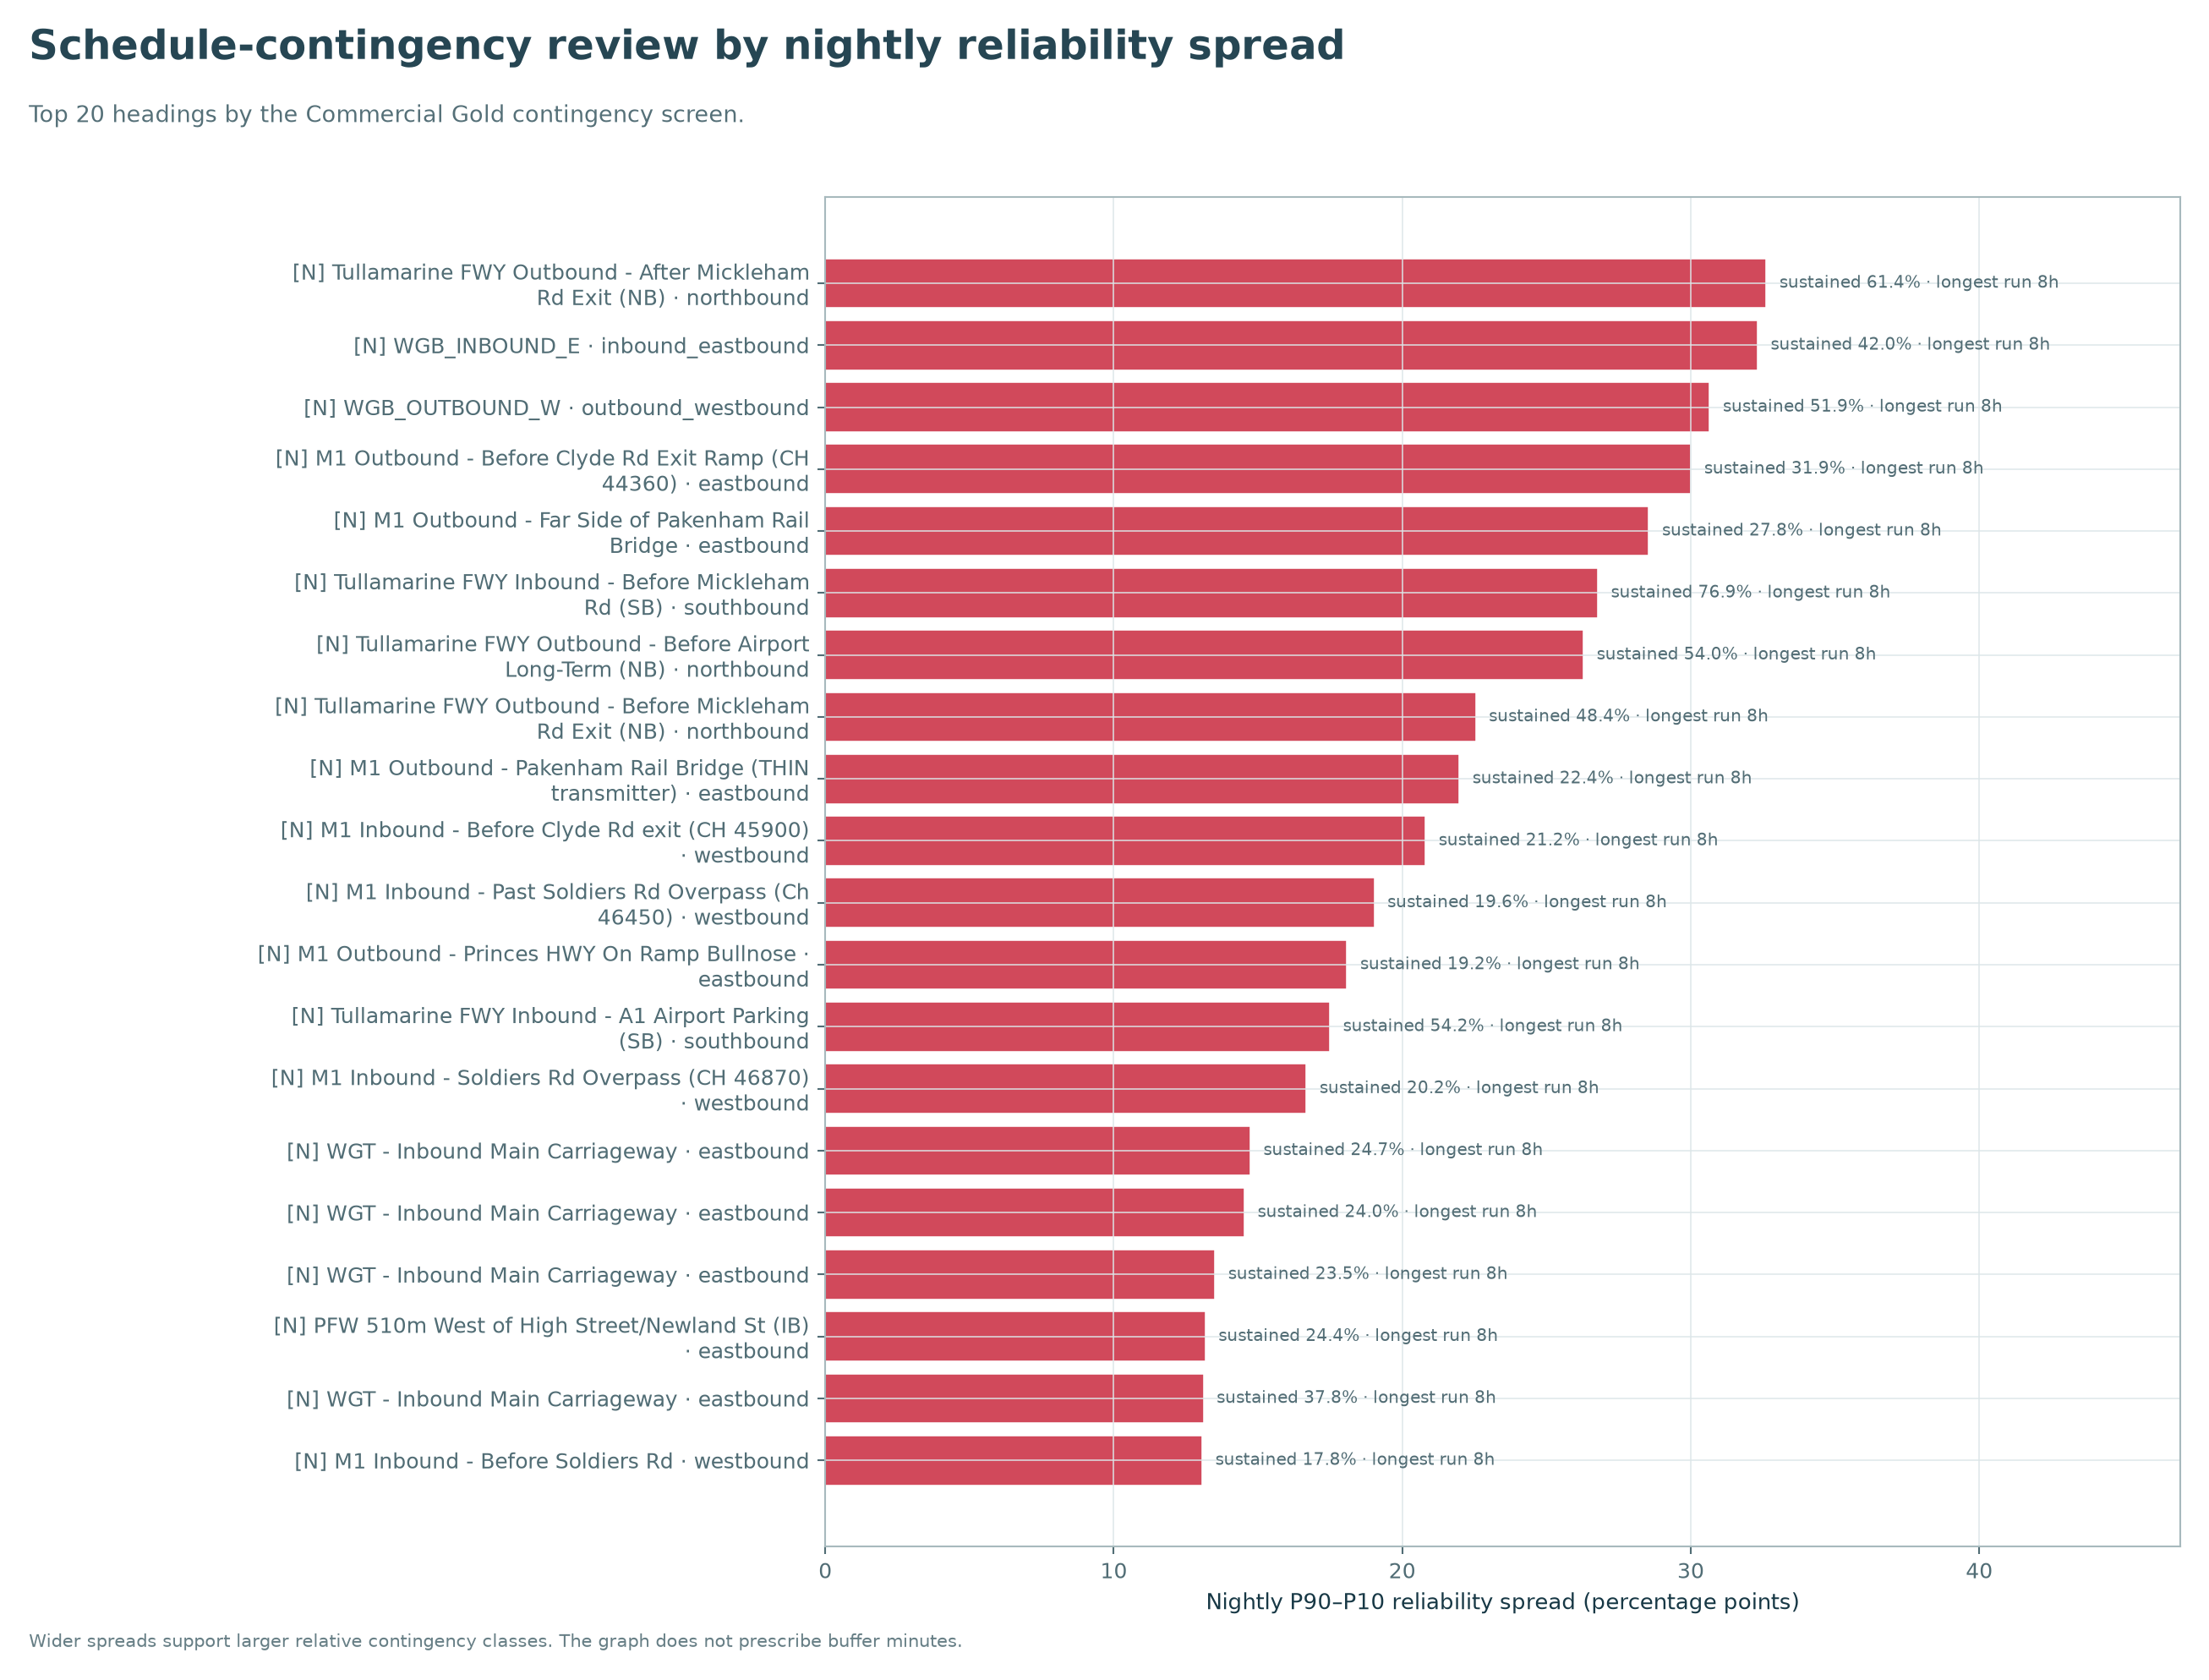
    Schedule-contingency review by nightly reliability spread

    Which lanes require the greatest protection against unpredictable operating conditions?

    What this shows

    The P90–P10 nightly spread for the leading reliability-risk headings, with sustained-pressure frequency and longest pressure run shown beside each bar.

    Why it matters commercially

    Unreliable lanes create missed appointments and overtime risk, while stable lanes may be carrying unnecessary schedule padding.

    How operators can use it

    Apply larger relative contingency classes to wide-spread lanes and investigate whether stable lanes can safely carry less padding.

    Why VTA should care

    Highlights corridors where reliability—not only average speed—should influence freight policy and infrastructure priorities.

    Interpretation boundaryThe chart supports relative contingency classes. It does not prescribe a number of minutes for any journey.
    CGG-06Reduce operating costs

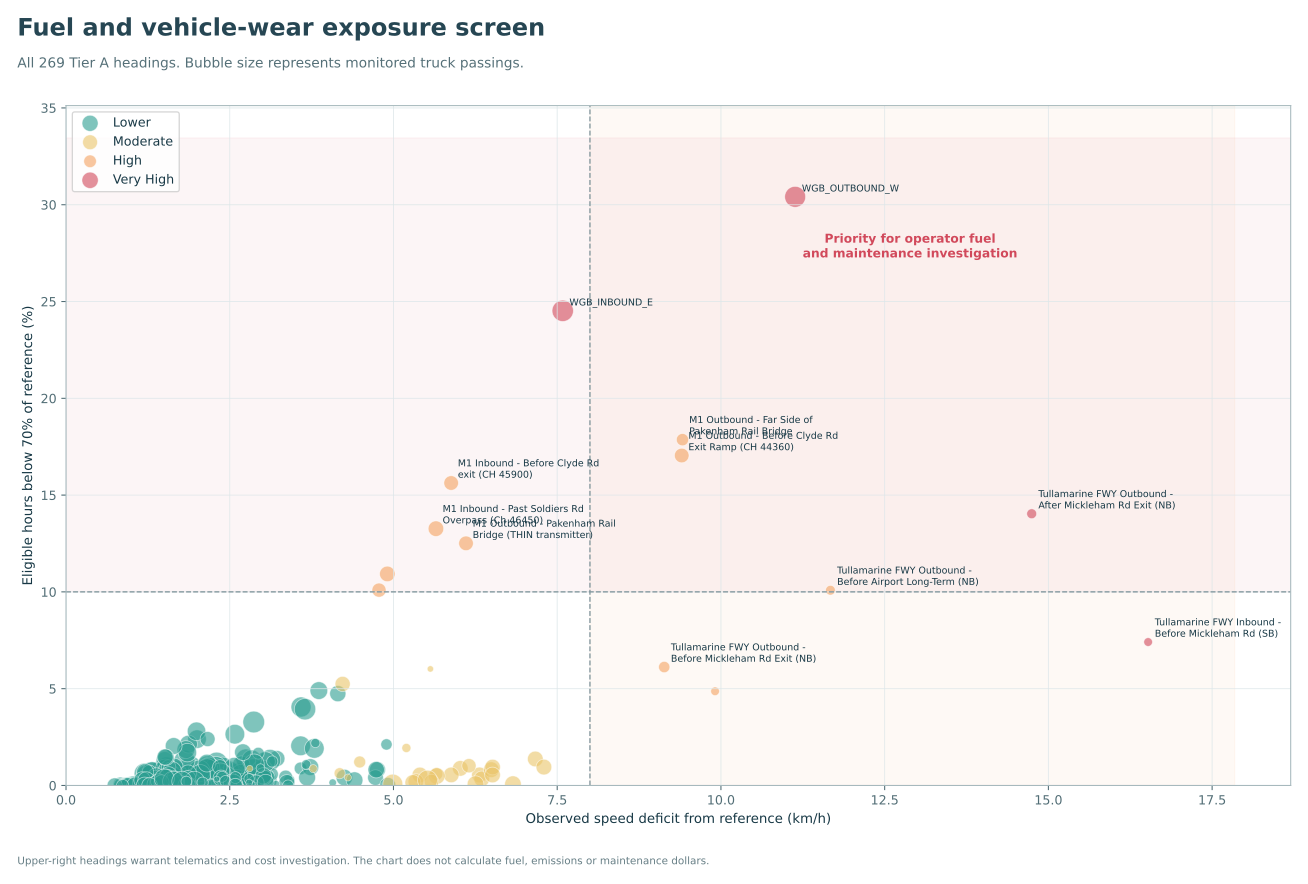
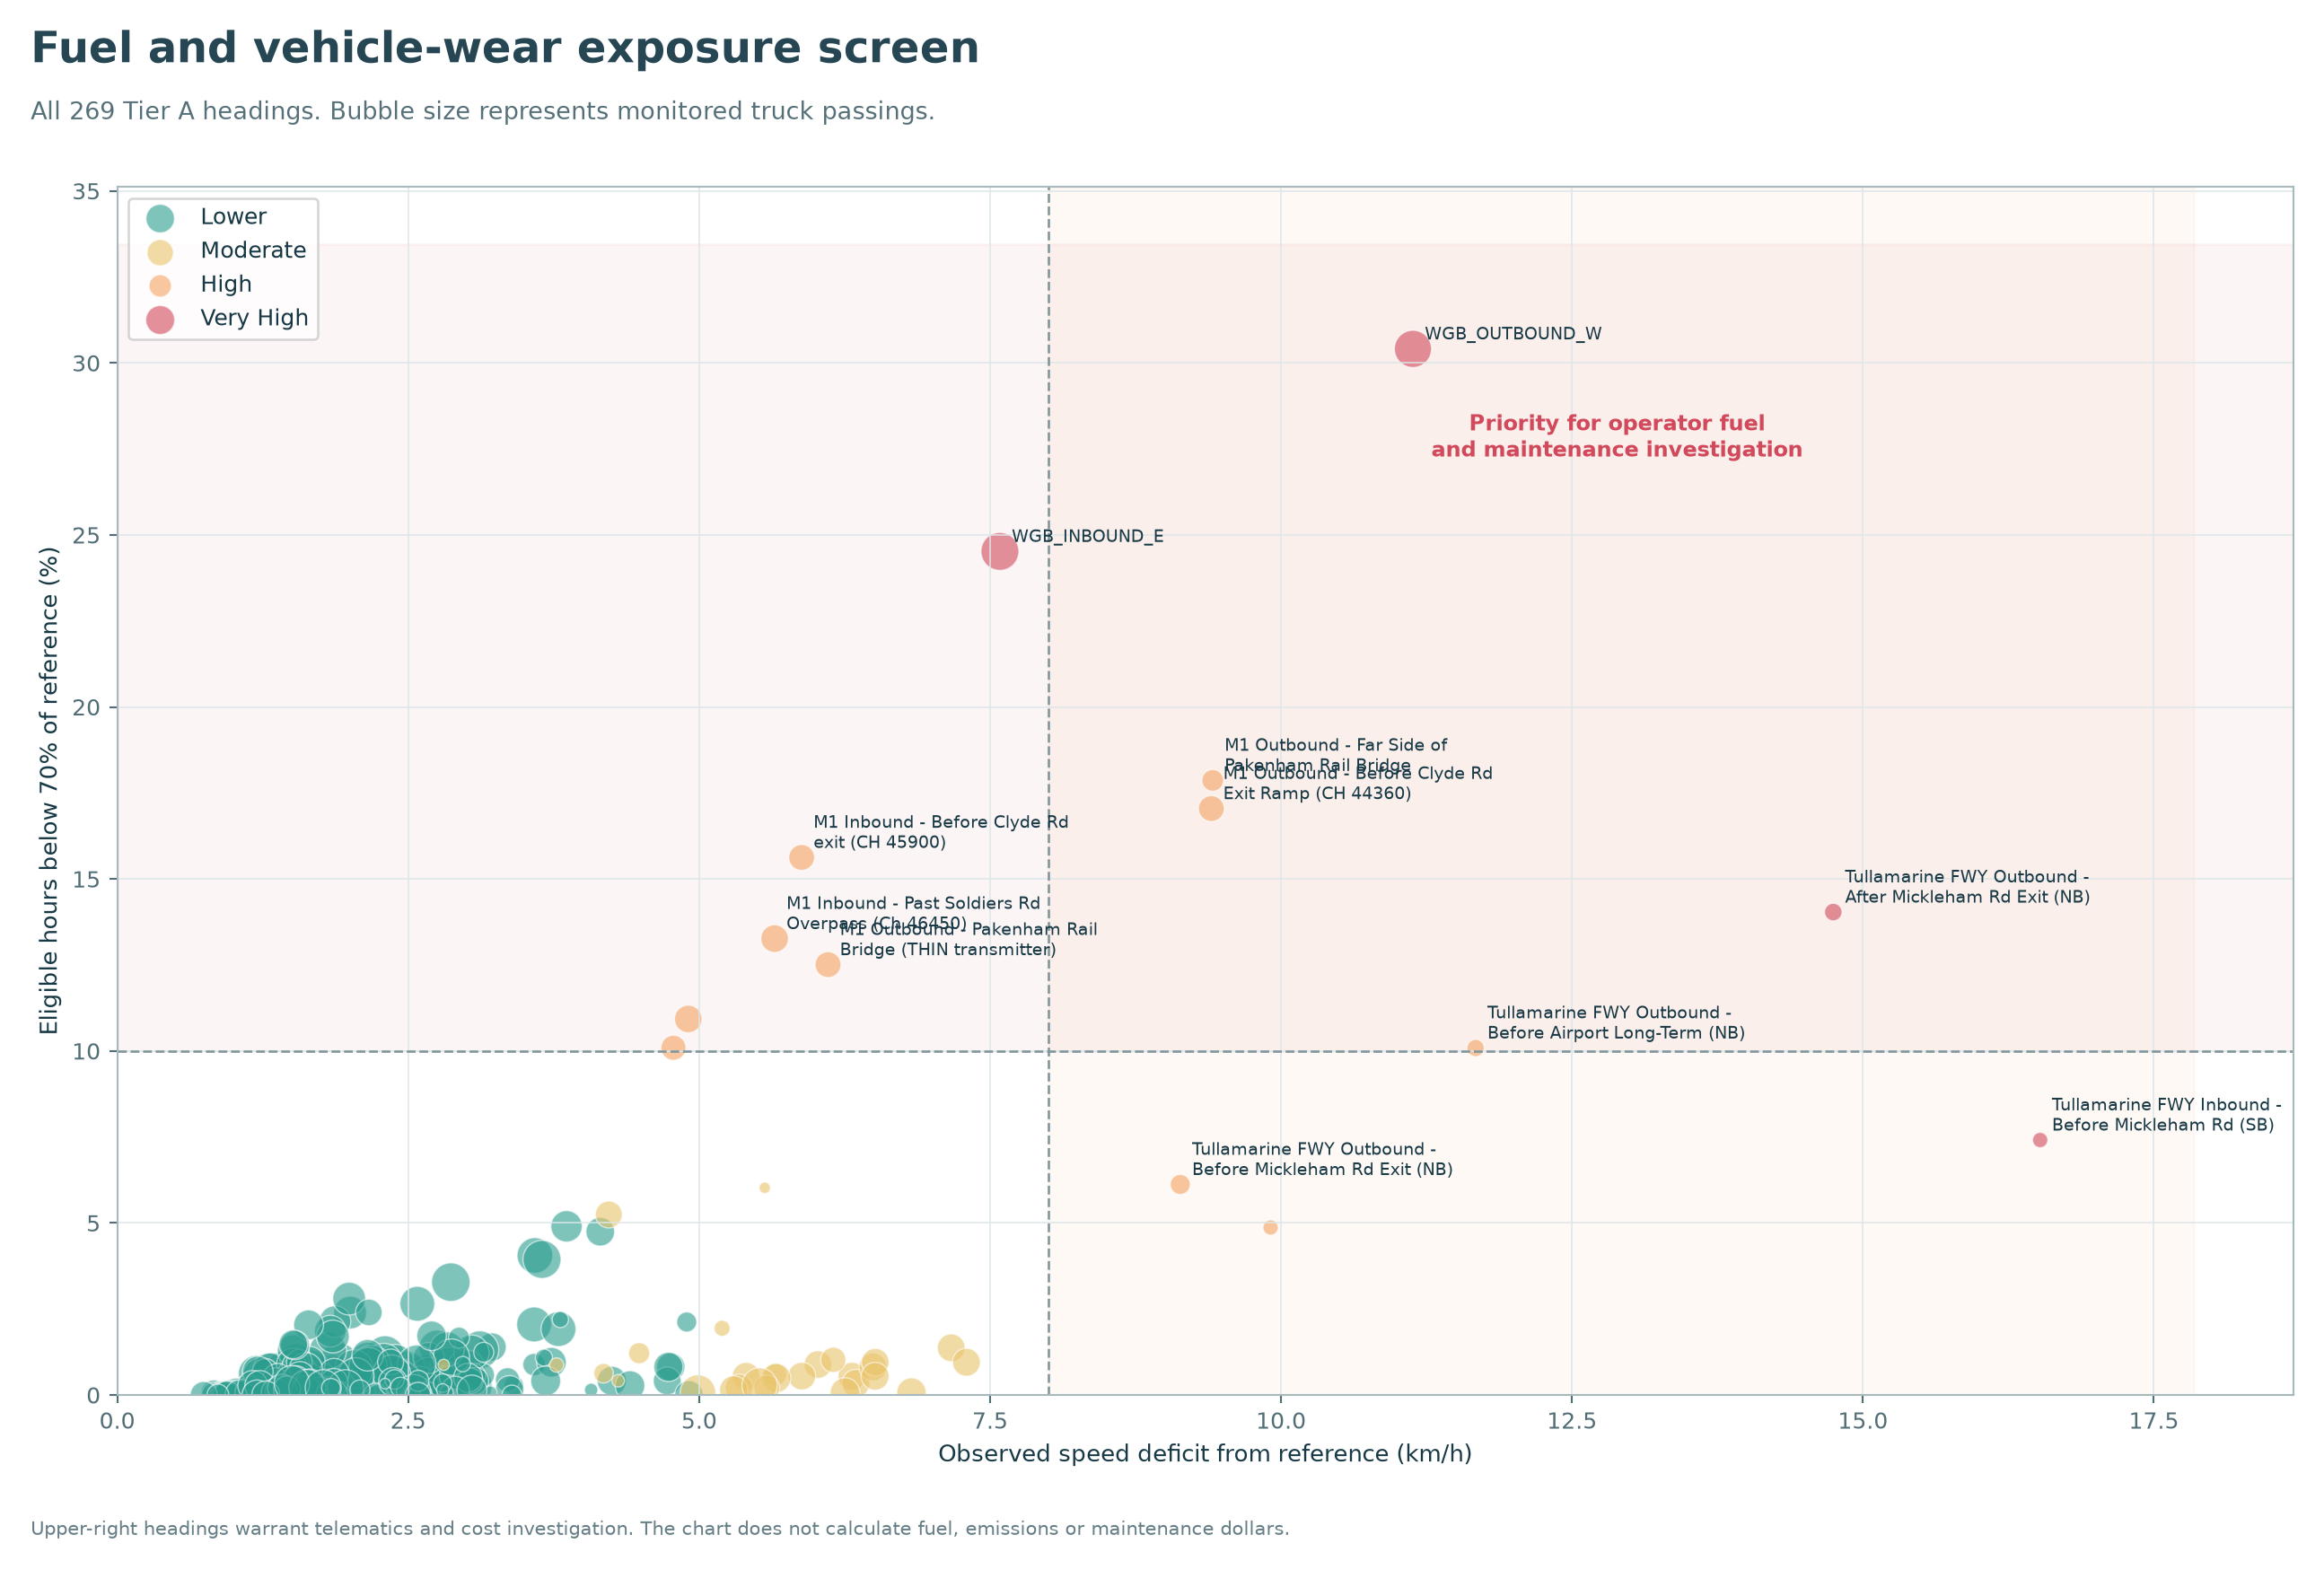
    Fuel and vehicle-wear exposure screen

    Where are severe low-speed operating conditions most recurrent?

    What this shows

    Headings are positioned by long-period observed-speed deficit and the share of eligible hours below 70% of reference. Bubble size represents monitored truck passings.

    Why it matters commercially

    Repeated severe low-speed operation is where operator telematics, fuel and maintenance records are most worth investigating.

    How operators can use it

    Compare actual fuel burn, braking, idling and maintenance outcomes for vehicles repeatedly assigned to upper-right headings.

    Why VTA should care

    Provides an evidence-led shortlist for productivity and decarbonisation investigation.

    Interpretation boundaryThis is an operating-exposure signal. It does not calculate litres, emissions, brake wear or maintenance dollars.
    CGG-07Find commercial opportunities

    Directional imbalance and backload opportunity signals

    Where is empty-return exposure most likely to deserve commercial attention?

    What this shows

    The leading paired sites ranked by median directional imbalance. Labels identify the dominant direction and combined overnight truck activity.

    Why it matters commercially

    Strong directional imbalance can expose operators to dead kilometres when freight demand is concentrated in one direction.

    How operators can use it

    Target return-load sales toward the weaker direction, pair complementary contracts or ensure dominant-direction pricing recognises likely empty running.

    Why VTA should care

    Shows where freight-market coordination or consolidation could improve asset utilisation.

    Interpretation boundarySensor imbalance is an opportunity signal. It does not prove that a suitable backload is available or that trucks are empty.
    CGG-08Find commercial opportunities

    Balanced high-volume staging and shuttle opportunities

    Where might scheduled shuttles, trailer staging or cross-dock models deserve investigation?

    What this shows

    Paired freight sites positioned by the share of balanced nights and combined overnight truck activity. Larger bubbles have stronger balanced-intensity scores.

    Why it matters commercially

    High and balanced two-way activity is a stronger signal for repeatable shuttle or staging operations than raw volume alone.

    How operators can use it

    Shortlist upper-right sites for land, customer, access, zoning and route-economic investigation.

    Why VTA should care

    Connects monitored freight flows to possible industry-productivity infrastructure and operating models.

    Interpretation boundaryThe graph identifies candidates only. It is not a depot, staging-yard or cross-dock recommendation.
    CGG-09Protect the freight task

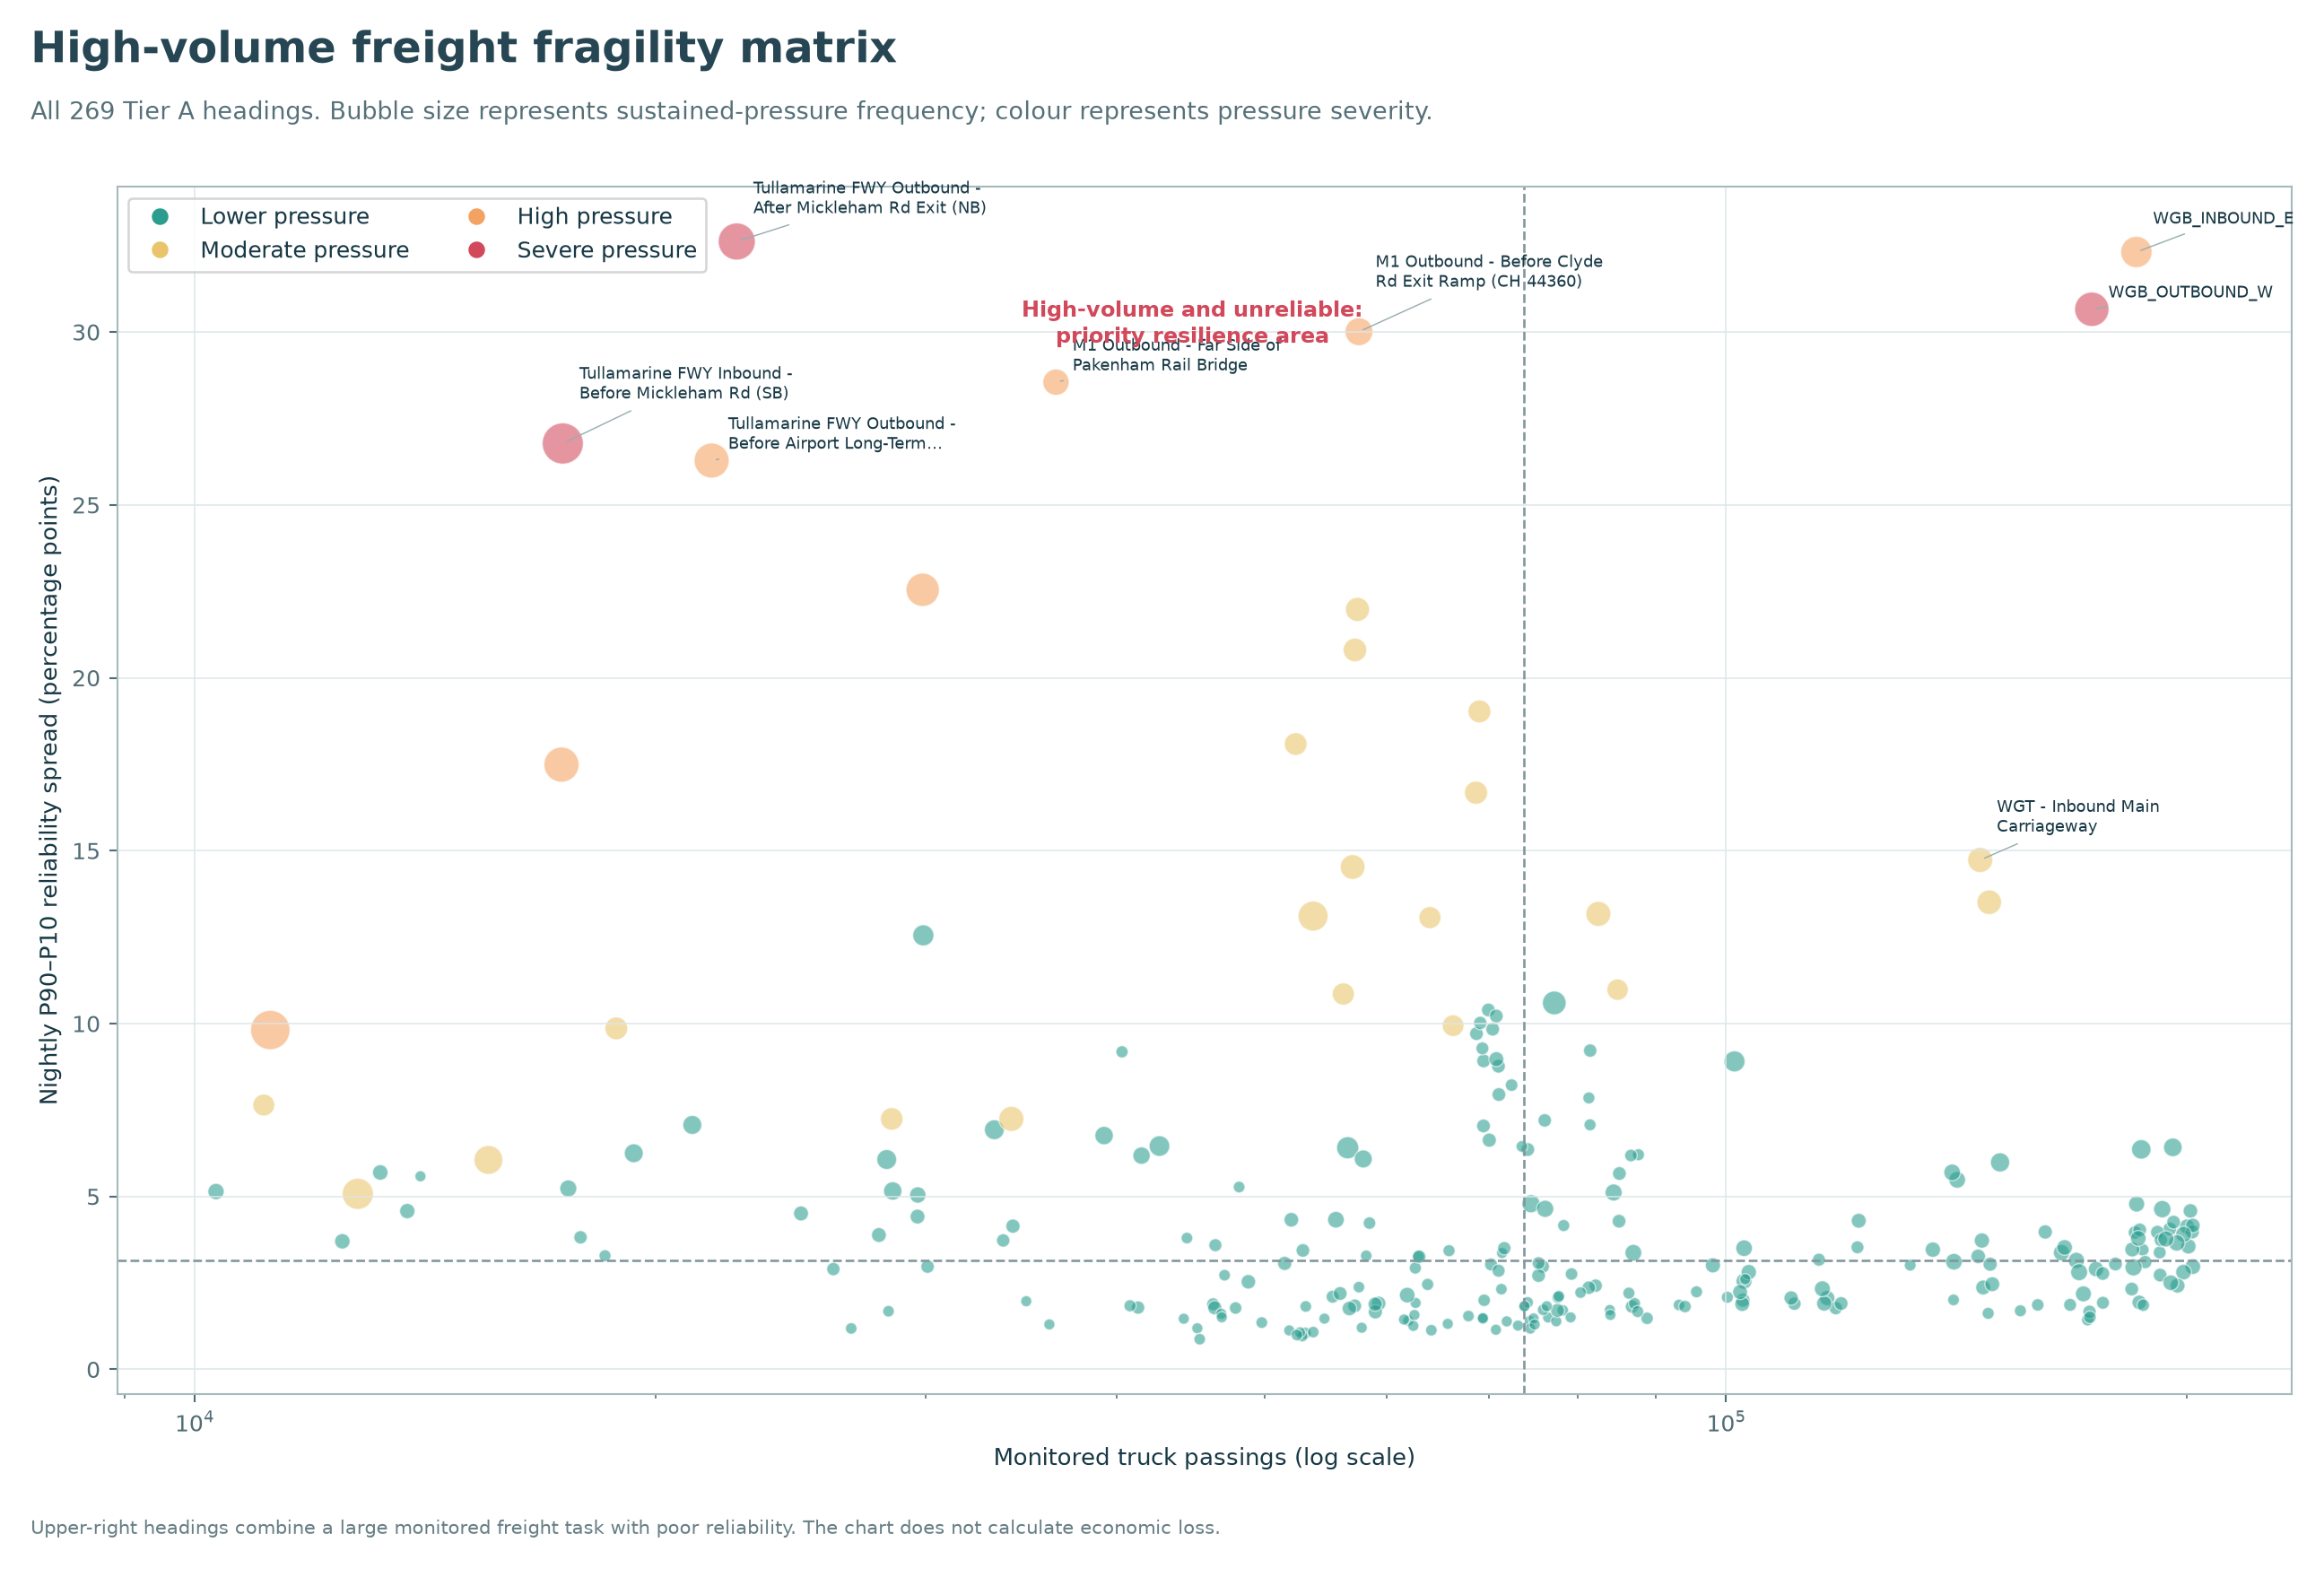
    High-volume freight fragility matrix

    Where does a large monitored freight task overlap with poor reliability?

    What this shows

    Truck passings increase from left to right, nightly reliability spread increases upward, and bubble size reflects sustained-pressure frequency.

    Why it matters commercially

    High-volume, unreliable headings have the greatest potential to affect many freight movements when conditions deteriorate.

    How operators can use it

    Give upper-right locations stronger disruption playbooks, customer-notification rules and route-dependency reviews.

    Why VTA should care

    Provides an infrastructure and resilience priority lens based on freight function and fragility together.

    Interpretation boundaryThe chart does not identify the cause of instability or quantify complete network economic loss.
    CGG-10Understand the operating night

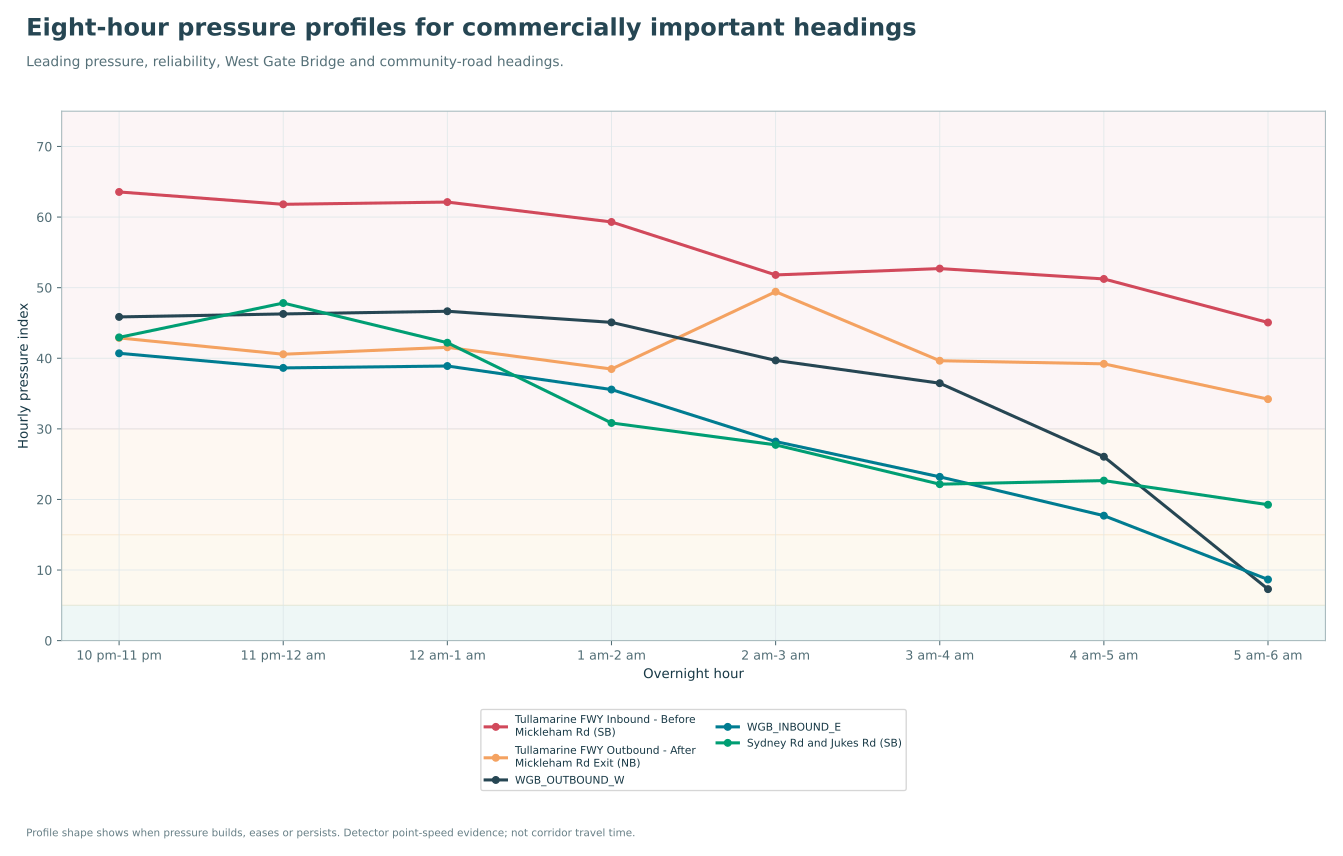
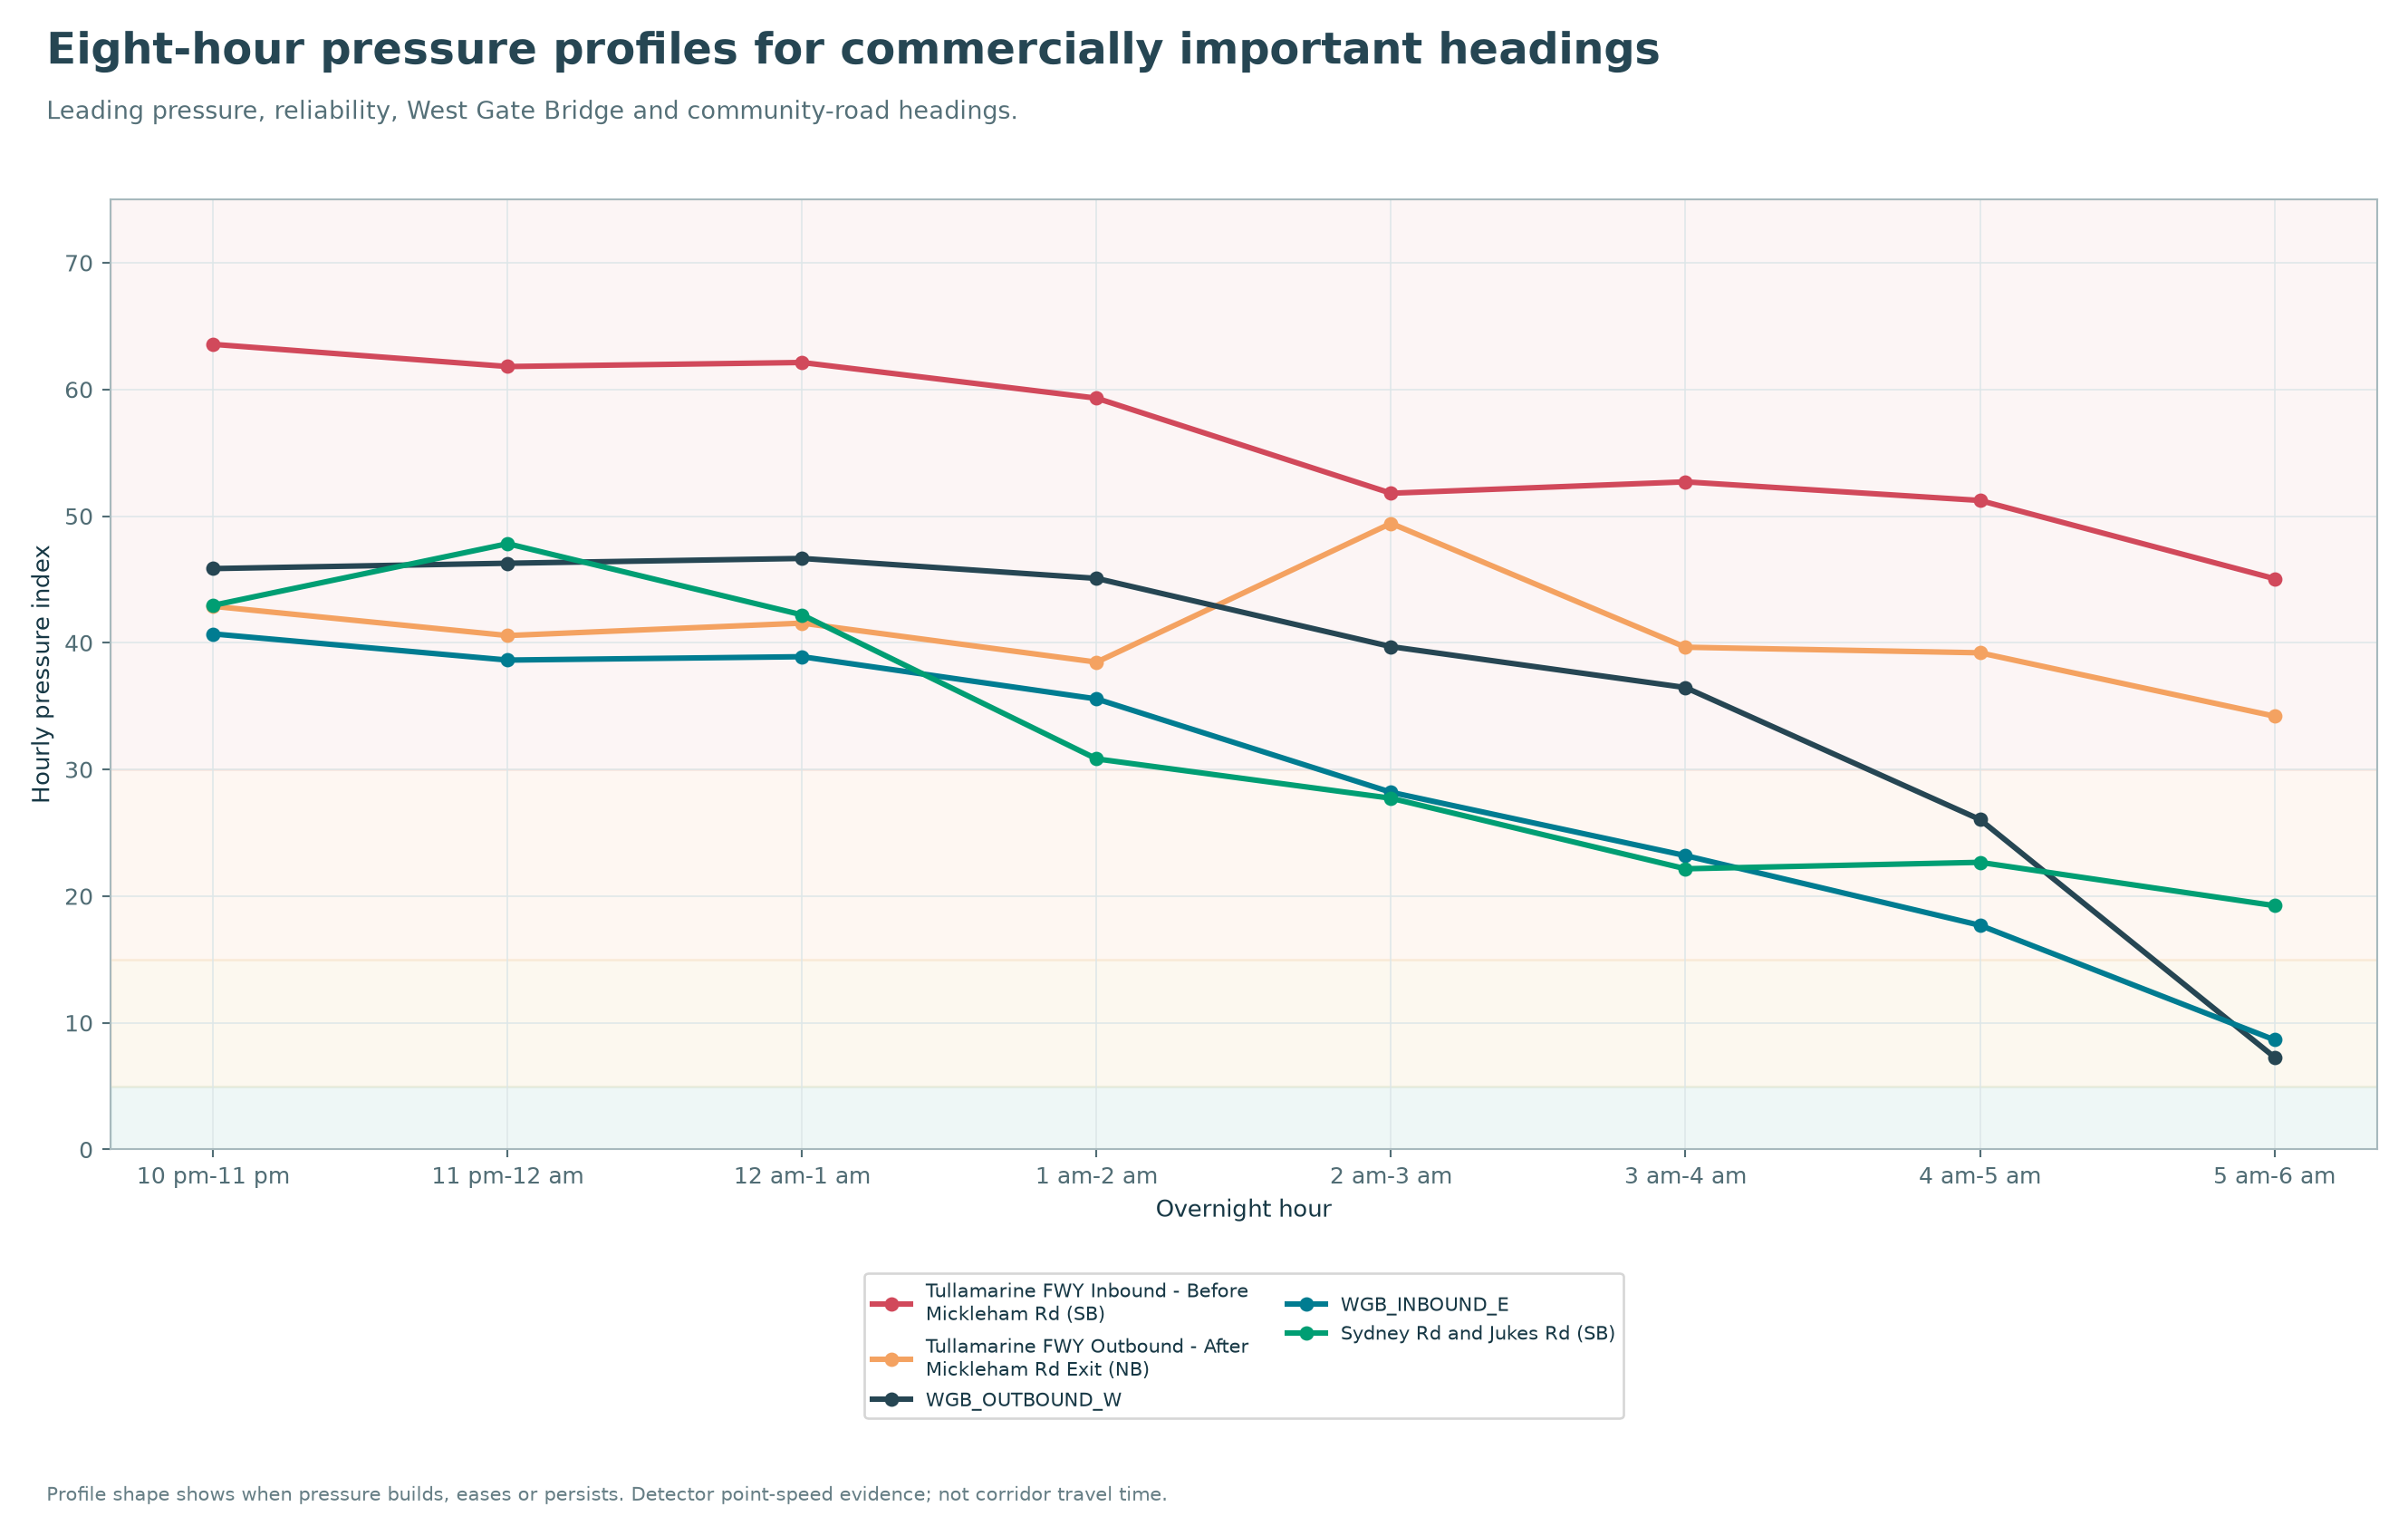
    Eight-hour pressure profiles for commercially important headings

    How does pressure build, ease or persist through the freight operating night?

    What this shows

    Hourly pressure profiles for the leading pressure and reliability headings, both West Gate Bridge directions and the leading community-road heading.

    Why it matters commercially

    A single overnight average can hide early-night pressure, pre-dawn deterioration or sustained all-night difficulty.

    How operators can use it

    Use the profile shape to choose departure windows and to understand whether a lane has one avoidable peak or a persistent all-night problem.

    Why VTA should care

    Shows how freight-network pressure differs by direction and hour, supporting more targeted operational responses.

    Interpretation boundaryThese are detector point-speed pressure profiles, not complete corridor travel-time curves.
    Commercial graph
    Operator window and risk lookup

    Choose any Tier A heading.

    See its lowest-pressure hour, highest-pressure hour, pricing-risk screen, schedule-contingency class and fuel/wear exposure signal.

    The lookup compares monitored headings and hours. It does not prove that another heading is a legally or operationally valid alternative route.

    Freight operator commercial intelligence evidence table
    How to use this commercially

    Use the data to decide where to investigate first.

    • Move flexible jobs toward measured lower-pressure windows.
    • Review rates and contract terms on severe or highly unreliable lanes.
    • Reduce unnecessary contingency on stable lanes.
    • Target return-load sales where directional imbalance is strongest.
    • Investigate staging and shuttle models where two-way volume is both high and balanced.

    Do not convert these signals directly into dollars without operator cost inputs. Exact profitability needs revenue, fuel, wage, vehicle, toll, waiting-time, distance and empty-running information.

    Analytics workspace

    From network-wide pulse to corridor-level proof.

    The current connected release brings together the most decision-useful verified outputs. Each visual retains source, coverage and interpretation information so the evidence remains defensible.

    Strategic exposure

    Freight exposure score by corridor

    Current connected release

    A ranked comparison of the connected corridor exposure score. This is an analytical score, not a vehicle count.

    Corridor comparison

    Truck volume by corridor

    Ranked freight observations across strategic corridors and directions.

    Reliability

    Truck share by corridor

    The classified truck share represented by each connected strategic corridor record.

    Overnight freight exposure

    Average overnight truck passings

    Average classified truck passings per valid eight-hour overnight period for each connected Western corridor.

    Overnight passing frequency

    Minutes between overnight truck passings

    Equivalent average minutes between classified truck passings. A lower value means more frequent overnight activity.

    Directional evidence

    Direction-level overnight freight intensity

    The highest verified overnight truck-passing rates among directional TIRTL headings used in the comparable metric.

    Connected evidence ledger Source, coverage and quality status
    Loading source audit…
    West Gate baseline readiness
    Loading baseline status…

    Independent West Gate freight benefits measurement

    What the monitor will test

    Independent benefits measurement

    What the current evidence can answer — and what requires segmentation or later data.

    The register separates current reference-period findings from questions requiring a clean opening-period segmentation, later operating observations or evidence beyond detector speeds and passings.

    Opening-date correction

    The West Gate Tunnel opened to traffic on 14 December 2025. The Stage 23A.4 reference contains 43 pre-opening nights and 159 nights on or after opening. It is therefore a mixed pre-opening, opening-transition and early-operation reference — not a pure pre-opening baseline.

    Official opening notice
    13questions answered nowCurrent mixed-period reference findings
    8tests awaiting segmentation or later dataIncludes a clean opening-effect test
    7claims needing more dataNot established by detectors alone
    The present position

    We can describe current reference-period freight pressure, direction, timing and reliability. We can also compare future stable operating periods with the frozen reference. We cannot yet claim a clean West Gate Tunnel opening benefit because the existing reference spans both sides of the opening date.

    Answered within current reference Segmentation or later-period evidence pending Additional evidence required

    Showing all 28 questions.

    NOW-01Two-way freight scale
    Answered now

    Where is combined monitored overnight two-way freight activity currently greatest?

    Current answer

    West Gate Bridge ranks first among governed paired whole-site assets, averaging 2,202.1 normalised combined truck passings over an eight-hour night.

    Evidence and next step
    Evidence basis
    Stage 22 governed paired-site ranking; 148 eligible West Gate paired nights.
    Next evidence needed
    Compare the same governed measure across separately defined pre-opening, transition and later operating windows.
    Boundary
    Passings are sensor observations, not unique trucks or complete journeys.
    NOW-02Two-way persistence
    Answered now

    Is West Gate Bridge freight activity sustained in both directions?

    Current answer

    Yes. Sustained two-way pressure occurred on 81.8% of eligible nights. 87.8% of nights were classified as balanced.

    Evidence and next step
    Evidence basis
    Stage 22 paired inbound/eastbound and outbound/westbound evidence.
    Next evidence needed
    Compare the same percentages across separately governed opening-period segments and later operating periods.
    Boundary
    The measure establishes two-way monitored activity; it does not identify individual truck routes.
    NOW-03Direction and timing
    Answered now

    Which direction currently carries the larger share, and when does combined freight peak?

    Current answer

    Inbound/eastbound is the overall dominant direction with 55.8% of paired passings. Median directional imbalance is 11.3%. The combined peak is 5:00 am-6:00 am, averaging 621.9 truck passings.

    Evidence and next step
    Evidence basis
    Stage 22 paired whole-site direction and hourly profile.
    Next evidence needed
    Test whether direction shares and the peak hour differ between pre-opening, transition and later operating windows.
    Boundary
    This is monitored bridge activity, not origin-to-destination routing evidence.
    NOW-04Bridge pressure ranking
    Answered now

    How do both West Gate Bridge directions rank for overnight operating-speed pressure within the governed reference period?

    Current answer

    Outbound/westbound ranks 3 with a pressure index of 37.86. Inbound/eastbound ranks 5 with an index of 30.03.

    Evidence and next step
    Evidence basis
    Stage 23A.4 strategic-network Tier A ranking for the mixed opening-transition reference period.
    Next evidence needed
    Compare later operating-period observations against the frozen reference and separately build a clean segmented pre-opening versus operating-period analysis.
    Boundary
    The pressure index is relative point-speed pressure, not travel delay.
    NOW-05Directional pressure
    Answered now

    Which West Gate Bridge direction is more pressured within the current reference period?

    Current answer

    Outbound/westbound. Its observed speed is 84.1% of reference, compared with 89.9% inbound. It is below 90% of reference during 40.0% of eligible hours, versus 31.3% inbound.

    Evidence and next step
    Evidence basis
    Stage 23A.4 directional pressure measures.
    Next evidence needed
    Test whether either or both directional gaps narrow in later operating periods and in a separately segmented opening analysis.
    Boundary
    The comparison does not convert the speed gap into journey-time savings.
    NOW-06Reliability
    Answered now

    Which West Gate Bridge direction is less reliable from night to night within the current reference period?

    Current answer

    Inbound/eastbound is slightly less reliable. Its P90-P10 nightly spread is 32.3 percentage points and it ranks second for network reliability risk. Outbound/westbound has a 30.7-point spread and ranks third.

    Evidence and next step
    Evidence basis
    Stage 23A.4 network reliability-risk ranking.
    Next evidence needed
    Compare later-period P90-P10 and interquartile spreads, and separately evaluate segmented pre-opening and operating-period windows.
    Boundary
    A larger spread means less consistency; it does not by itself identify the cause.
    NOW-07Persistence
    Answered now

    Is bridge pressure occasional, or does it recur for sustained periods within the current reference?

    Current answer

    It is recurring. Sustained-pressure nights occur on 51.9% of outbound eligible nights and 42.0% of inbound eligible nights. Both directions recorded worst-night runs spanning all eight overnight hours.

    Evidence and next step
    Evidence basis
    Stage 23A.4 sustained-pressure and longest-run measures.
    Next evidence needed
    Measure whether sustained-night frequency and longest runs fall in later operating periods and across the segmented opening windows.
    Boundary
    Worst-night runs establish persistence within the monitored overnight window, not a full-day condition.
    NOW-08Hourly pattern
    Answered now

    During which overnight hours is West Gate Bridge pressure most pronounced within the current reference?

    Current answer

    Outbound/westbound has its worst governed hour at 12:00 am-1:00 am; inbound/eastbound at 10:00 pm-11:00 pm. Complete profiles are available for every hour from 10 pm to 6 am.

    Evidence and next step
    Evidence basis
    Stage 23A.4 eight-hour directional profiles.
    Next evidence needed
    Compare each later operating-period hour with the matching frozen hourly reference and rebuild the profiles for segmented opening windows.
    Boundary
    The profiles are detector-hour evidence and should not be described as complete corridor travel times.
    NOW-09Network priority
    Answered now

    Where is overnight strategic-network speed pressure greatest within the governed reference period?

    Current answer

    Tullamarine FWY Inbound - Before Mickleham Rd (SB) ranks first with a pressure index of 56.03. Truck speed is below 90% of reference during 75.5% of eligible hours, with sustained pressure on 76.9% of eligible nights.

    Evidence and next step
    Evidence basis
    Stage 23A.4 strategic-network pressure ranking for the mixed opening-transition reference.
    Next evidence needed
    Track whether the leading pressure location changes in later operating periods and between segmented windows.
    Boundary
    A rank identifies relative monitored pressure, not the cause or a complete journey impact.
    NOW-10Community priority
    Answered now

    Which monitored community-road location has the greatest overnight pressure within the governed reference period?

    Current answer

    Sydney Rd and Jukes Rd (SB) ranks first with a pressure index of 34.11. It is below 90% of reference during 47.1% of eligible hours and records sustained pressure on 69.8% of eligible nights.

    Evidence and next step
    Evidence basis
    Stage 23A.4 community-road Tier A ranking for the mixed opening-transition reference.
    Next evidence needed
    Use the same measures in segmented windows and later operating periods to test community-road relief.
    Boundary
    The ranking covers governed monitored headings, not every local road.
    NOW-11Concentration
    Answered now

    Is leading overnight freight pressure concentrated or evenly distributed within the current reference?

    Current answer

    It is concentrated. All five leading strategic-network pressure headings are on the Tullamarine Freeway or West Gate Bridge. Both bridge directions are in the top five.

    Evidence and next step
    Evidence basis
    Stage 23A.4 network top-five pressure ranking for the mixed opening-transition reference.
    Next evidence needed
    Test whether later-period top-five pressure becomes less concentrated or moves elsewhere, and compare segmented windows.
    Boundary
    Concentration in monitored rankings does not establish why those locations are pressured.
    NOW-12Evidence strength
    Answered now

    How much governed evidence supports the current reference-period findings?

    Current answer

    The speed reference contains 269 Tier A headings, 2,152 reference-ready heading-hours, 374,900 complete speed hours and 46,697 eligible heading-nights. Stage 22 adds 119 paired sites, 163,819 complete paired hours and 20,401 eligible paired nights.

    Evidence and next step
    Evidence basis
    Governed Stage 22 and Stage 23A.4 manifests.
    Next evidence needed
    Preserve equivalent quality gates when producing segmented opening windows and later-period comparisons.
    Boundary
    Evidence strength supports comparison; it does not remove the need to account for external conditions.
    NOW-13Governance
    Answered now

    Which headings are suitable for public comparison, and what fixed reference can later operating periods be tested against?

    Current answer

    269 Tier A headings qualify for full temporal comparison; 12 Tier B headings are descriptive only; 2 Tier C headings are excluded. Later periods can be compared with VTA_STAGE23A4_P85_20251101_20260521, but that reference spans 1 November 2025 to 21 May 2026 and is not a pure pre-opening baseline.

    Evidence and next step
    Evidence basis
    Stage 23A.3 tiers and Stage 23A.4 frozen mixed-period opening-transition reference.
    Next evidence needed
    Keep the frozen reference for later-period monitoring, and separately build pre-opening, transition and early-operation windows for a clean opening-effect evaluation.
    Boundary
    The P85 reference is an observed upper-normal point speed, not a posted speed limit or a pure pre-opening counterfactual.
    PENDING-01Opening segmentation
    Segmentation or later-period evidence pending

    Can the current Stage 23A.4 reference by itself establish a clean before-versus-after West Gate Tunnel opening effect?

    Current answer

    No. The tunnel opened on 14 December 2025, while the reference spans 1 November 2025 to 21 May 2026. It contains 43 pre-opening nights and 159 nights on or after opening, so it is a mixed opening-transition reference.

    Evidence and next step
    Evidence basis
    Existing governed mixed-period opening-transition reference.
    Next evidence needed
    A governed Stage 23A.5 segmentation with separate pre-opening, opening-transition and early-operation windows, each subjected to fresh coverage and density gates.
    Boundary
    No West Gate Tunnel opening benefit or failure verdict can be issued from the mixed-period reference alone.
    PENDING-02Bridge pressure
    Segmentation or later-period evidence pending

    Did West Gate Bridge operating-speed pressure improve in later operating periods?

    Current answer

    The current mixed-period inbound and outbound reference is established separately, including pressure index and threshold occurrence.

    Evidence and next step
    Evidence basis
    Existing governed mixed-period opening-transition reference.
    Next evidence needed
    A governed later operating-period comparison against the frozen reference, plus a separately segmented opening analysis.
    Boundary
    No West Gate Tunnel opening benefit or failure verdict can be issued from the mixed-period reference alone.
    PENDING-03Reliability benefit
    Segmentation or later-period evidence pending

    Did West Gate Bridge reliability improve in later operating periods?

    Current answer

    Current P10-P90, P25-P75, worst-night and sustained-run measures are established in both directions.

    Evidence and next step
    Evidence basis
    Existing governed mixed-period opening-transition reference.
    Next evidence needed
    Later-period nightly distributions with comparable coverage, plus segmented pre-opening, transition and operating windows.
    Boundary
    No West Gate Tunnel opening benefit or failure verdict can be issued from the mixed-period reference alone.
    PENDING-04Truck redistribution
    Segmentation or later-period evidence pending

    Did freight redistribute from community roads onto intended strategic routes?

    Current answer

    Current community, network, directional and two-way monitoring reference conditions are available.

    Evidence and next step
    Evidence basis
    Existing governed mixed-period opening-transition reference.
    Next evidence needed
    Segmented and later-period TIRTL and SCATS counts across the same monitored community and strategic-route set.
    Boundary
    No West Gate Tunnel opening benefit or failure verdict can be issued from the mixed-period reference alone.
    PENDING-05Port access
    Segmentation or later-period evidence pending

    Did monitored Port of Melbourne approaches improve in later operating periods?

    Current answer

    Existing monitored approach volumes, pressure and reliability form an opening-transition reference, not a pure pre-opening baseline.

    Evidence and next step
    Evidence basis
    Existing governed mixed-period opening-transition reference.
    Next evidence needed
    Equivalent segmented and later-period evidence across the complete selected port-approach chain.
    Boundary
    No West Gate Tunnel opening benefit or failure verdict can be issued from the mixed-period reference alone.
    PENDING-06Operating window
    Segmentation or later-period evidence pending

    Did the worst overnight operating hours improve in later periods and in both directions?

    Current answer

    Eight separate hourly references and pressure profiles are frozen for every Tier A heading, with bridge directions kept separate.

    Evidence and next step
    Evidence basis
    Existing governed mixed-period opening-transition reference.
    Next evidence needed
    Later-period hourly observations compared hour-for-hour, plus segmented opening profiles without averaging directions together.
    Boundary
    No West Gate Tunnel opening benefit or failure verdict can be issued from the mixed-period reference alone.
    PENDING-07Displacement
    Segmentation or later-period evidence pending

    Did pressure reduce, redistribute as intended, or move elsewhere?

    Current answer

    The current monitored network ranking and community/network separation establish the mixed-period opening geography.

    Evidence and next step
    Evidence basis
    Existing governed mixed-period opening-transition reference.
    Next evidence needed
    Segmented and later-period network-wide change maps and corridor comparisons, including locations outside the immediate project footprint.
    Boundary
    No West Gate Tunnel opening benefit or failure verdict can be issued from the mixed-period reference alone.
    PENDING-08Durability
    Segmentation or later-period evidence pending

    Were any later measured improvements sustained?

    Current answer

    The frozen reference and quality gates are ready for repeated later-period monitoring.

    Evidence and next step
    Evidence basis
    Existing governed mixed-period opening-transition reference.
    Next evidence needed
    Separate stable operating-period assessments, followed by 90-, 180- and 365-day evaluations with seasonal, roadwork and incident context.
    Boundary
    No West Gate Tunnel opening benefit or failure verdict can be issued from the mixed-period reference alone.
    DATA-01Journey time
    Additional data required

    What was the complete origin-to-destination truck journey-time saving?

    Current answer

    Not established by the current detector dataset alone.

    Evidence and next step
    Evidence basis
    Current TIRTL and SCATS evidence can describe monitored conditions and changes, but not this claim by itself.
    Next evidence needed
    Linked journey observations or approved segment travel-time data covering complete freight paths.
    Boundary
    Do not infer this result from point speeds or sensor passings without the stated additional evidence.
    DATA-02Truck-hours
    Additional data required

    How many truck-hours were saved or lost?

    Current answer

    Not established by the current detector dataset alone.

    Evidence and next step
    Evidence basis
    Current TIRTL and SCATS evidence can describe monitored conditions and changes, but not this claim by itself.
    Next evidence needed
    Approved segment distances, governed reference travel times and a defensible method for aggregating detector evidence.
    Boundary
    Do not infer this result from point speeds or sensor passings without the stated additional evidence.
    DATA-03Unique vehicles
    Additional data required

    How many unique trucks used each route?

    Current answer

    Not established by the current detector dataset alone.

    Evidence and next step
    Evidence basis
    Current TIRTL and SCATS evidence can describe monitored conditions and changes, but not this claim by itself.
    Next evidence needed
    Privacy-governed vehicle linkage or another method that can distinguish unique vehicles from repeated sensor passings.
    Boundary
    Do not infer this result from point speeds or sensor passings without the stated additional evidence.
    DATA-04Origins and destinations
    Additional data required

    Where did individual freight journeys begin and end?

    Current answer

    Not established by the current detector dataset alone.

    Evidence and next step
    Evidence basis
    Current TIRTL and SCATS evidence can describe monitored conditions and changes, but not this claim by itself.
    Next evidence needed
    Origin-destination or linked trajectory evidence. A detector passing alone cannot identify the complete journey.
    Boundary
    Do not infer this result from point speeds or sensor passings without the stated additional evidence.
    DATA-05Economic value
    Additional data required

    What monetary productivity benefit was delivered?

    Current answer

    Not established by the current detector dataset alone.

    Evidence and next step
    Evidence basis
    Current TIRTL and SCATS evidence can describe monitored conditions and changes, but not this claim by itself.
    Next evidence needed
    Governed travel-time savings, vehicle operating costs, freight value and economic appraisal assumptions.
    Boundary
    Do not infer this result from point speeds or sensor passings without the stated additional evidence.
    DATA-06Emissions
    Additional data required

    What emissions benefit was delivered?

    Current answer

    Not established by the current detector dataset alone.

    Evidence and next step
    Evidence basis
    Current TIRTL and SCATS evidence can describe monitored conditions and changes, but not this claim by itself.
    Next evidence needed
    Distance, vehicle technology, speed-cycle and emissions-model inputs beyond the current detector pressure evidence.
    Boundary
    Do not infer this result from point speeds or sensor passings without the stated additional evidence.
    DATA-07Causation
    Additional data required

    Can every observed change be attributed solely to the project?

    Current answer

    Not established by the current detector dataset alone.

    Evidence and next step
    Evidence basis
    Current TIRTL and SCATS evidence can describe monitored conditions and changes, but not this claim by itself.
    Next evidence needed
    A causal evaluation controlling for incidents, roadworks, economic conditions, seasonality, enforcement and other network changes.
    Boundary
    Do not infer this result from point speeds or sensor passings without the stated additional evidence.
    Flagship opportunity

    West Gate Tunnel Freight Benefits Monitor

    A long-term, independent before-and-after program to test how the project changes freight movements, travel conditions, inner-west traffic pressure and access to the Port of Melbourne.

    Project geographyWest Gate project + western approaches
    Map 02
    Loading project map
    Truck redistribution Baseline → post-opening

    Track shifts between the bridge, tunnel, port approaches and inner-west routes.

    Current baseline · clean change pending
    Travel conditions Speed, pressure and reliability

    Measure changes by direction, time of day and vehicle classification.

    Speed · pressure · reliability connected
    Community effect Local-road movement change

    Test whether freight and general traffic pressure reduces on key inner-west roads.

    Baseline capability · community layer pending
    Media snapshot · Brooklyn eastbound WGT screenline

    Brooklyn WGT screenline. About 4,712 truck passings per recent accepted weekday.

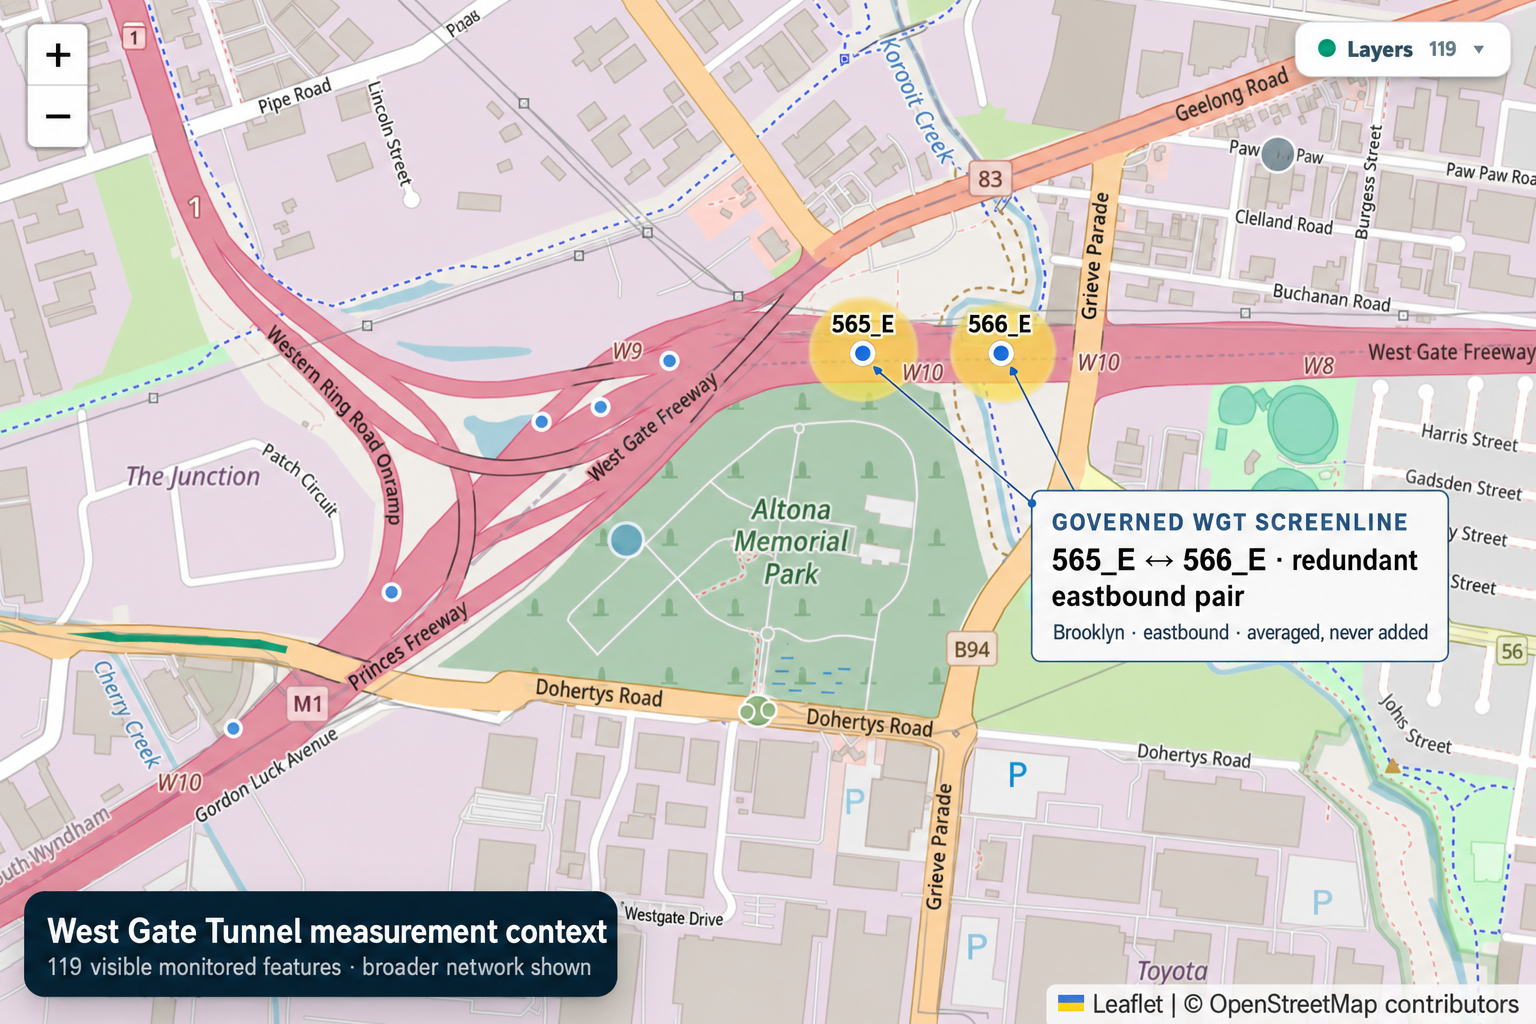
    The primary TIRTL counters, 565_E and 566_E, are physically located in Brooklyn on the eastbound WGT inbound main carriageway. This report averages those redundant counters to measure classified traffic passings at that Brooklyn screenline as the monitored stream continues east toward the Yarraville / Spotswood tunnel-entry precinct near Williamstown Road. This is a screenline traffic measure, not a direct census of vehicles entering the West Gate Tunnel.

    Screenline analysis readyTruck classification and redundant-counter reconciliation are governed and exact. Direct tunnel-entry attribution is not claimed.
    Map showing the governed Brooklyn eastbound WGT screenline sensors 565_E and 566_E as the redundant measurement pair.
    Governed WGT measurement location 565_E and 566_E form the redundant Brooklyn eastbound WGT screenline pair. The counters are averaged, never added; the image shows the physical measurement context upstream of the Yarraville / Spotswood tunnel-entry precinct.
    Measurement gap · proposed future monitoring

    The remaining public measurement gap: a directly identifiable tunnel-entry screenline

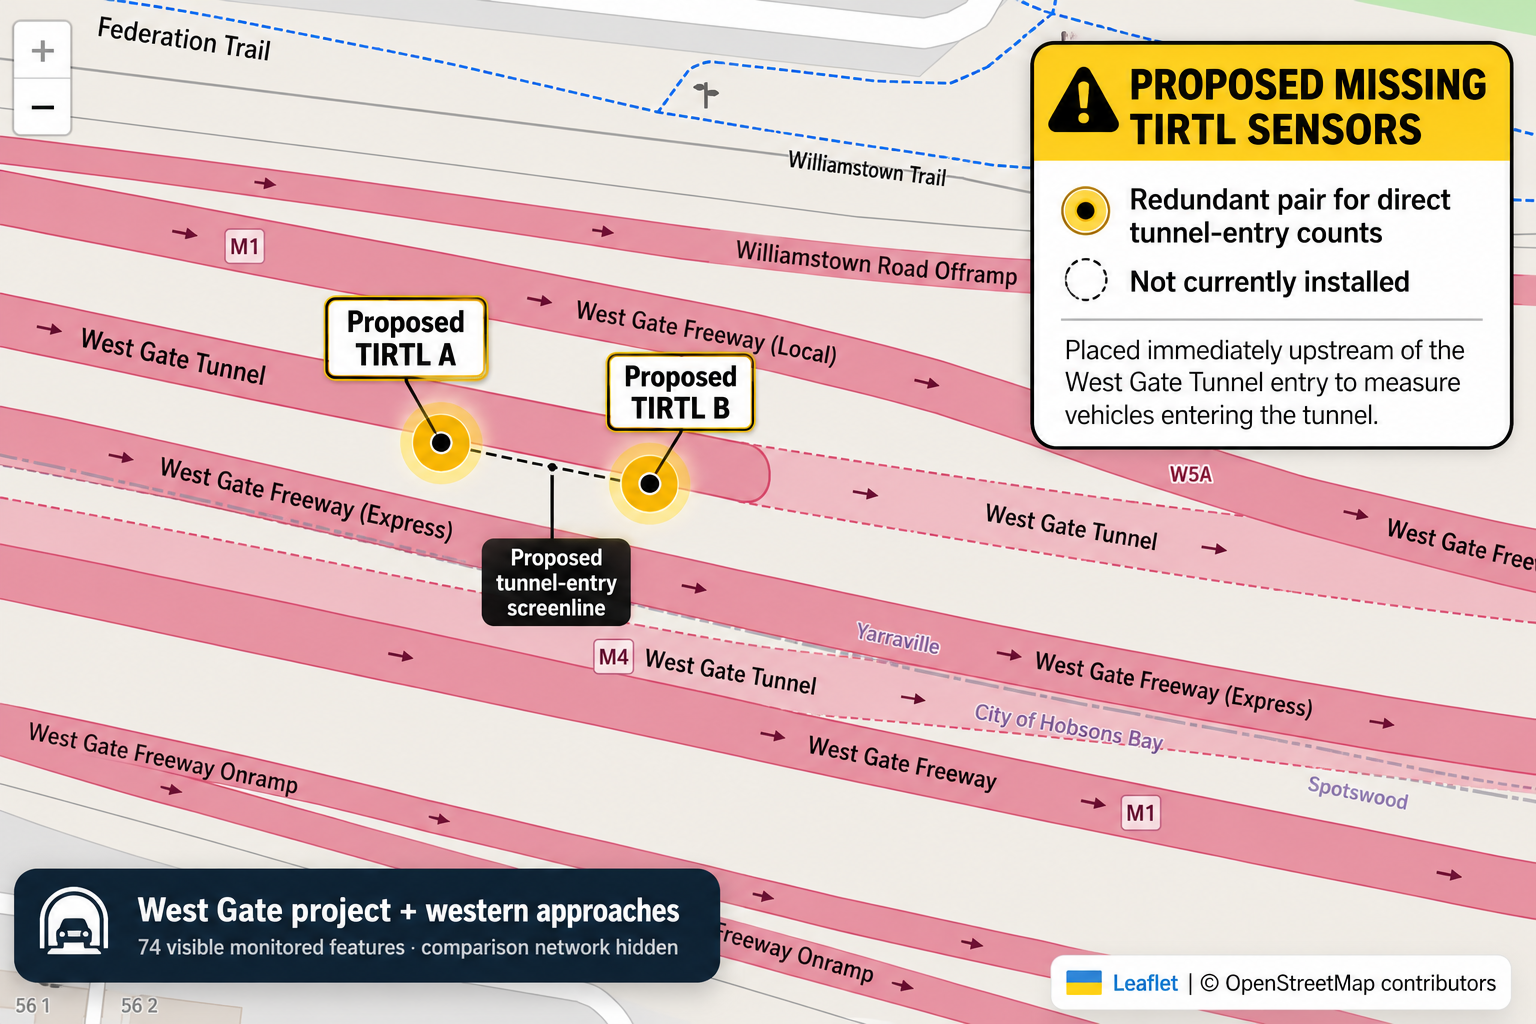
    The governed 565_E / 566_E pair in Brooklyn measures the eastbound WGT stream upstream. That is valuable evidence, but the Brooklyn screenline does not by itself establish which observed vehicles ultimately enter the West Gate Tunnel. A second redundant pair immediately upstream of the tunnel entrance would move the measurement point to where the tunnel-entry question can be observed directly.

    Proposed monitoring concept No equivalent publicly identifiable TIRTL redundant pair has been identified in the evidence reviewed for this project.
    Concept map showing a proposed redundant pair of TIRTL sensors immediately upstream of the West Gate Tunnel entrance to form a direct tunnel-entry screenline.
    Illustrative proposed screenline. The yellow markers show the monitoring concept only. Exact sensor positions, lane coverage and installation feasibility would require engineering and road-authority verification.

    Why a tunnel-entry pair would materially improve the evidence

    1 Direct tunnel-entry counts

    Measure classified vehicle and truck passings at the tunnel approach itself rather than using the upstream Brooklyn screenline as a proxy for final tunnel entry.

    2 Independent redundancy and quality control

    Two nearby counters provide a consistency check against sensor faults or incomplete observations. As with 565_E / 566_E, the redundant observations should be reconciled and averaged or consensed — never added as separate traffic streams.

    3 Measure tunnel uptake more defensibly

    A governed portal-adjacent screenline could be compared with the upstream Brooklyn screenline to better quantify how much monitored eastbound traffic reaches the tunnel-entry point, subject to verified road topology and matched observation periods.

    4 Stronger public and freight accountability

    Direct observations would support clearer reporting of tunnel usage, heavy-vehicle share and change over time without turning an upstream traffic count into an inferred tunnel-entry total.

    Without a sensor pair at the tunnel-entry screenline, the Brooklyn count is strong evidence of approaching traffic — but it is not a direct count of vehicles entering the tunnel.
    Evidence boundary. This is a public-interest monitoring proposal, not an assertion that these exact devices are absent from every operational system. It records that an equivalent publicly identifiable TIRTL redundant pair has not been found in the evidence reviewed for this project. Final siting would require confirmation of carriageway topology, lane coverage, safety, power/communications, road ownership and engineering feasibility.
    Where this traffic is measured — and where it is heading
    Brooklyn TIRTL 565_E + 566_E

    Two redundant eastbound WGT inbound main-carriageway counters. They are averaged, never added, and form the physical measurement basis for the flagship weekday traffic and truck statistics.

    Measured here
    Yarraville / Spotswood Citybound tunnel-entry precinct

    The monitored traffic stream continues east toward the citybound West Gate Tunnel entrance near Williamstown Road, at the Yarraville / Spotswood freeway interface.

    Tunnel approach
    Yarraville Bundawanh Tunnel

    Official project material describes the citybound tunnel as 2.8 km long, entering from the West Gate Freeway just before Williamstown Road and running under Yarraville.

    Citybound tunnel
    What the headline number representsClassified passings at the Brooklyn eastbound WGT screenline — not direct tunnel-entry counts.

    The latest 28 accepted weekdays (2026-06-03 to 2026-07-29) average 60,056 classified vehicle passings and 4,712 truck passings at the 565_E / 566_E Brooklyn screenline. The monitored carriageway continues east toward the Yarraville / Spotswood tunnel-entry precinct, but this dataset does not independently identify every observed vehicle's final tunnel/road destination.

    Measurement boundary. The sensors are in Brooklyn, not Yarraville or Spotswood. They measure the eastbound WGT inbound stream upstream of the Yarraville / Spotswood tunnel-entry precinct. The results must not be described as a direct count of West Gate Tunnel entries. They are classified screenline passings; final route choice is not linked at the individual-vehicle level.
    SCREENLINE MEASURE — NOT A DIRECT TUNNEL-ENTRY COUNT. All headline WGT figures below are classified passings measured at the redundant 565_E / 566_E Brooklyn screenline. The pair is averaged, never added. The figures do not identify unique vehicles, linked journeys or every vehicle's final tunnel/road destination.
    Brooklyn screenline · latest 28 accepted weekdays60,056classified vehicle passings / weekday · 565_E + 566_E averaged
    Brooklyn screenline · latest 28 accepted weekdays4,712truck passings / weekday · 7.85% truck share
    Peak weekday truck hour408/h06:00-07:00 · about one passing every 8.8 seconds
    Current governed coverage129accepted weekdays · 180 accepted days through 2026-08-01
    Accepted-weekday average4,752 truck passings

    8.01% truck share across 129 accepted weekdays — about one passing every 18.2 seconds.

    Highest freight concentration · 02:00-03:0026.1% trucks

    Truck share is highest during this low-volume overnight hour; this is a share of classified screenline passings.

    Overnight freight · 10pm-6am929 truck passings

    12.6% truck share across the eight-hour accepted-weekday window.

    Media-ready summary
    At the 565_E / 566_E Brooklyn eastbound WGT screenline, the latest 28 accepted weekdays average about 60,056 classified vehicle passings and 4,712 truck passings per weekday (7.85% of classified traffic). At the accepted-weekday freight peak, 06:00-07:00, the screenline averages about 408 truck passings an hour — roughly one every 8.8 seconds. This is a screenline measure upstream of the Yarraville / Spotswood tunnel-entry precinct, not a direct count of tunnel entries.
    Truck classificationvehicle_class >= 4 · BASE and UPDATE aggregate reconciliation PASS_EXACT
    Physical measurement565_E + 566_E · Brooklyn eastbound WGT screenline · averaged, never added
    Observation boundaryScreenline passings · not unique vehicles · not linked journeys · not direct tunnel entries
    Governed period2025-12-15 → 2026-08-01 · 180 accepted days
    How to quote these numbers. Say “about 4,712 truck passings per recent accepted weekday at the Brooklyn eastbound WGT screenline”. Do not shorten this to “4,712 trucks enter the West Gate Tunnel each weekday”. The counters measure a monitored upstream screenline; they do not independently resolve each vehicle's final route choice.
    Opening-to-latest governed Brooklyn screenline trend

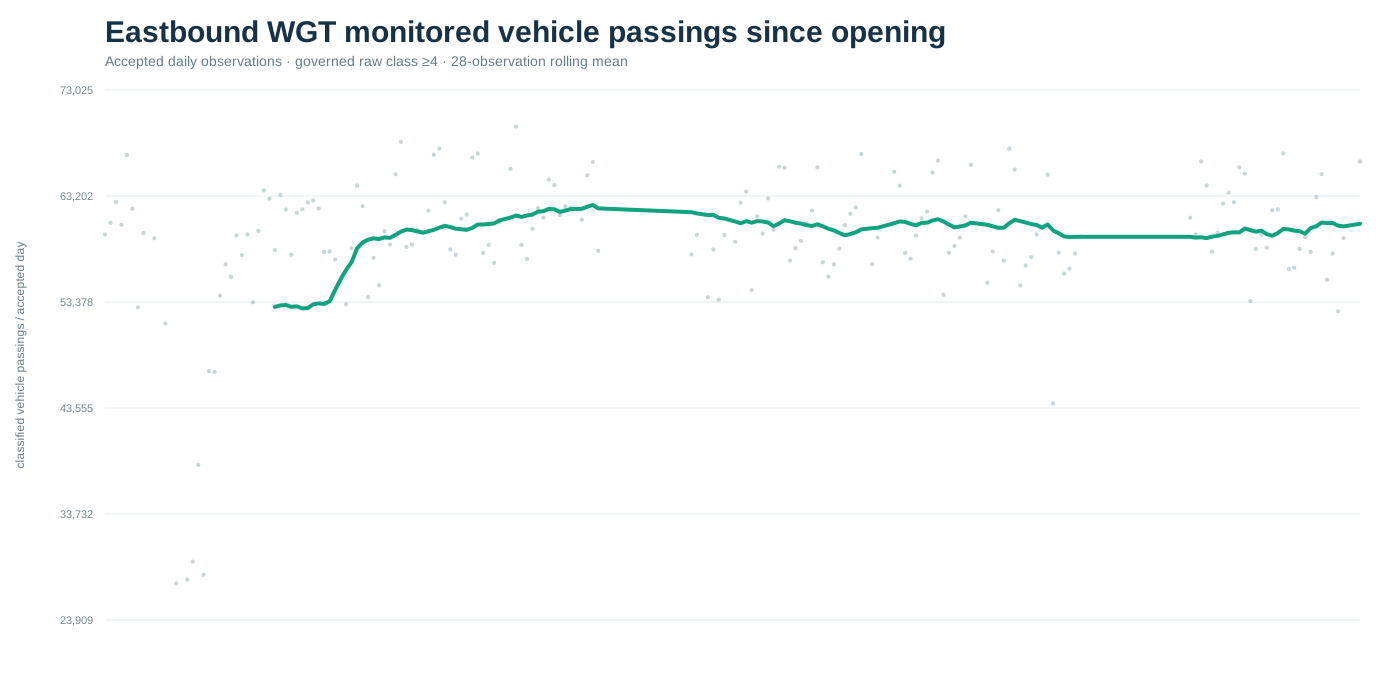
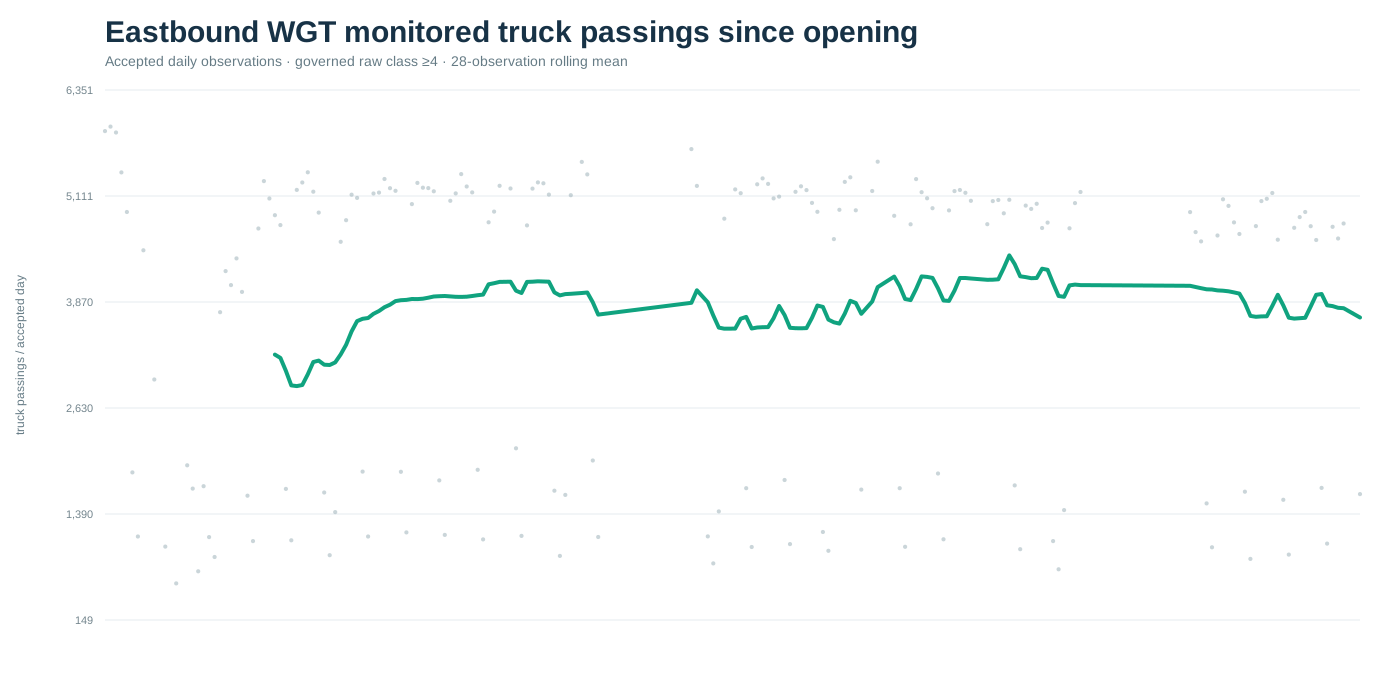
    Ramp-up, then a broadly stable Brooklyn eastbound WGT screenline

    At the Brooklyn 565_E / 566_E screenline, the latest 28 accepted weekdays average 60,056 classified vehicle passings and 4,712 truck passings per weekday. Compared with the accepted February-March mature-period baseline, vehicle passings are -1.51% and truck passings are -6.52%. These percentages describe change at the monitored screenline; they are not direct West Gate Tunnel entry counts.

    Through 2026-08-01 180 accepted days · 129 accepted weekdays
    Measured: Brooklyn 565_E / 566_E screenlineeastbound WGT inbound main carriagewayDownstream context: Yarraville / Spotswood tunnel-entry precinct
    Brooklyn screenline · latest 28 accepted weekdays60,056classified vehicle passings / weekday
    Brooklyn screenline · latest 28 accepted weekdays4,712truck passings / weekday · 7.85% truck share
    Opening-period screenline baseline → latest+7.47%vehicles · +14.75% trucks
    Feb-Mar mature screenline baseline → latest-1.51%vehicles · -6.52% trucks
    How to read the change.

    The first 28 accepted post-opening weekdays include the Christmas / January recovery period, so the opening comparison is useful as a ramp-up indicator rather than a seasonally adjusted growth rate. The February-March comparison provides the more mature operating benchmark. Both comparisons describe the Brooklyn screenline, not direct tunnel-entry totals.

    Daily classified vehicle passings at the Brooklyn eastbound WGT 565_E / 566_E screenline, with a 28-observation rolling mean.
    Brooklyn screenline vehicle passings - accepted high-confidence days. The rolling line is descriptive and not seasonally adjusted.
    Daily classified truck passings at the Brooklyn eastbound WGT 565_E / 566_E screenline, with a 28-observation rolling mean.
    Brooklyn screenline truck passings - governed raw classification uses vehicle_class >= 4.
    Screenline method

    565_E and 566_E are redundant eastbound counters and are averaged, never added. Accepted days require complete 15-minute coverage at both sensors, vehicle disagreement ≤2% and truck disagreement ≤5%.

    Governance

    Both historical and rolling-update 15-minute aggregates reconcile exactly to the raw governed vehicle_class >= 4 reconstruction before publication.

    Scope

    These are classified passings at the 565_E / 566_E Brooklyn eastbound WGT screenline. The pair is averaged, never added. The results are not unique vehicles, linked journeys or a direct census of West Gate Tunnel entries.

    Evidence products

    Designed for advocacy, committees and members.

    The platform publishes concise public evidence while retaining deeper technical detail for expert review, industry discussion and member use.

    01

    Victorian Freight Network Scorecard

    A recurring executive report covering volumes, speeds, reliability, corridor pressure and emerging abnormal conditions.

    • Monthly or quarterly release
    • Statewide and corridor views
    • Media-ready evidence
    02

    Freight Infrastructure Priorities

    A defensible ranking connecting measured freight exposure with road condition, maintenance and investment requirements.

    • Government engagement
    • Budget submissions
    • Committee priorities
    03

    Major Project Benefits Monitor

    Independent before-and-after measurement for major projects, disruptions and network interventions.

    • Long-term baselines
    • Measured outcomes
    • Transparent methodology
    04

    Freight Operating Windows

    Historical evidence on higher- and lower-pressure periods to inform operational and policy conversations.

    • Time-of-day profiles
    • Direction-specific analysis
    • Off-peak evidence
    Evidence downloads

    Inspect the evidence behind the page.

    Download the connected data release, source audit, executive findings, corridor profiles or a printable evidence brief.

    Data Library

    Download the evidence behind the platform.

    Search and download the public governed CSV, JSON, GeoJSON, QA, methodology and supporting analytical products used across Victorian Freight Network Intelligence. Superseded and retired products are hidden from the default catalogue.

    Loading governed products…
    Loading Data Library…
    Interpretation matters. Classified detector passings are observations rather than unique vehicles or complete journeys. Point-speed pressure is not complete journey delay, monetary loss or truck-hours lost. Dataset-specific methodology and governance products remain authoritative.
    Evidence register

    Search every connected profile and finding.

    Filter the evidence by name, source, status or VTA relevance. Every row preserves its interpretation safeguard.

    0 records
    Connected freight evidence register
    EvidencePrimary measureStatusVTA applicationSource
    Loading evidence register…
    Methodology, governance and reproducibility

    How the evidence was created, tested and bounded.

    This platform was constructed through a staged analytical workflow rather than from a single spreadsheet or browser calculation. Source records were imported into analytical databases, enriched with spatial and directional context, subjected to completeness and evidence-quality gates, transformed into purpose-specific products, and exported into reviewable CSV, JSON, map, graph and web assets. Each public result retains a source stage, calculation meaning and interpretation boundary.

    12+ yearsSCATS movement history, with coverage varying by site and date
    3.13B+TIRTL classified sensor records represented by the platform
    159.6M+classified truck passings, not unique trucks or journeys
    269Tier A site-headings suitable for full governed temporal comparison
    119governed paired whole-site freight locations
    202 dayscurrent governed TIRTL analytical window, 1 Nov 2025–21 May 2026

    From official source to public conclusion

    The browser is a presentation layer. Rankings, profiles and review screens are generated upstream from governed analytical exports rather than calculated ad hoc from the page.

    01Source acquisition

    Obtain source files, record provenance, dates, schemas and licences.

    02Database construction

    Import and normalise records in DuckDB for repeatable SQL analysis.

    03Spatial and directional enrichment

    Attach coordinates, locality, corridor, heading and geographic context.

    04Evidence classification

    Apply completeness, density, pairing, temporal and tiering gates.

    05Analytical products

    Create rankings, corrected exposure, temporal, paired-site and speed evidence.

    06Publication and regression QA

    Export reviewable files, integrate the page and test integrity.

    01Scope, independence and review statusWhat this method describes and how the platform should be reviewed

    Victorian Freight Network Intelligence is an independent analytical publication prepared by Traffic Analytics and published by Spotswood Trailers. It is not an official Victorian Transport Association, Department of Transport and Planning or Victorian Government publication.

    The method describes the connected public evidence architecture through Stage 22.0.1 and Stage 23A.4.0, together with the Commercial Gold and West Gate question-register presentation layers. Later products consume governed upstream outputs rather than silently redefining them.

    Review principle: a technical reviewer should be able to move from a public finding to its metric definition, source stage, coverage window, quality status, downloadable table and interpretation boundary.

    Where the reviewed project materials do not expose an exact threshold or component weight, the value is not guessed. The responsible governed stage artifact remains the controlling source.

    02Source datasets and record semanticsTIRTL, SCATS, coordinates, boundaries and what one record actually means

    TIRTL classified traffic evidence

    TIRTL supplies classified passing records at monitored locations and headings. A TIRTL passing is one detector observation. It is not a unique truck, a unique load, an origin–destination movement or a complete journey. A vehicle may be observed at more than one monitored point.

    Official source: Department of Transport and Planning, TIRTL Traffic Counts. The platform separately identifies the official source-availability window and the governed period used by a published analytical release.

    SCATS movement evidence

    SCATS contributes long-term signal-derived movement observations for general traffic, intersection and local-road context. A SCATS movement must not automatically be described as a unique vehicle count. Coverage and completeness vary by site and date. The detailed upstream SCATS ingestion and cleaning specification belongs to the established SCATS workflow and is not reconstructed from this freight page.

    Coordinates and administrative geography

    The foundational TIRTL workflow combines the analytical database with site coordinates and official Vicmap locality polygons. Each coordinate-bearing site-heading is treated as a point; the containing locality polygon supplies the locality name. In the documented foundational build, 562 of 562 site-heading rows were matched and zero remained unmatched.

    Geographic boundary: the locality identifies the polygon containing the detector point. It does not mean all corridor effects are confined to that locality, and it does not make the output a complete council- or suburb-wide census.
    03Data engineering and spatial enrichmentHow technical source files become reviewable analytical products
    1. Acquire source files and preserve source names, dates, schema and provenance.
    2. Inspect fields, data types, temporal coverage, site identifiers and heading semantics.
    3. Import source records into DuckDB and construct repeatable analytical tables.
    4. Build site and site-heading masters using governed identifiers and coordinate sources.
    5. Convert required spatial boundaries into analysis-ready geometry.
    6. Run point-in-polygon and lookup joins for locality, council, electorate or other governed context.
    7. Create nightly, hourly, corridor-direction, paired-site and speed-evidence tables.
    8. Write CSV, JSON and GeoJSON products before rendering HTML, maps or graphs.

    The primary implementation technologies are DuckDB for analytical storage and SQL aggregation, Python for ingestion, validation, spatial processing and export generation, and PowerShell for repeatable orchestration. The public site is static HTML, CSS and JavaScript with Leaflet maps, Google Charts and generated PNG/SVG graph assets.

    Separation of concerns: the public browser does not create the governed evidence from raw source rows. It reads generated analytical assets. This prevents a display interaction from changing the upstream metric definition.

    Maps distinguish exact detector points from inferred analytical corridor lines. An inferred line connecting monitored locations is a presentation of monitored corridor evidence; it is not necessarily a surveyed or road-centreline-snapped engineering alignment.

    04Evidence architectureWhy direction, corrected exposure, timing, paired sites and speed are kept separate

    Raw site-heading evidence

    One monitored direction at one location. Used for exact sensor inspection, directional volume, truck share and raw overnight rankings.

    Corrected corridor-direction exposure

    Repeated monitoring is consolidated into governed corridor-direction components before community or political-geography interpretation. This prevents a corridor with more detector headings from automatically receiving proportionally more weight solely because it is monitored more densely.

    Temporal freight pressure

    Eligible records are organised across the complete eight-hour overnight window from 10 pm to 6 am. The analysis examines onset, peak, persistence and release, subject to complete-hour, outage, source-boundary and daylight-saving rules.

    Paired whole-site evidence

    Complementary directions are joined only under a governed paired-site identifier. This supports combined two-way freight scale, dominant-direction share, imbalance and balanced-night measures. Arbitrary headings must not be combined.

    Point-speed pressure and reliability

    Governed truck speed-bin evidence is reconstructed, validated and assigned an evidence tier before public temporal comparison. Relative point-speed measures are suitable for monitored pressure and reliability screening, but not for complete journey-time claims.

    05Analytical stage lineageThe dependency chain from raw rankings to governed operator and project questions
    Connected and proposed analytical stages. The downloadable lineage CSV provides the expanded register.
    StagePurposePublic roleStatusKey boundary
    Stage 17Direction-level overnight evidenceRaw monitored rankingsConnectedMonitoring density differs by corridor
    Stage 20.1–20.2Density correction and political geographyCorrected community/network exposureConnectedMonitored evidence, not complete jurisdiction census
    Stage 21.0.2Hourly temporal pressureOnset, peak and persistencePASSOvernight window and exclusion rules apply
    Stage 22.0.1Paired whole-site evidenceTwo-way scale, dominance and imbalancePASSPairing rules are fixed and governed
    Stage 23A.1–23A.3Speed provenance, reconstruction and tieringValidated publication populationPASSTier B descriptive; Tier C excluded
    Stage 23A.4.0Pressure and reliabilityRelative point-speed ranking and profilesPASSNot journey delay or economic loss
    Commercial GoldOperator-facing review screensPricing, contingency, fuel/wear and opportunity reviewRegression PASSSignals, not recommendations or exact costs
    Stage 23A.5Opening-period segmentationClean West Gate comparisonNot builtFresh coverage and density gates required
    Stage 23BJourney-time and delay evidencePotential journey or productivity productsBLOCKEDRequires linked journeys and governed distances
    06Metric definitions and auditable formulasWhat is calculated exactly and what remains controlled by a stage artifact

    Truck share

    truck share (%) = 100 × truck passings ÷ all classified vehicle passings

    Weighted truck share

    weighted truck share (%) = 100 × total truck passings ÷ total vehicle passings across the selected scope

    Observed-to-reference speed

    observed/reference (%) = 100 × governed observed truck speed ÷ hourly P85 reference speed

    Observed speed deficit

    speed deficit (km/h) = hourly P85 reference speed − governed observed truck speed

    The hourly P85 reference is a frozen observed upper-normal point-speed reference for a governed heading and hour. It is not the posted speed limit, an engineering free-flow speed or a pure pre-opening counterfactual.

    Pressure and recurrence

    Below-90%, below-80% and below-70% occurrence measures report the share of eligible governed hours below each relative threshold. The governed pressure index is a 0–100 composite point-speed measure derived from relative speed and recurrence evidence.

    Controlled formula disclosure: the exact pressure-index component weights and sustained-pressure rule are not reconstructed from presentation outputs. The Stage 23A.4 calculation artifact remains authoritative.

    Paired-site measures

    Average normalised eight-hour combined trucks represents governed two-direction passings normalised to the full overnight window. Median directional imbalance is the typical absolute difference between paired directional shares. Balanced nights report the share of eligible paired nights satisfying the governed Stage 22 rule.

    07Quality gates, evidence tiers and exclusionsHow incomplete or sparse evidence is prevented from entering inappropriate comparisons

    Quality gates are applied before evidence enters a public ranking or temporal comparison. Depending on the stage, gates address schema validity, coordinate availability, duplicate handling, complete hours, eligible nights, source boundaries, outages, daylight-saving transitions, evidence density, governed pairing and speed-bin completeness.

    Stage 23A evidence tiers and current governed publication population.
    TierCurrent populationPermitted useRestriction
    Tier A269 site-headingsFull governed temporal comparisonOne direction per heading; monitored evidence only
    Tier B12 site-headingsLong-period descriptive aggregate evidenceNot used for full temporal comparison
    Tier C2 site-headingsExcludedMust not enter public comparative ranking

    The Stage 23A.4 governed population includes 2,152 reference-ready heading-hours, 374,900 complete speed hours, 46,697 eligible heading-nights and 372,586 eligible pressure observations. Heading-nights are accumulated across headings; they are not unique network-wide calendar nights.

    Stage 22 contains 119 governed paired sites. Pair construction must remain fixed. A visually plausible pair is not sufficient unless it exists in the governed paired-site register.

    West Gate Bridge controlled exception: the public method retains the governed synthetic bridge-asset exception and completed legacy validation. The exception does not, by itself, remove either bridge direction from Tier A.
    08Missing values and null semanticsWhy unavailable evidence is not silently converted to zero

    The workflow distinguishes a measured zero from absent, incomplete, excluded or non-comparable evidence. These states have different meanings and must remain different in analytical tables and public presentation.

    • Measured zero: a valid eligible observation exists and the measured quantity is zero.
    • No record: no source row is present for the expected scope.
    • Incomplete hour: the hour fails the governing completeness rule.
    • Detector outage or source boundary: evidence is unavailable because the monitored source is not valid for that interval.
    • Excluded evidence: the record or heading fails an evidence gate.
    • Not applicable: the metric does not logically apply to the selected evidence object.
    • Not derivable: the available datasets cannot support the requested measure.
    Zero-filling prohibition: missing, excluded or unavailable evidence is not interpreted as zero traffic, zero pressure or zero impact.
    09Publication, reproducibility and regression QAHow reviewers can inspect more than the rendered webpage

    Major stages write explicit analytical files before web integration. These may include source manifests, CSV tables, JSON data products, GeoJSON layers, method notes, QA summaries, graphs and stage packages. The public HTML is therefore not the only evidence object.

    Web integrations use explicit START/END markers so a later script can replace its own governed block without rewriting unrelated sections. Integration scripts create timestamped backups, update both the framework and published roots, run structural audits and compare generated asset hashes.

    Static QA checks include marker uniqueness, required assets, duplicate IDs, internal-anchor integrity, expected source references, parseable JSON, required downloads and framework-to-published file equality. Browser QA should additionally examine console errors, failed requests, map/chart rendering, keyboard behaviour, mobile overflow and performance.

    Reproducibility principle: a reviewer does not need to trust the visual design alone. The methodology manifest, stage lineage, metric dictionary, evidence register and governed analytical downloads provide separate inspection routes.

    10Interpretation boundaries and blocked claimsWhat the evidence can describe and what it cannot establish by itself

    The connected evidence can describe monitored passings, movements, truck share, directional concentration, corrected exposure, temporal profiles, point-speed pressure, threshold recurrence, persistence and relative reliability.

    The current evidence does not, by itself, establish:
    • unique trucks, unique vehicles, origins, destinations, commodities or load status;
    • complete linked journeys, end-to-end travel time or journey delay;
    • truck-hours, litres, emissions, maintenance cost or productivity dollars;
    • a recommended price, surcharge, tariff or exact schedule buffer;
    • a confirmed backload or optimal depot, staging or cross-dock location;
    • the cause of a pressure or reliability episode;
    • a clean West Gate Tunnel opening benefit or failure verdict from the mixed reference alone.

    Stage 23B remains blocked until governed segment distances, linked travel times and complete journey definitions are available. Point-speed evidence must not be converted into journey delay, truck-hours or dollars without those inputs.

    11West Gate Tunnel period classificationWhy the current reference is not a pure pre-opening baseline

    The Stage 23A.4 frozen reference runs from 1 November 2025 to 21 May 2026. The West Gate Tunnel opened to traffic on 14 December 2025. The reference therefore contains 43 pre-opening nights and 159 nights on or after opening.

    The correct classification is a mixed pre-opening, opening-transition and early-operation reference. It is suitable as a frozen reference for later comparisons, but it cannot be described as a pure pre-opening baseline.

    A clean opening-effect study requires Stage 23A.5: separately governed pre-opening, transition and stable operating windows, with fresh coverage, density and completeness gates applied to each segment.

    Freeze ID: VTA_STAGE23A4_P85_20251101_20260521
    12Controlled method disclosures and next technical workDetails that must come from responsible stage artifacts rather than reconstruction

    This integration publishes every method detail supported by the reviewed project materials. It deliberately does not invent the following:

    • exact Stage 17 evidence-class thresholds;
    • the exact Stage 20.1 corridor-density correction formula;
    • the exact Stage 21 context thresholds and full excluded-night schedule;
    • the exact Stage 22 pairing criteria and balanced-night threshold;
    • the exact Stage 23A.3 Tier A/B/C threshold values;
    • the exact Stage 23A.4 pressure-index weights and sustained-pressure rule;
    • the complete upstream SCATS ingestion and cleaning specification;
    • the exact construction of the older combined freight-exposure score in the analytics workspace.
    Next technical-method stage: extract these values directly from the current governed manifests, QA reports or calculation code, publish them in a versioned method supplement and link each public metric to the exact controlling formula.
    Adoption pathway

    A focused 90-day adoption and validation program.

    Review the current evidence, apply it to agreed freight priorities and establish a repeatable publication and decision-support workflow.

    Decision room

    Compare corridors through the lens of VTA priorities.

    Compare canonical corridors using strict source-field ownership. Directional records are grouped beneath each corridor, ambiguous truck metrics are withheld, and governed pressure and speed joins remain visible.

    Connected corridor evidenceLoading...
    Comparison workspaceChoose up to three corridors
    No corridors selected
    Use the Compare buttons above to build a side-by-side evidence view.
    Release assuranceChecking connected release...

    Validating assets, data layers, duplicate IDs and publication readiness.

    Partnership and application

    Put the freight intelligence platform to work.

    Use the connected evidence to test priority questions, support government engagement and establish recurring freight scorecards, project monitors and corridor briefs.

    Contact Clarke Towson · clarke@spotswoodtrailers.com.au

    Phase 1Evidence and priority reviewDefine the decision, corridor and evidence boundary.
    Phase 2Applied corridor and project analysisBuild the governed comparison or monitoring product.
    Phase 3Recurring scorecards and briefingsRepeat the release with stable quality gates.