Run summary
- rows_loaded_before_filter: 371
- rows_after_public_metro_filter: 345
- rows_filtered_out: 26
- distance_filter_enabled: True
- max_distance_km: 75.0
- regional_name_guardrail_enabled: True
- filtered_out_csv: filtered_out_non_metro_or_regional_rows.csv
- graphs_created: 14
- before_filter_rows: 371
- before_filter_commute_cbd_am_peak_min_median: 39.13
- before_filter_commute_cbd_am_peak_min_p90: 63.88
- before_filter_commute_cbd_am_peak_min_min: 7.19
- before_filter_commute_cbd_am_peak_min_max: 158.07
- before_filter_commute_cbd_pm_return_min_median: 38.92
- before_filter_commute_cbd_pm_return_min_p90: 58.84
- before_filter_commute_cbd_pm_return_min_min: 8.25
- before_filter_commute_cbd_pm_return_min_max: 161.08
- before_filter_commute_cbd_offpeak_min_median: 33.93
- before_filter_commute_cbd_offpeak_min_p90: 52.58
- before_filter_commute_cbd_offpeak_min_min: 7.2
- before_filter_commute_cbd_offpeak_min_max: 154.3
- before_filter_commute_cbd_peak_delay_min_median: 5.9
- before_filter_commute_cbd_peak_delay_min_p90: 11.49
- before_filter_commute_cbd_peak_delay_min_min: -0.54
- before_filter_commute_cbd_peak_delay_min_max: 18.28
- before_filter_traffic_pressure_score_median: 47.19
- before_filter_traffic_pressure_score_p90: 80.92
- before_filter_traffic_pressure_score_min: 4.95
- before_filter_traffic_pressure_score_max: 98.45
- before_filter_quiet_commute_score_median: 50.46
- before_filter_quiet_commute_score_p90: 73.85
- before_filter_quiet_commute_score_min: 7.43
- before_filter_quiet_commute_score_max: 95.04
- before_filter_traffic_pain_index_median: 49.54
- before_filter_traffic_pain_index_p90: 73.21
- before_filter_traffic_pain_index_min: 4.96
- before_filter_traffic_pain_index_max: 92.57
- before_filter_commute_cbd_am_peak_distance_km_median: 24.7
- before_filter_commute_cbd_am_peak_distance_km_p90: 52.62
- before_filter_commute_cbd_am_peak_distance_km_min: 2.04
- before_filter_commute_cbd_am_peak_distance_km_max: 220.56
- after_filter_rows: 345
- after_filter_commute_cbd_am_peak_min_median: 37.96
- after_filter_commute_cbd_am_peak_min_p90: 57.14
- after_filter_commute_cbd_am_peak_min_min: 7.19
- after_filter_commute_cbd_am_peak_min_max: 77.57
- after_filter_commute_cbd_pm_return_min_median: 38.06
- after_filter_commute_cbd_pm_return_min_p90: 53.77
- after_filter_commute_cbd_pm_return_min_min: 8.25
- after_filter_commute_cbd_pm_return_min_max: 66.73
- after_filter_commute_cbd_offpeak_min_median: 33.06
- after_filter_commute_cbd_offpeak_min_p90: 47.59
- after_filter_commute_cbd_offpeak_min_min: 7.2
- after_filter_commute_cbd_offpeak_min_max: 59.57
- after_filter_commute_cbd_peak_delay_min_median: 5.71
- after_filter_commute_cbd_peak_delay_min_p90: 10.69
- after_filter_commute_cbd_peak_delay_min_min: -0.54
- after_filter_commute_cbd_peak_delay_min_max: 18.28
- after_filter_traffic_pressure_score_median: 48.58
- after_filter_traffic_pressure_score_p90: 81.68
- after_filter_traffic_pressure_score_min: 4.95
- after_filter_traffic_pressure_score_max: 98.45
- after_filter_quiet_commute_score_median: 52.96
- after_filter_quiet_commute_score_p90: 74.3
- after_filter_quiet_commute_score_min: 7.43
- after_filter_quiet_commute_score_max: 95.04
- after_filter_traffic_pain_index_median: 47.04
- after_filter_traffic_pain_index_p90: 73.13
- after_filter_traffic_pain_index_min: 4.96
- after_filter_traffic_pain_index_max: 92.57
- after_filter_commute_cbd_am_peak_distance_km_median: 23.68
- after_filter_commute_cbd_am_peak_distance_km_p90: 45.09
- after_filter_commute_cbd_am_peak_distance_km_min: 2.04
- after_filter_commute_cbd_am_peak_distance_km_max: 62.44
Input: melbourne_suburb_commute_intelligence_all_suburbs.csv
Filter note: Public charts are metro-filtered by default to avoid regional Victorian localities appearing in Melbourne suburb rankings. See filtered_out_non_metro_or_regional_rows.csv.
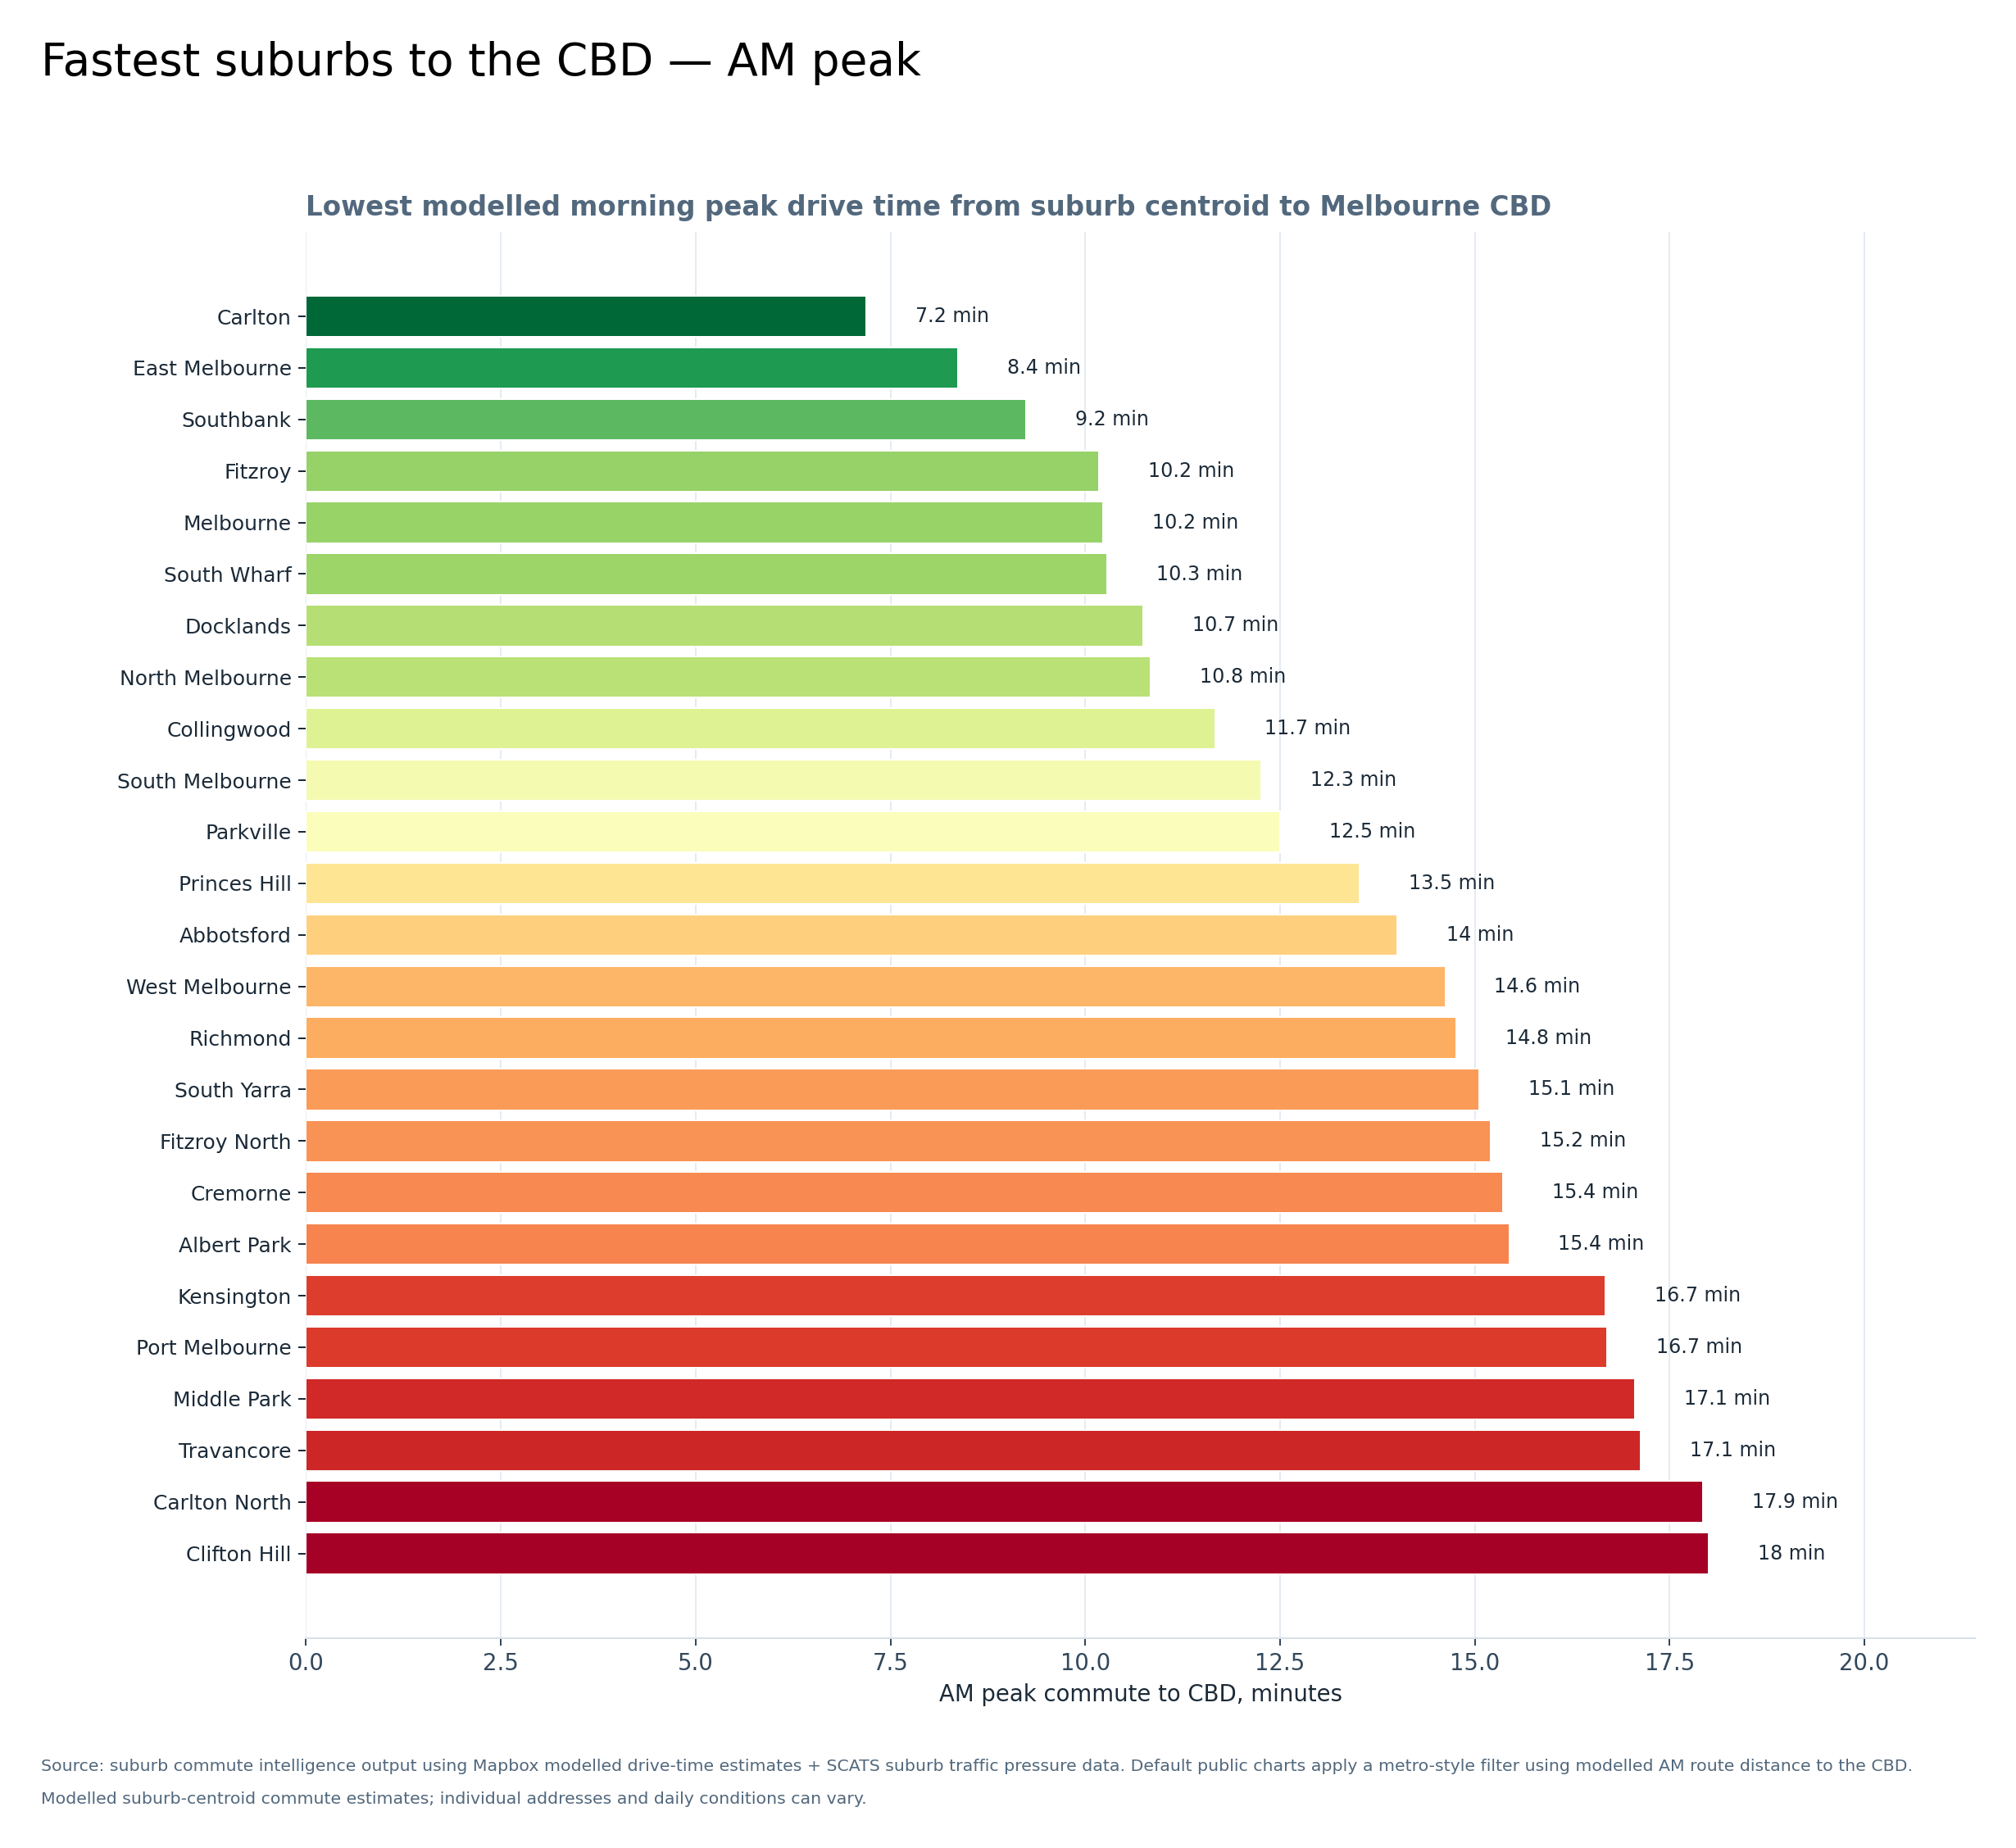
Fastest suburbs to the CBD — AM peak
Shows metro-filtered suburbs with the shortest modelled AM peak commute to the CBD.
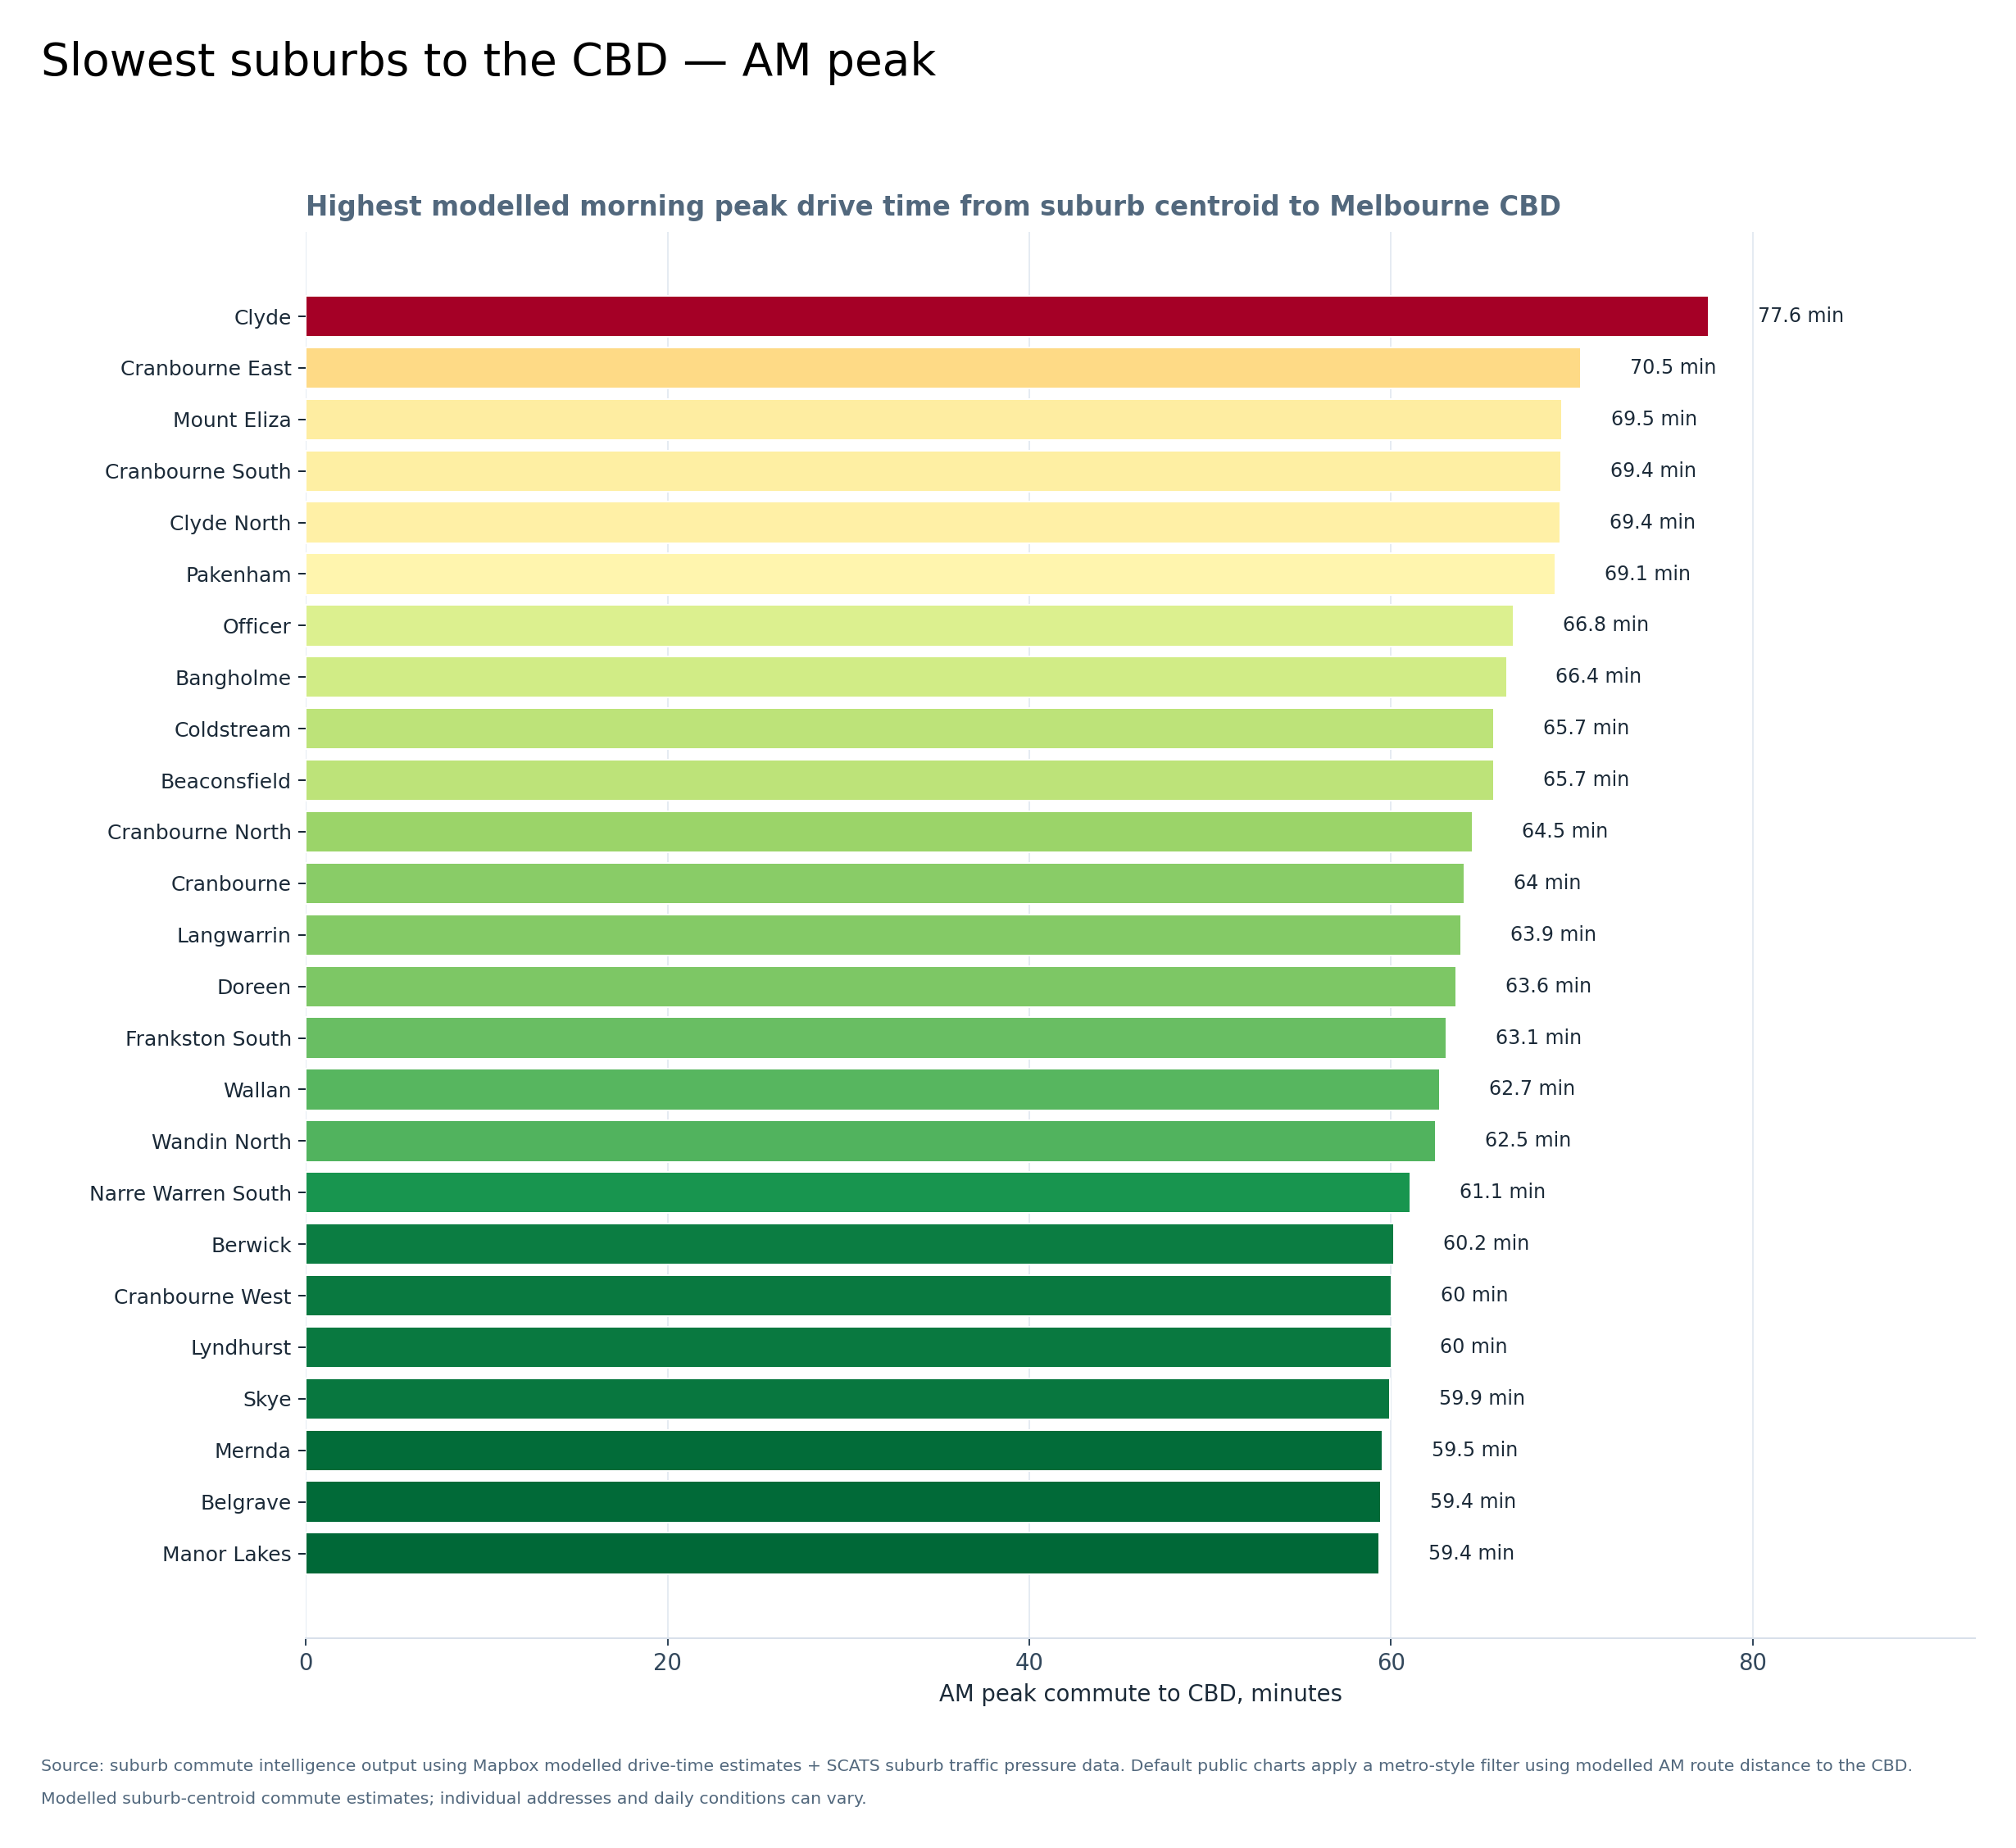
Slowest suburbs to the CBD — AM peak
Shows metro-filtered suburbs with the longest modelled AM peak commute to the CBD.
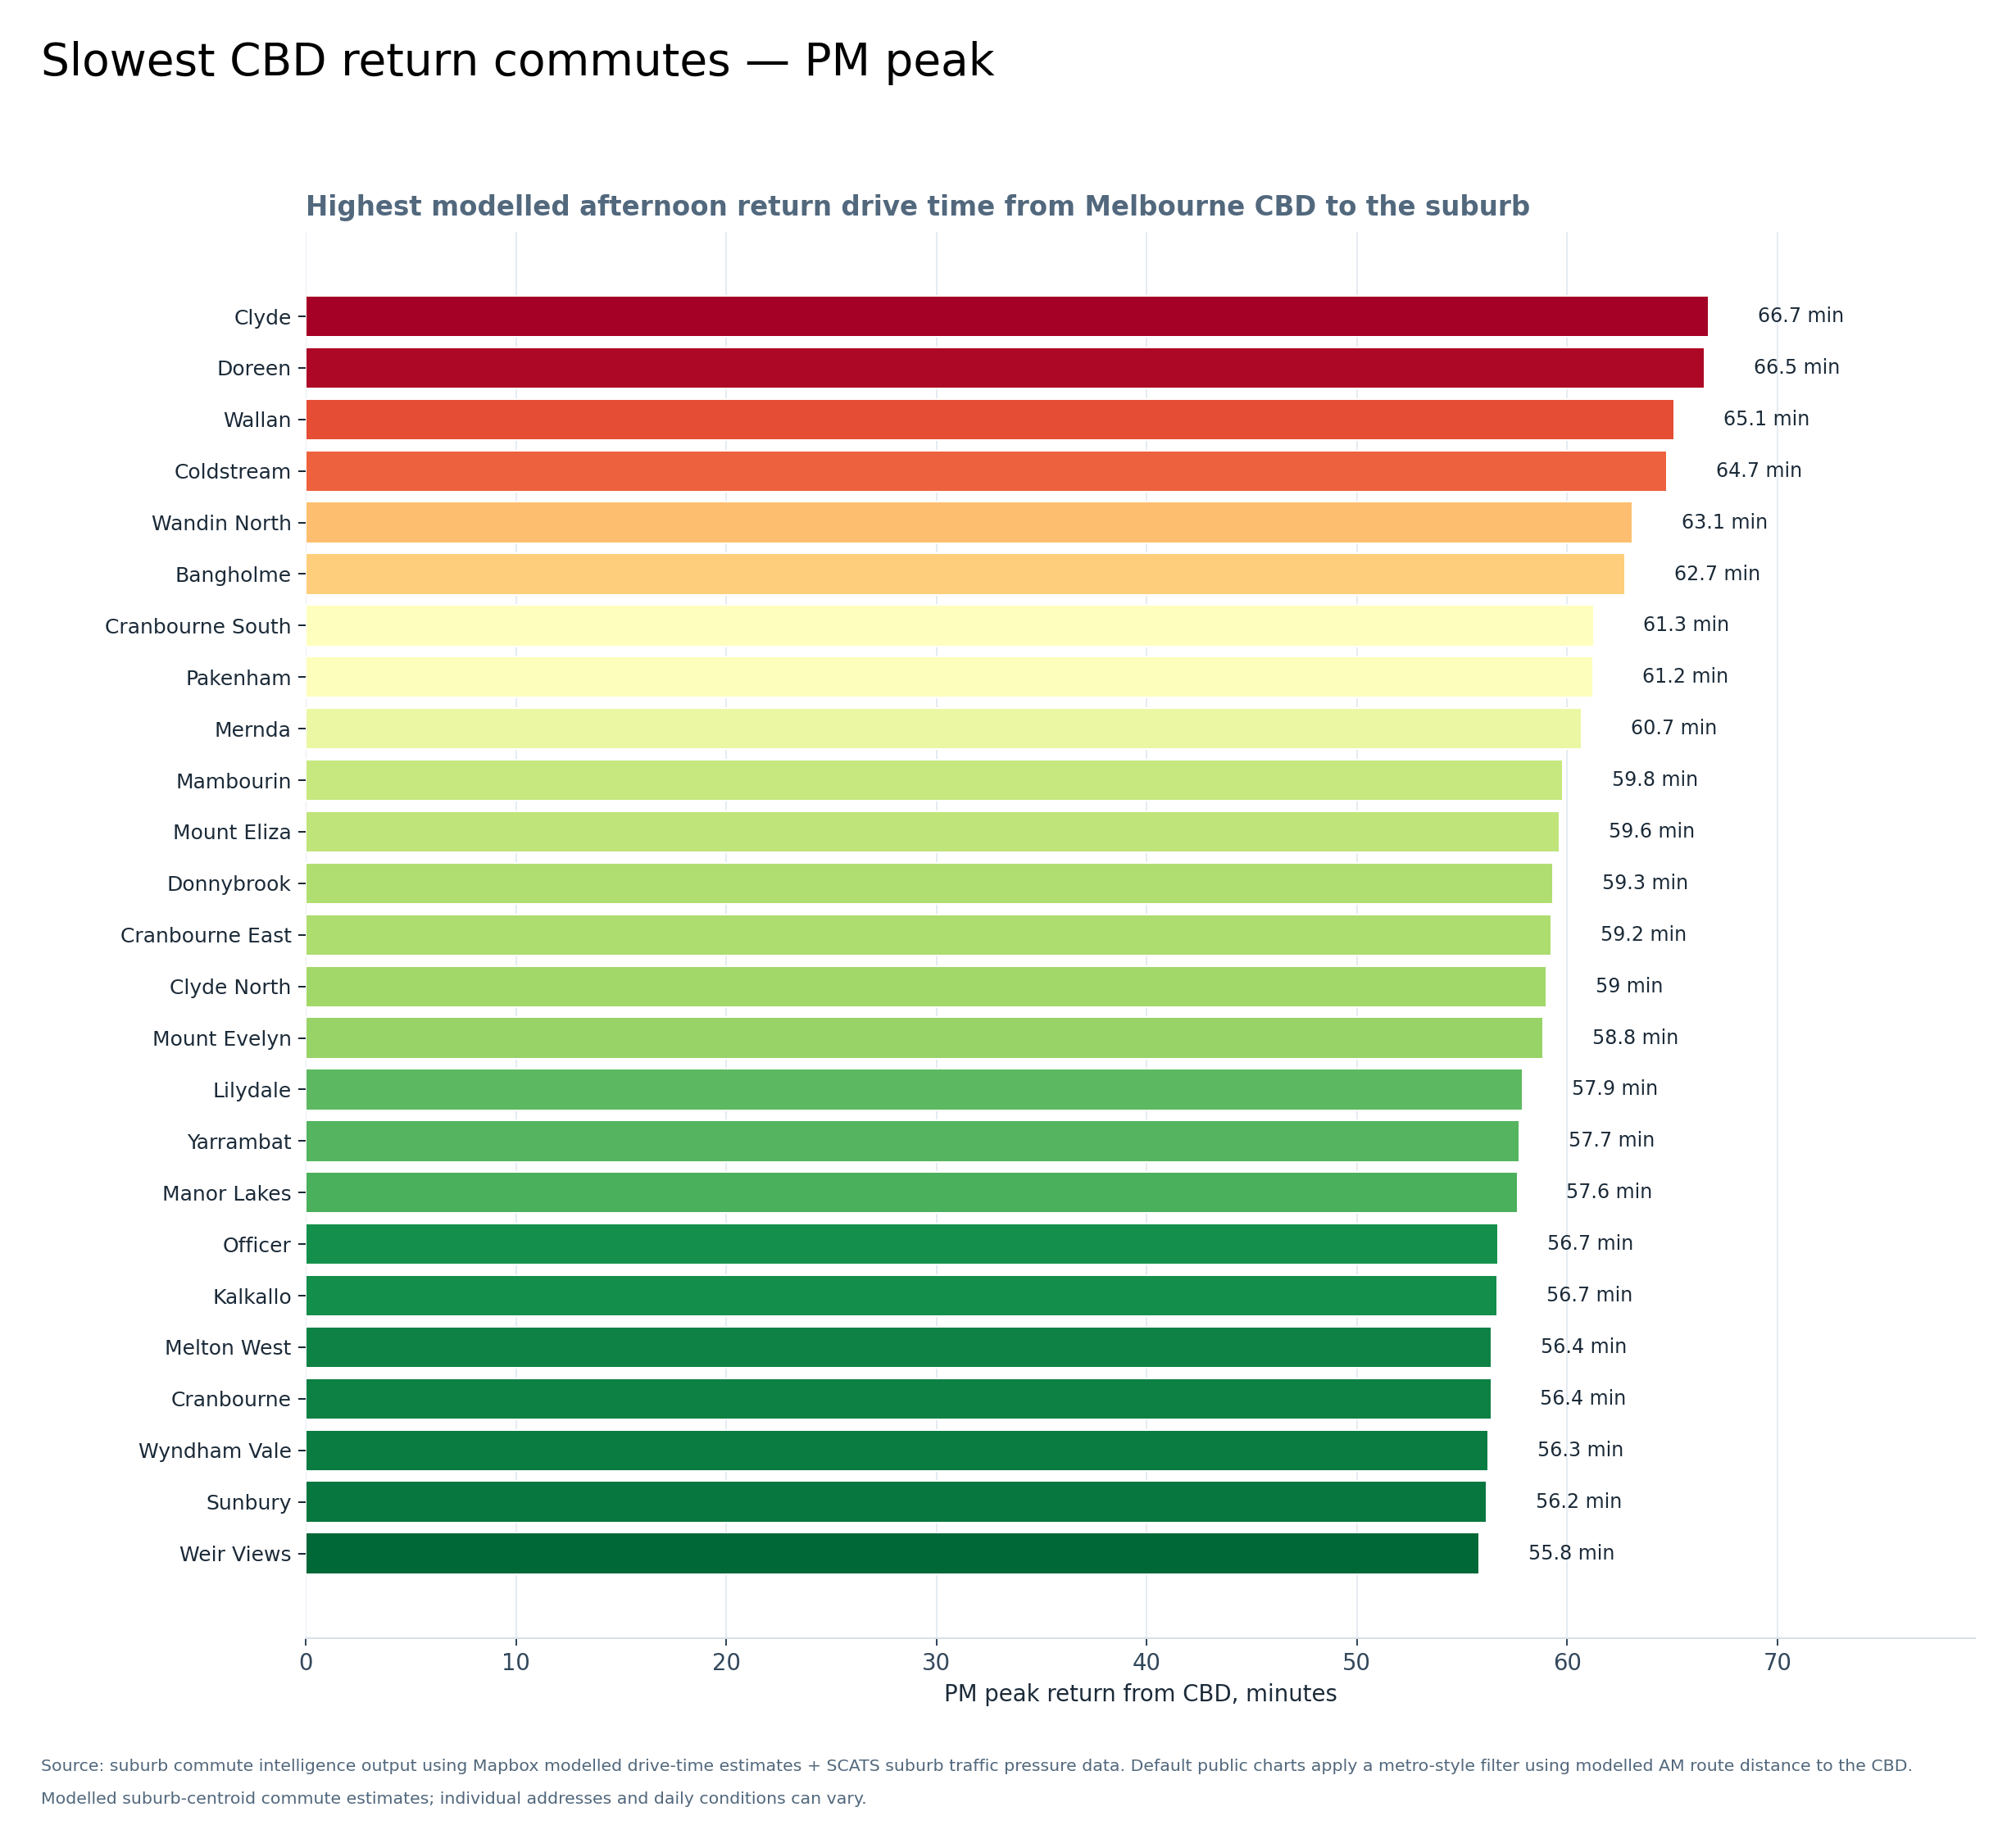
Slowest CBD return commutes — PM peak
Shows metro-filtered suburbs with the longest modelled PM return commute from the CBD.
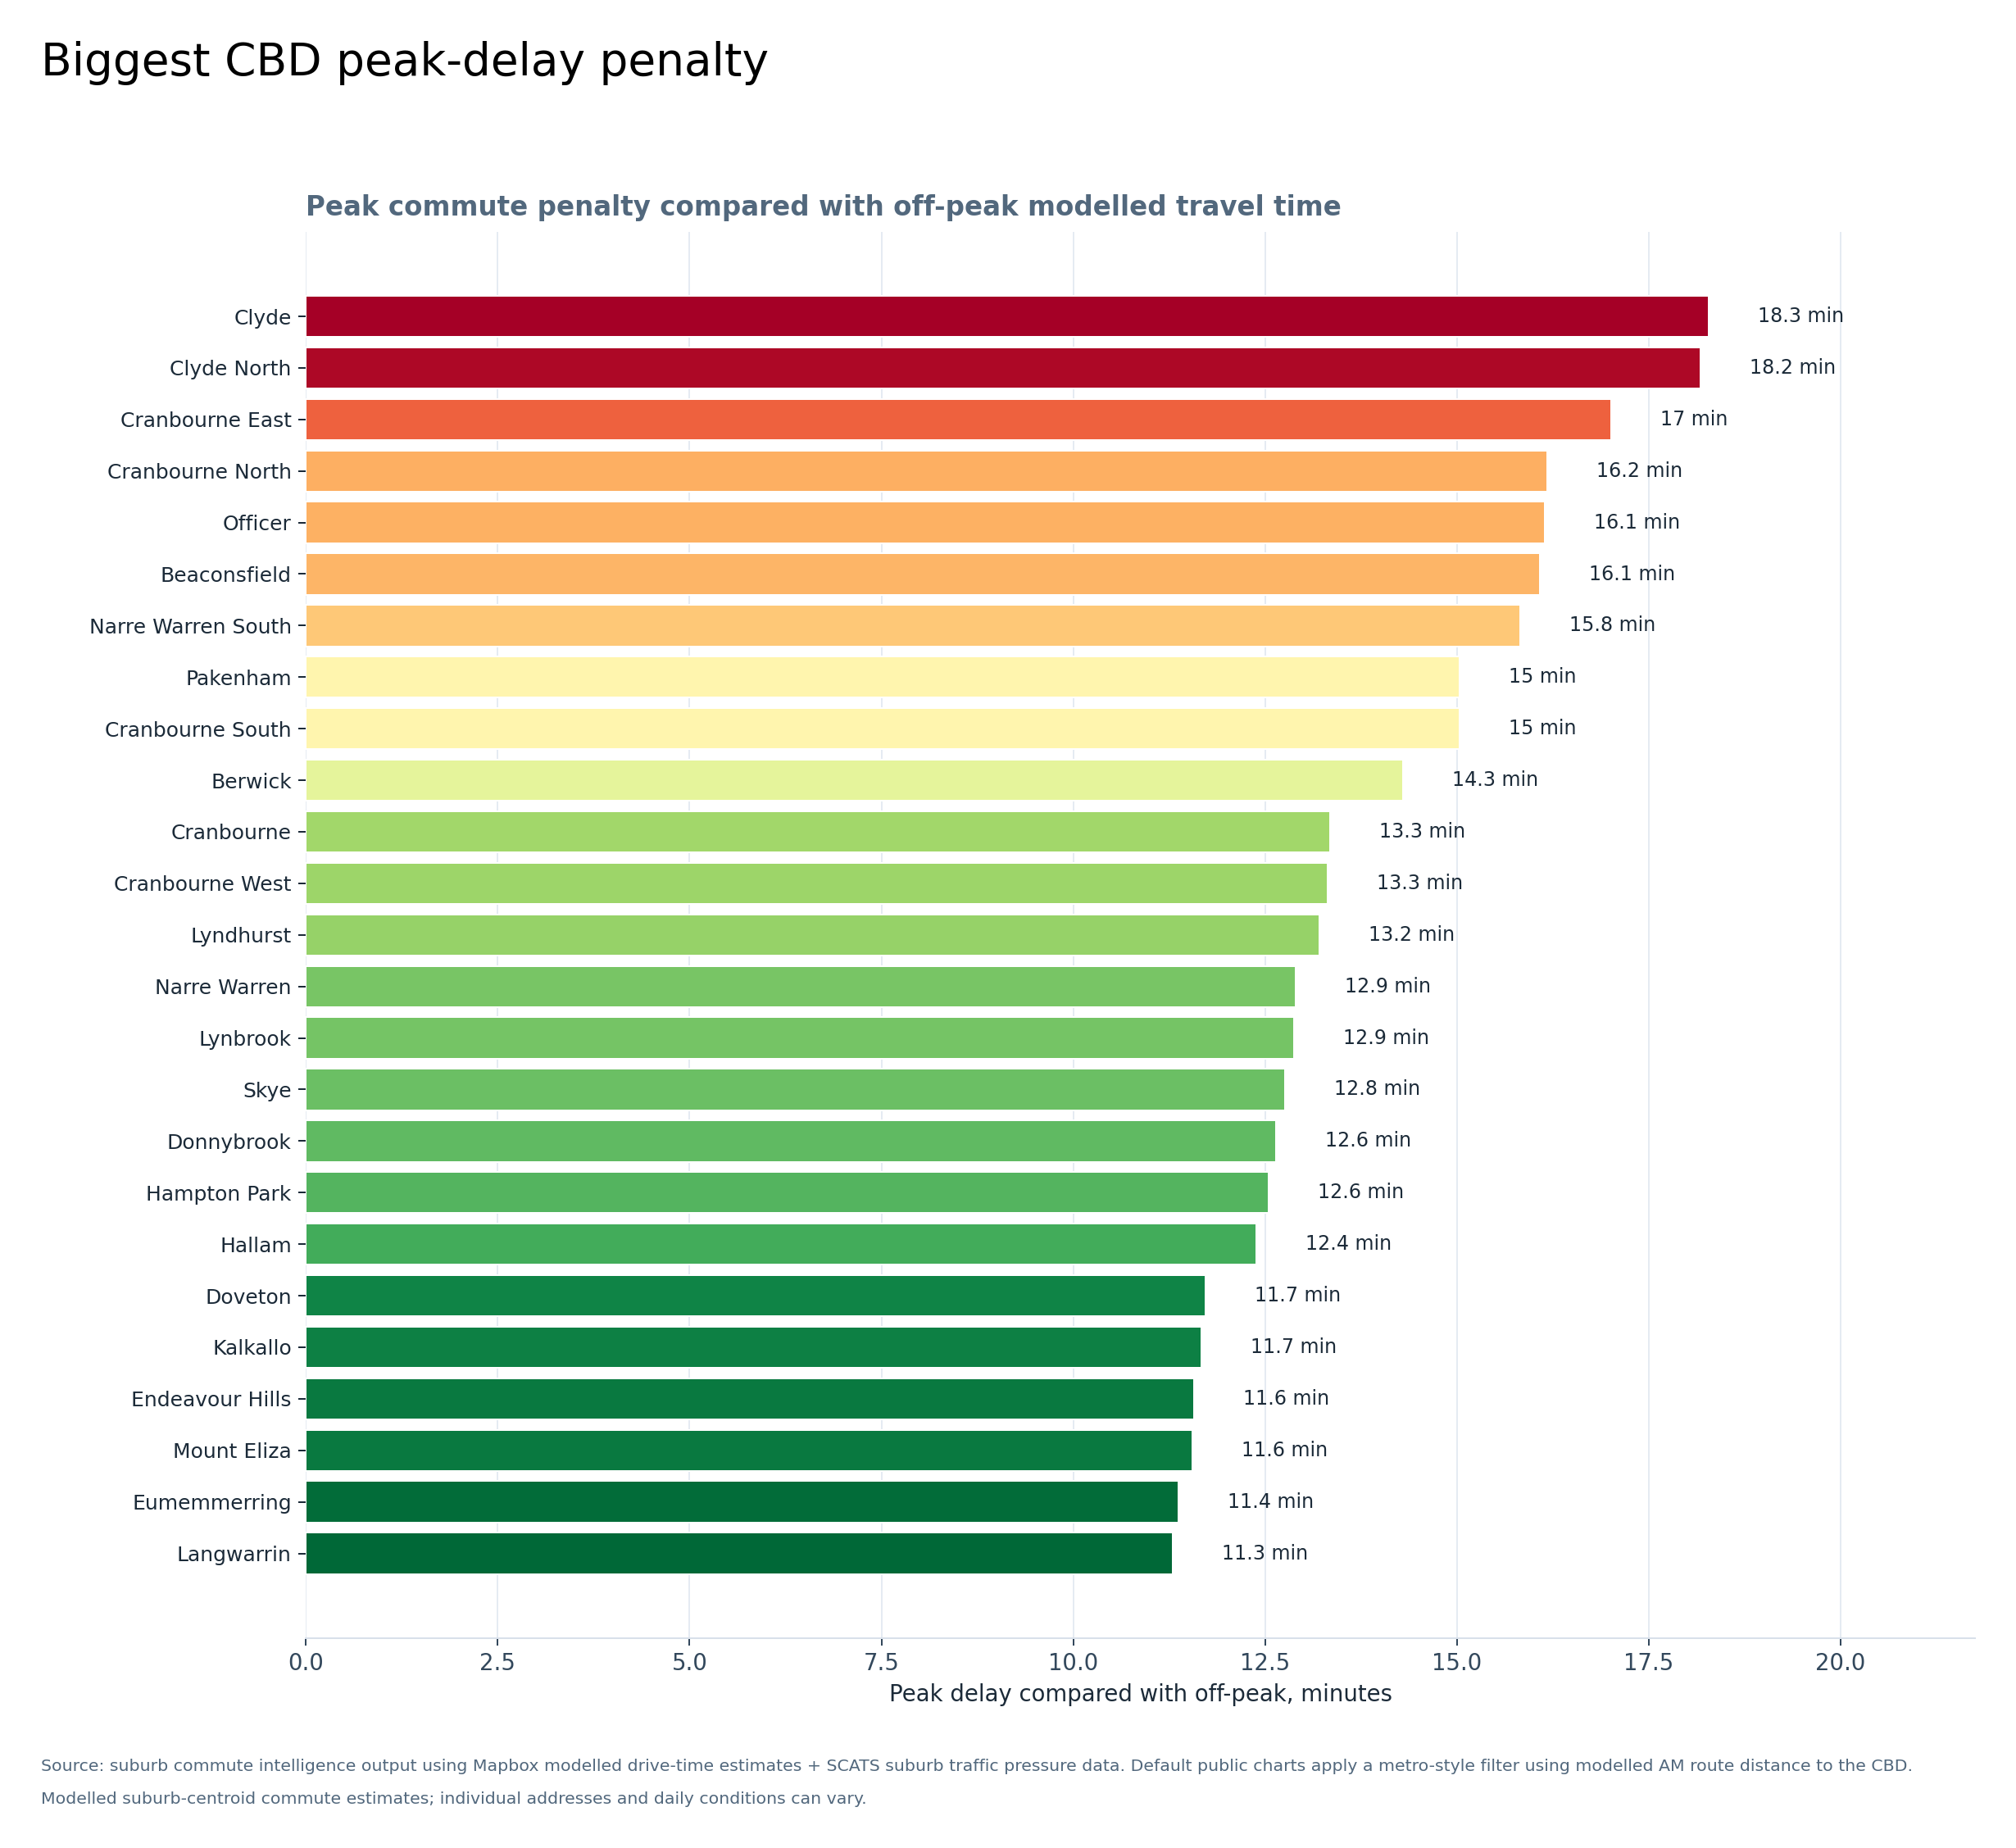
Biggest CBD peak-delay penalty
Highlights suburbs where peak conditions add the most time compared with off-peak.
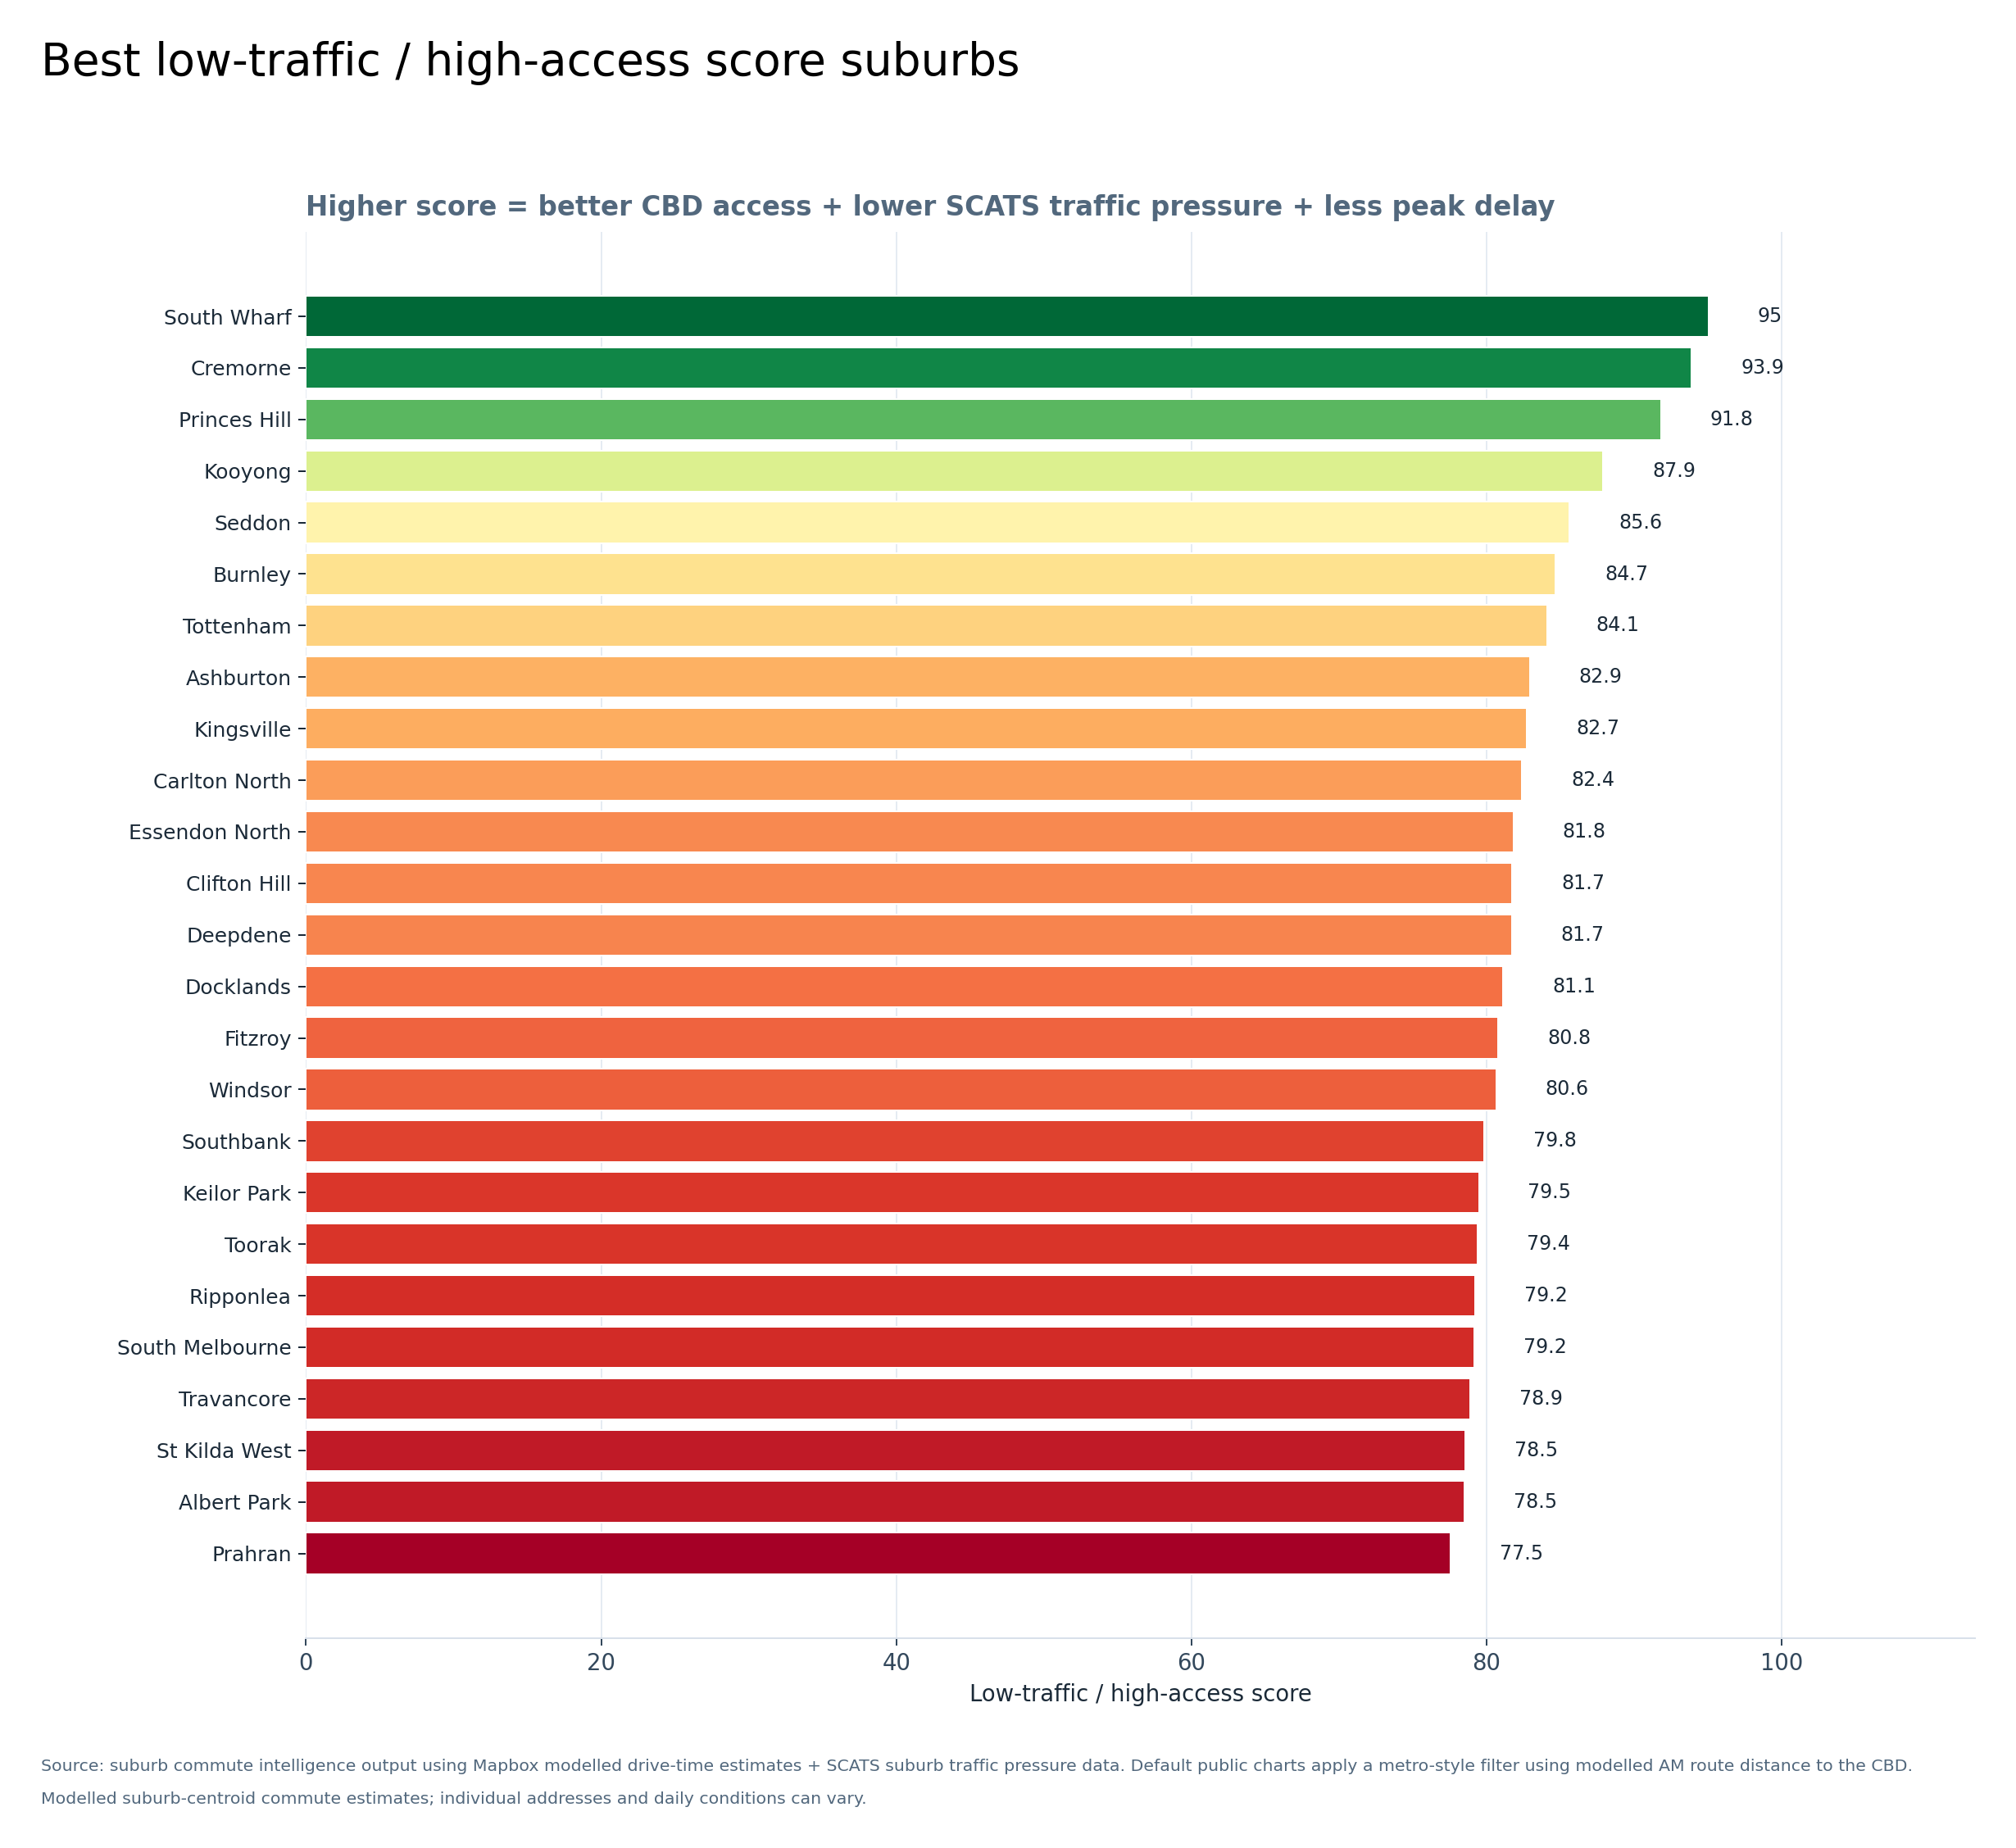
Best low-traffic / high-access score suburbs
Ranks suburbs by the combined low-traffic/high-access score.
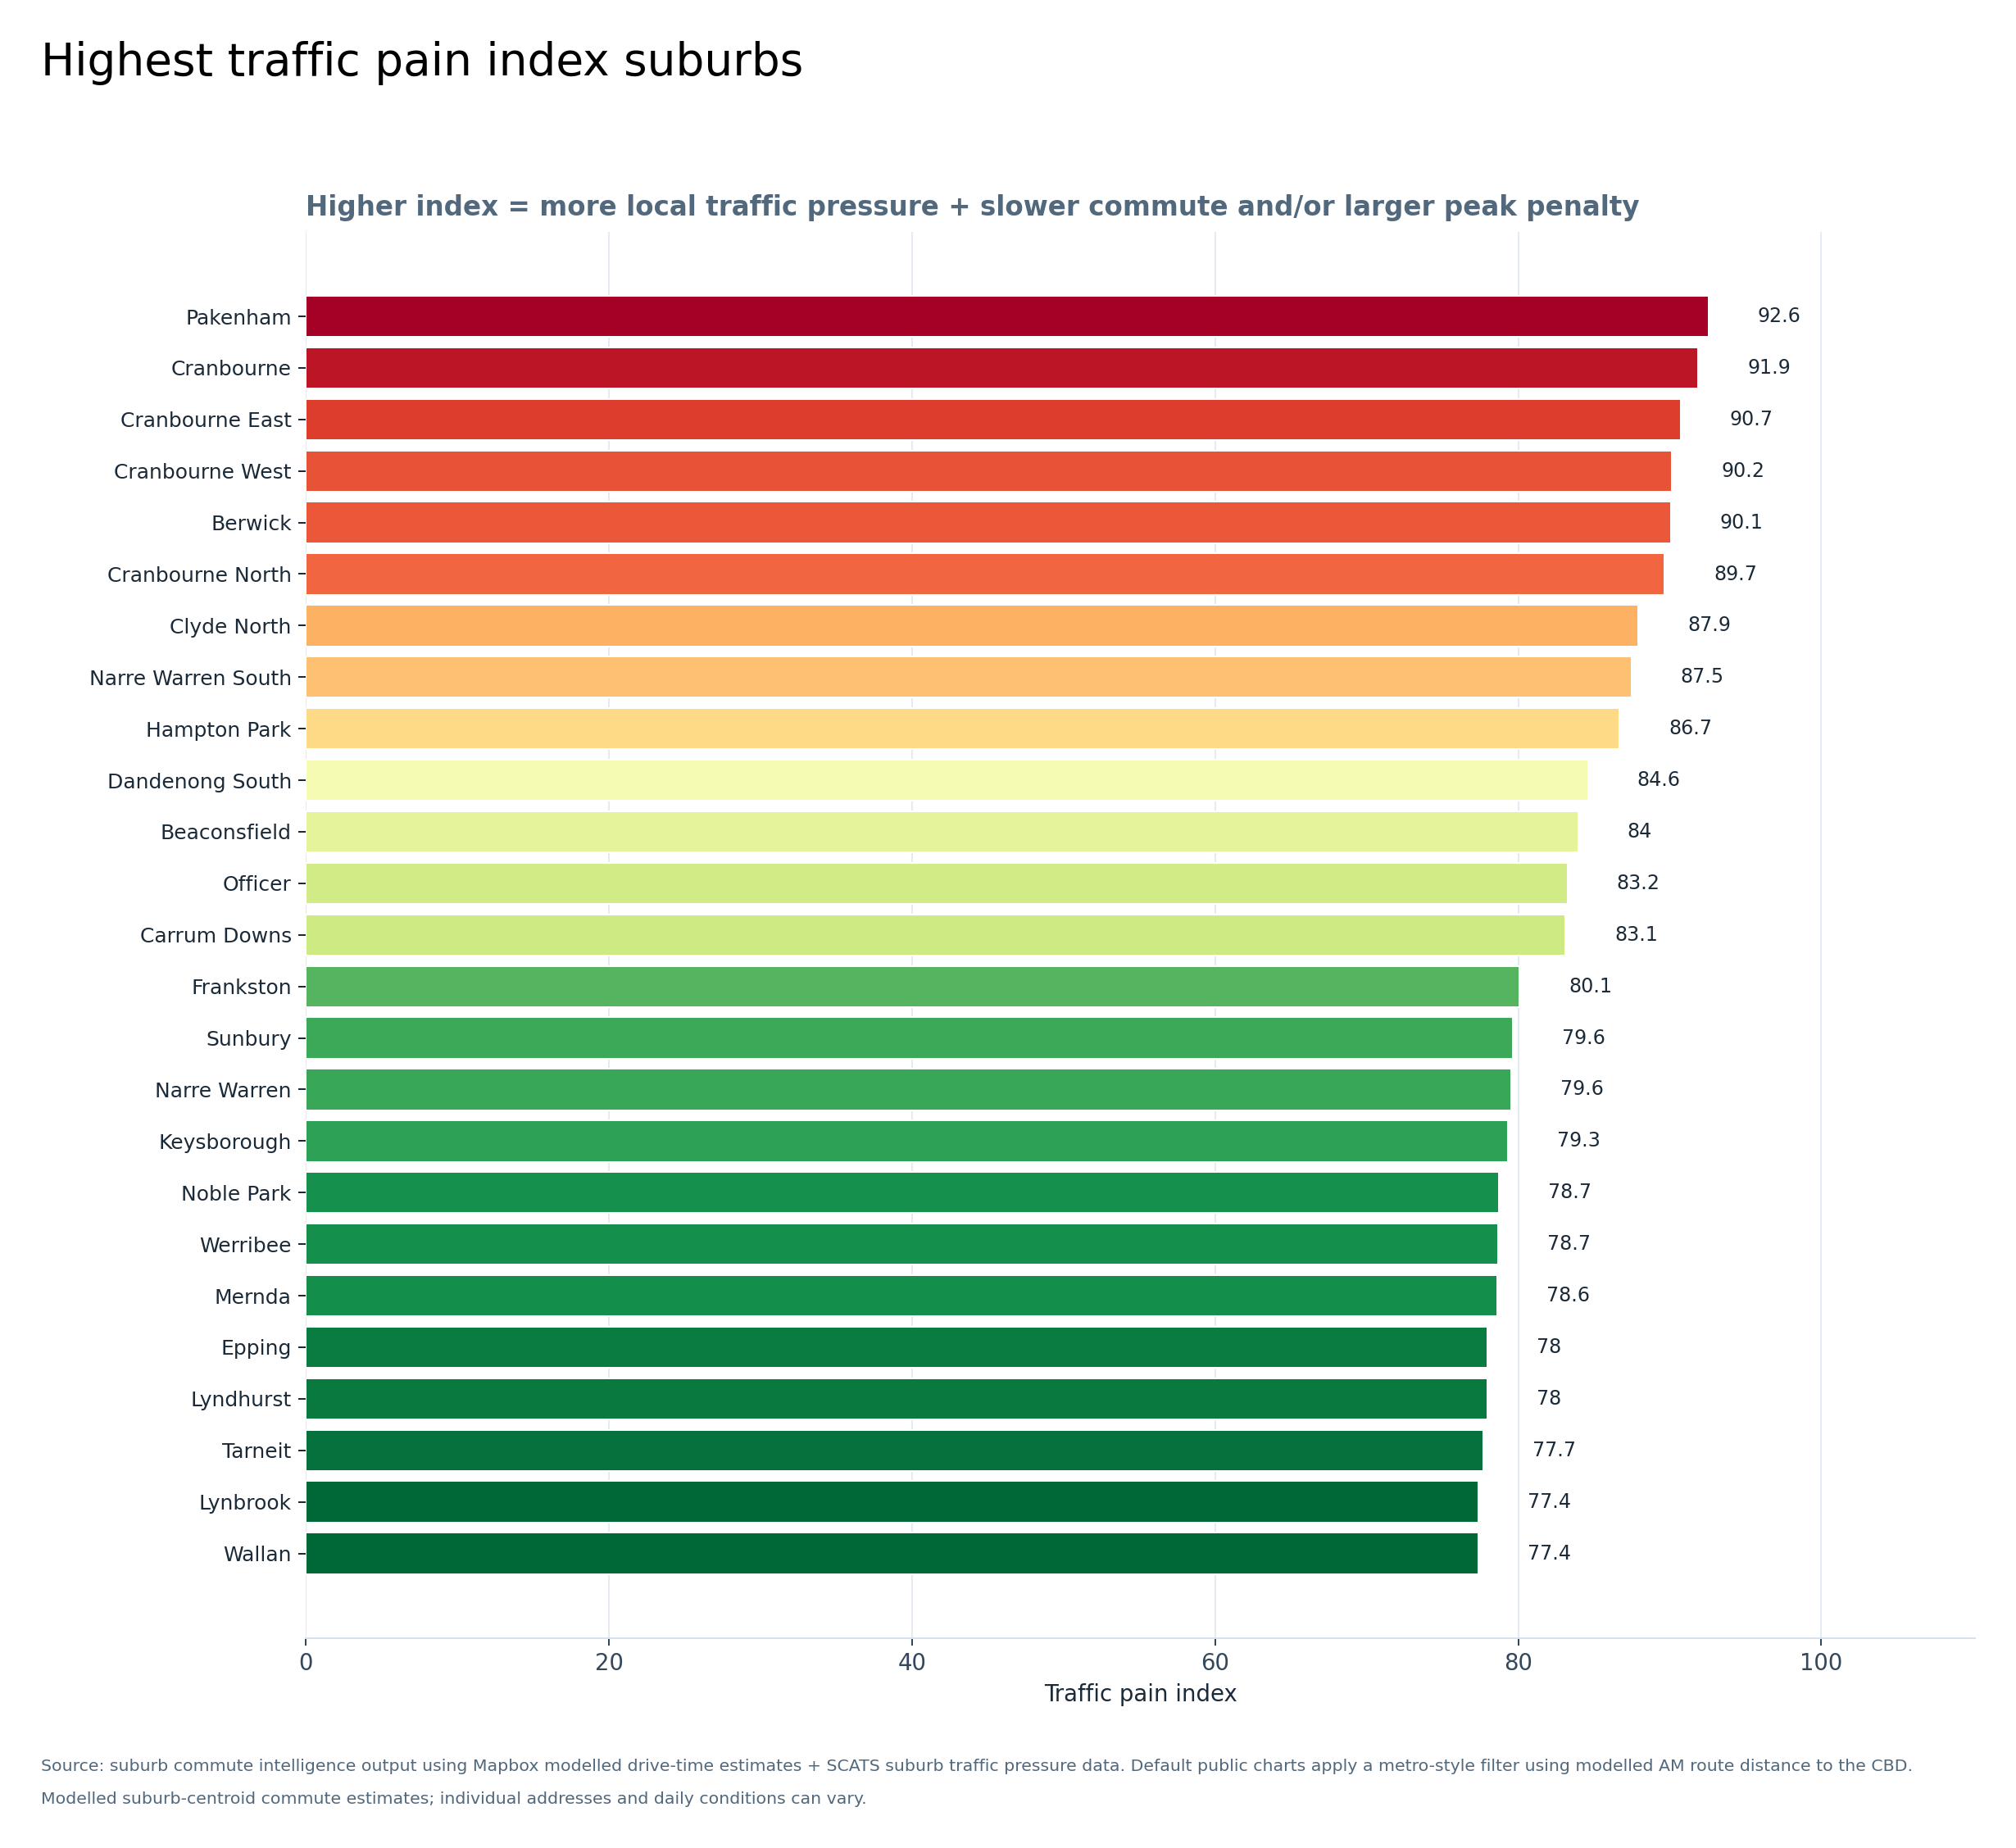
Highest traffic pain index suburbs
Ranks suburbs by the combined traffic pain index.
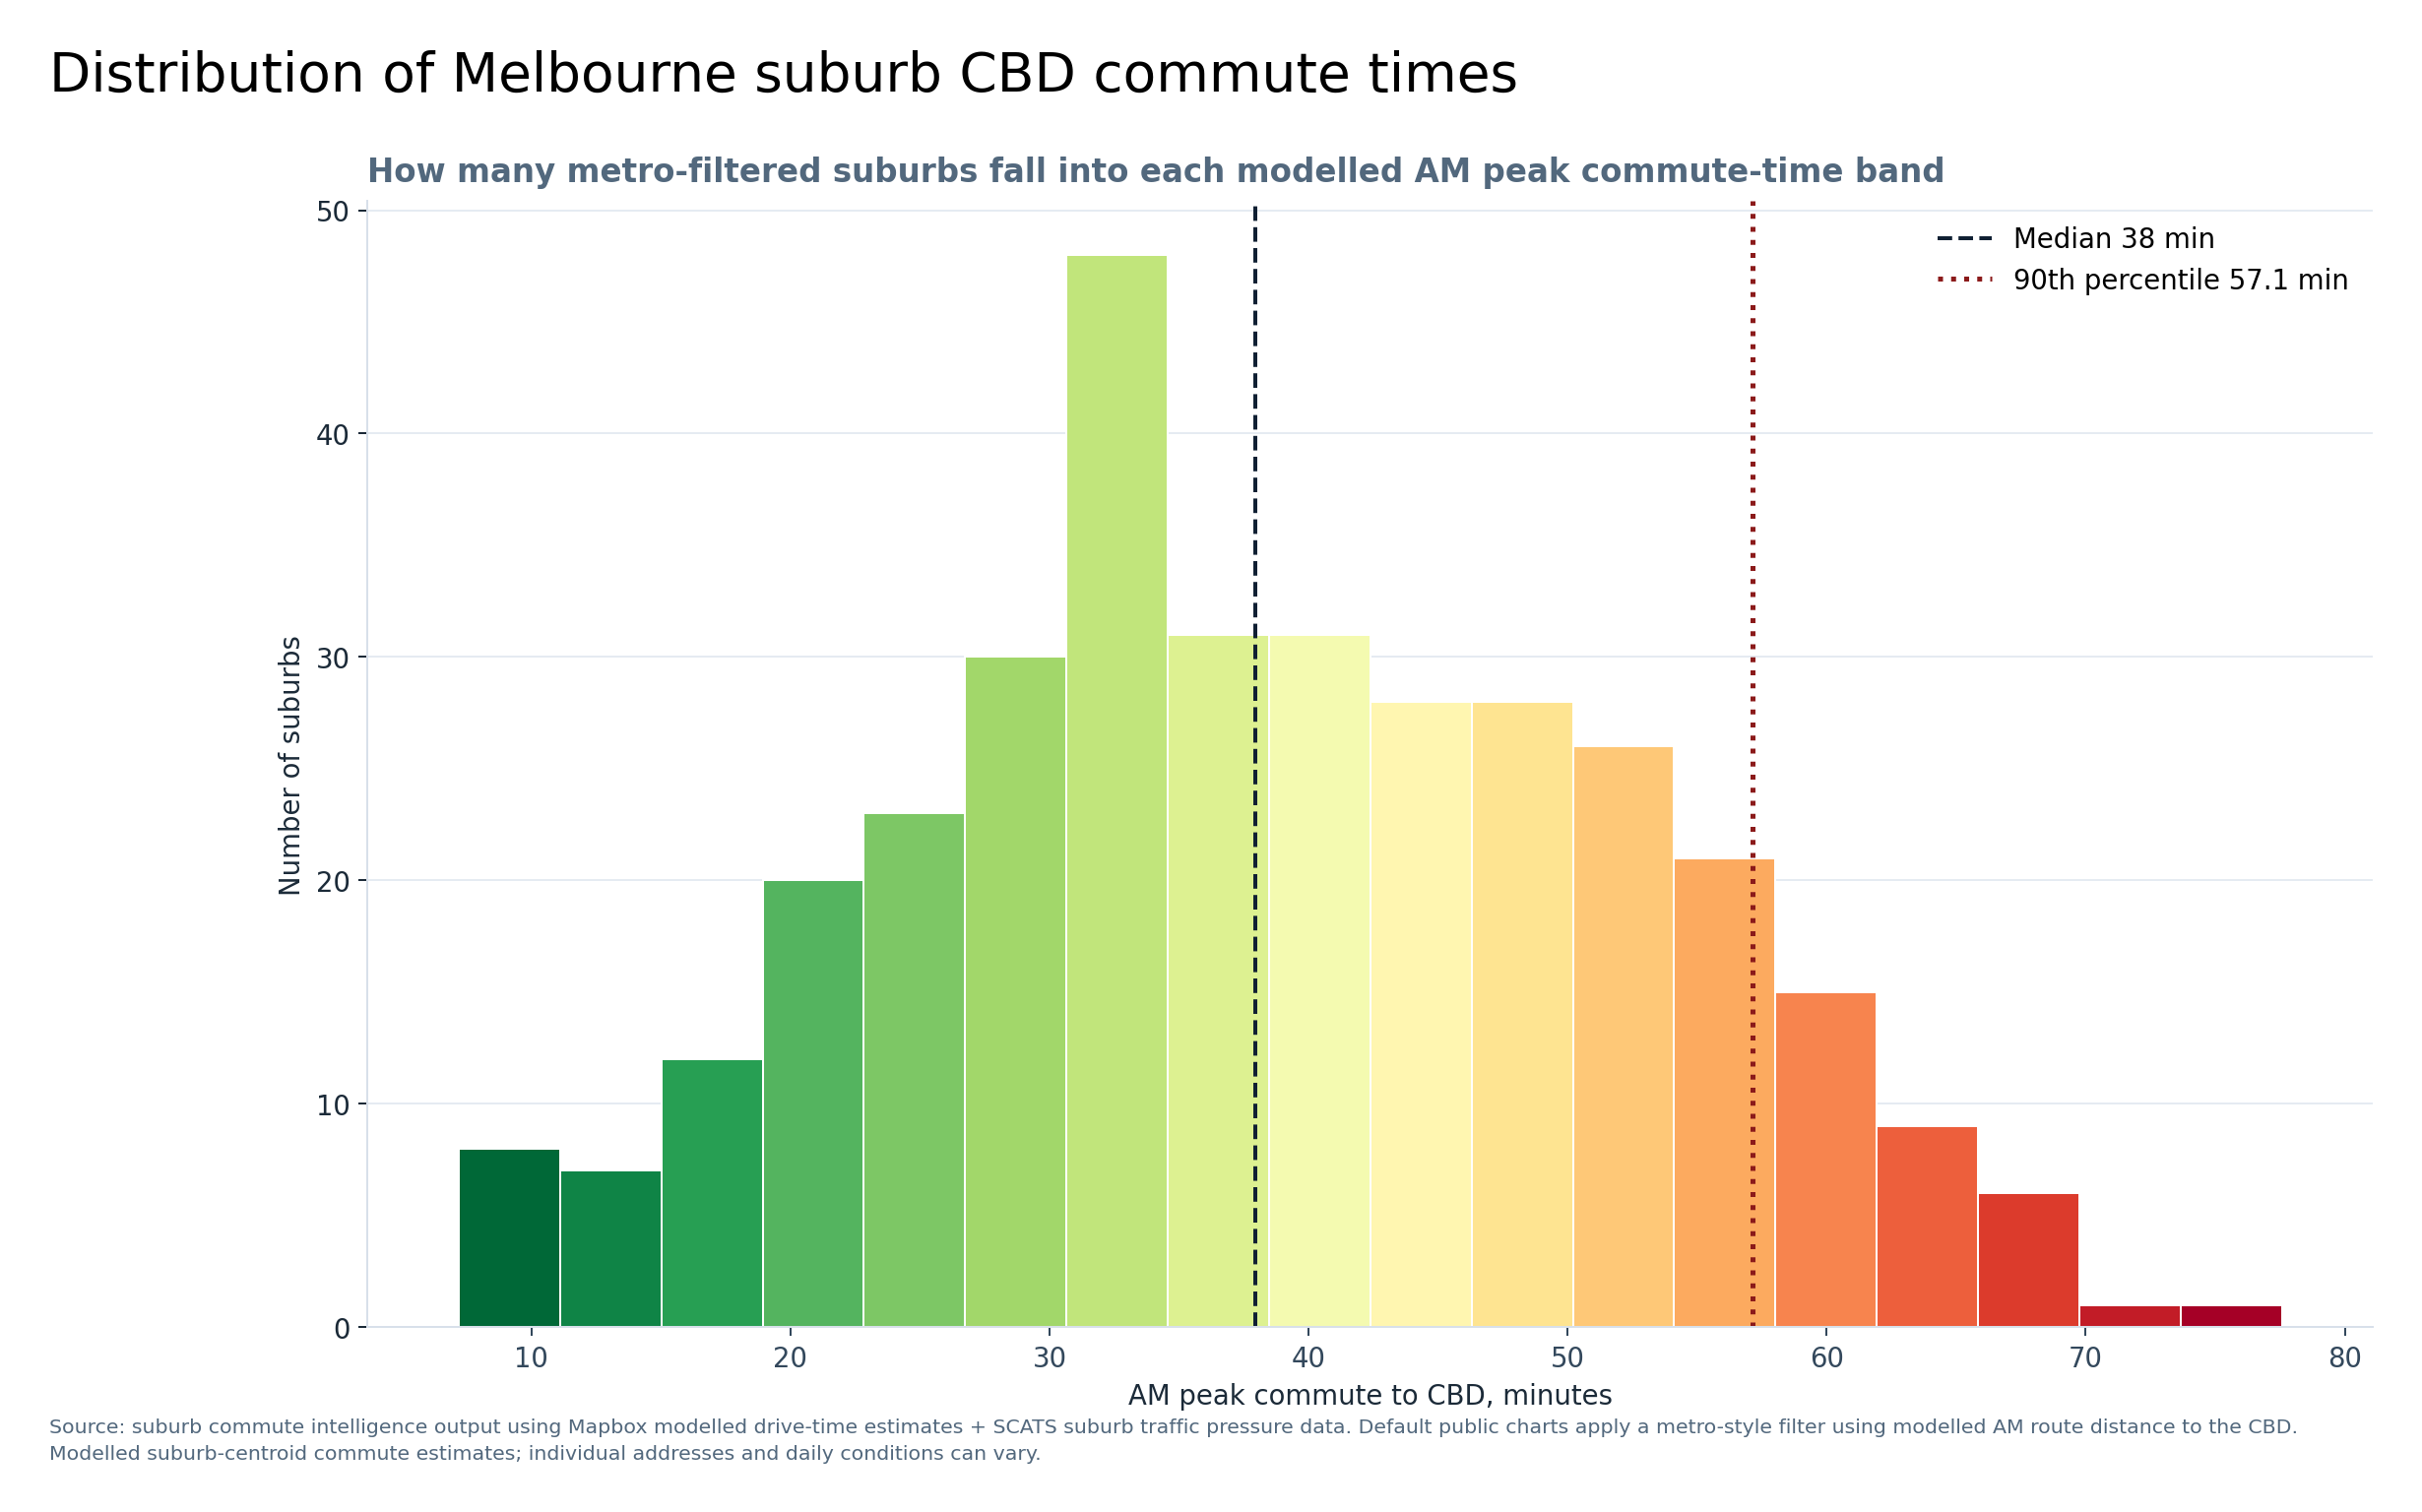
Distribution of Melbourne suburb CBD commute times
Shows the spread of modelled AM peak commute times across metro-filtered suburbs.
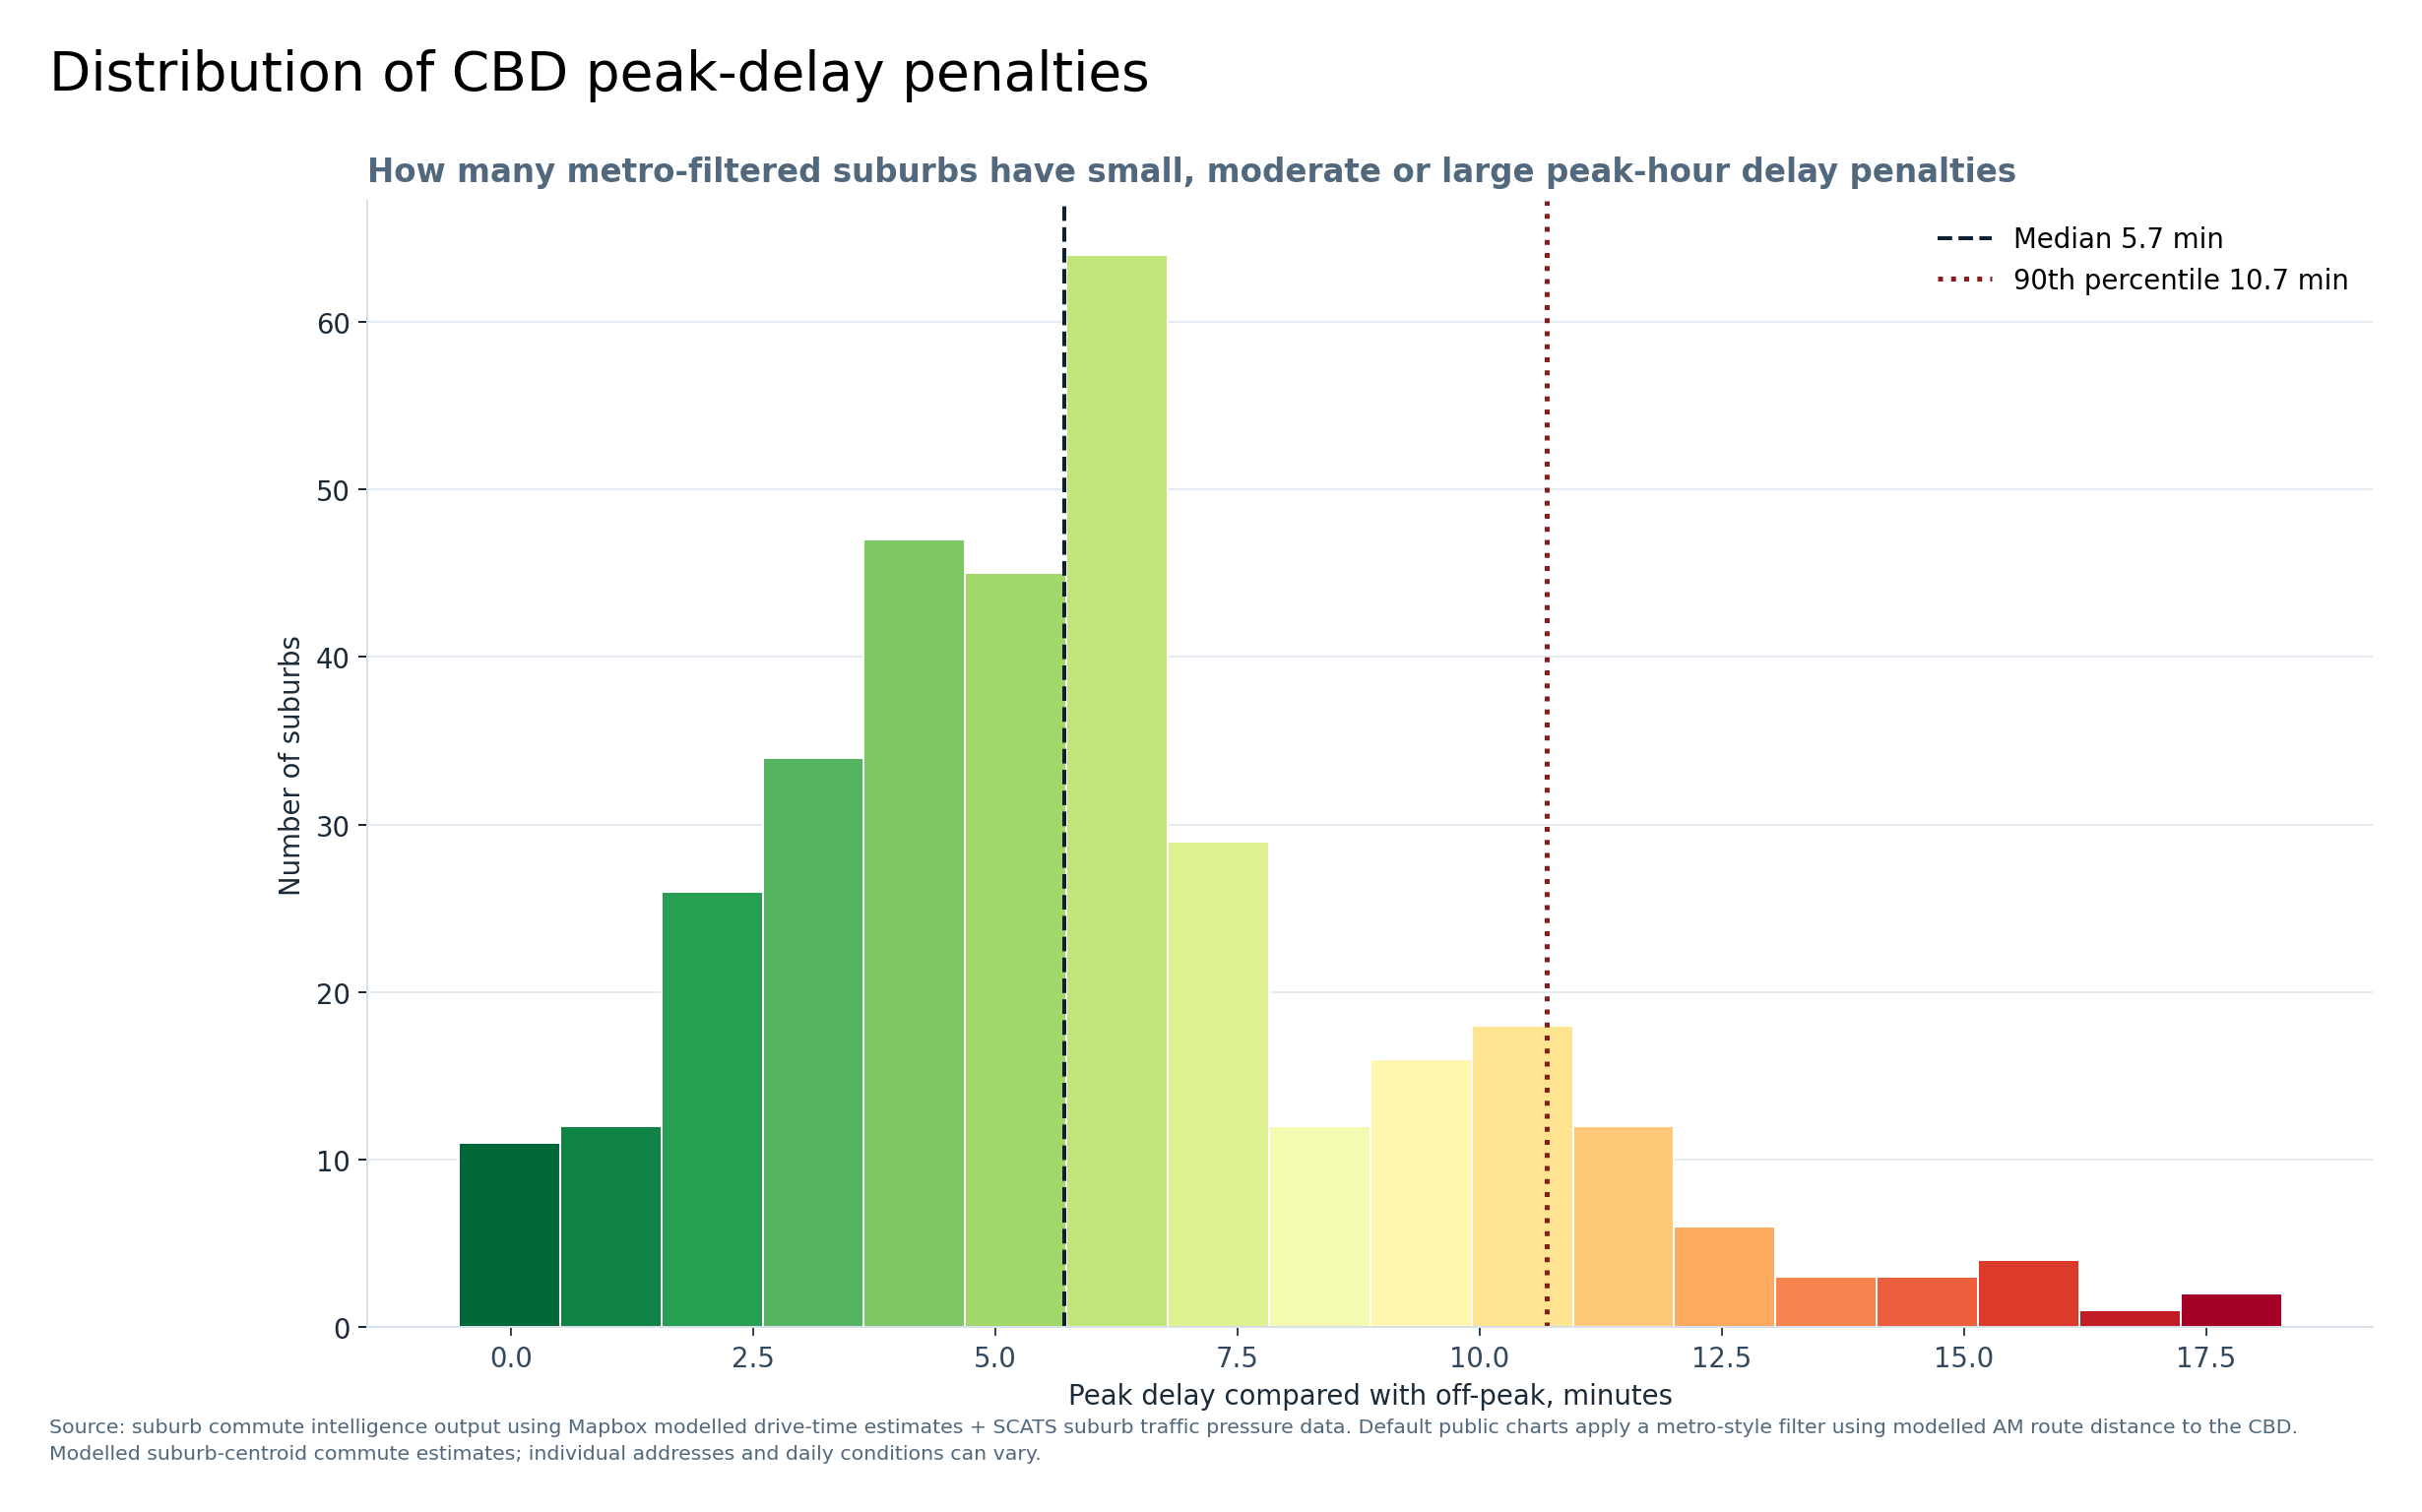
Distribution of CBD peak-delay penalties
Shows the spread of peak delay penalties across metro-filtered suburbs.
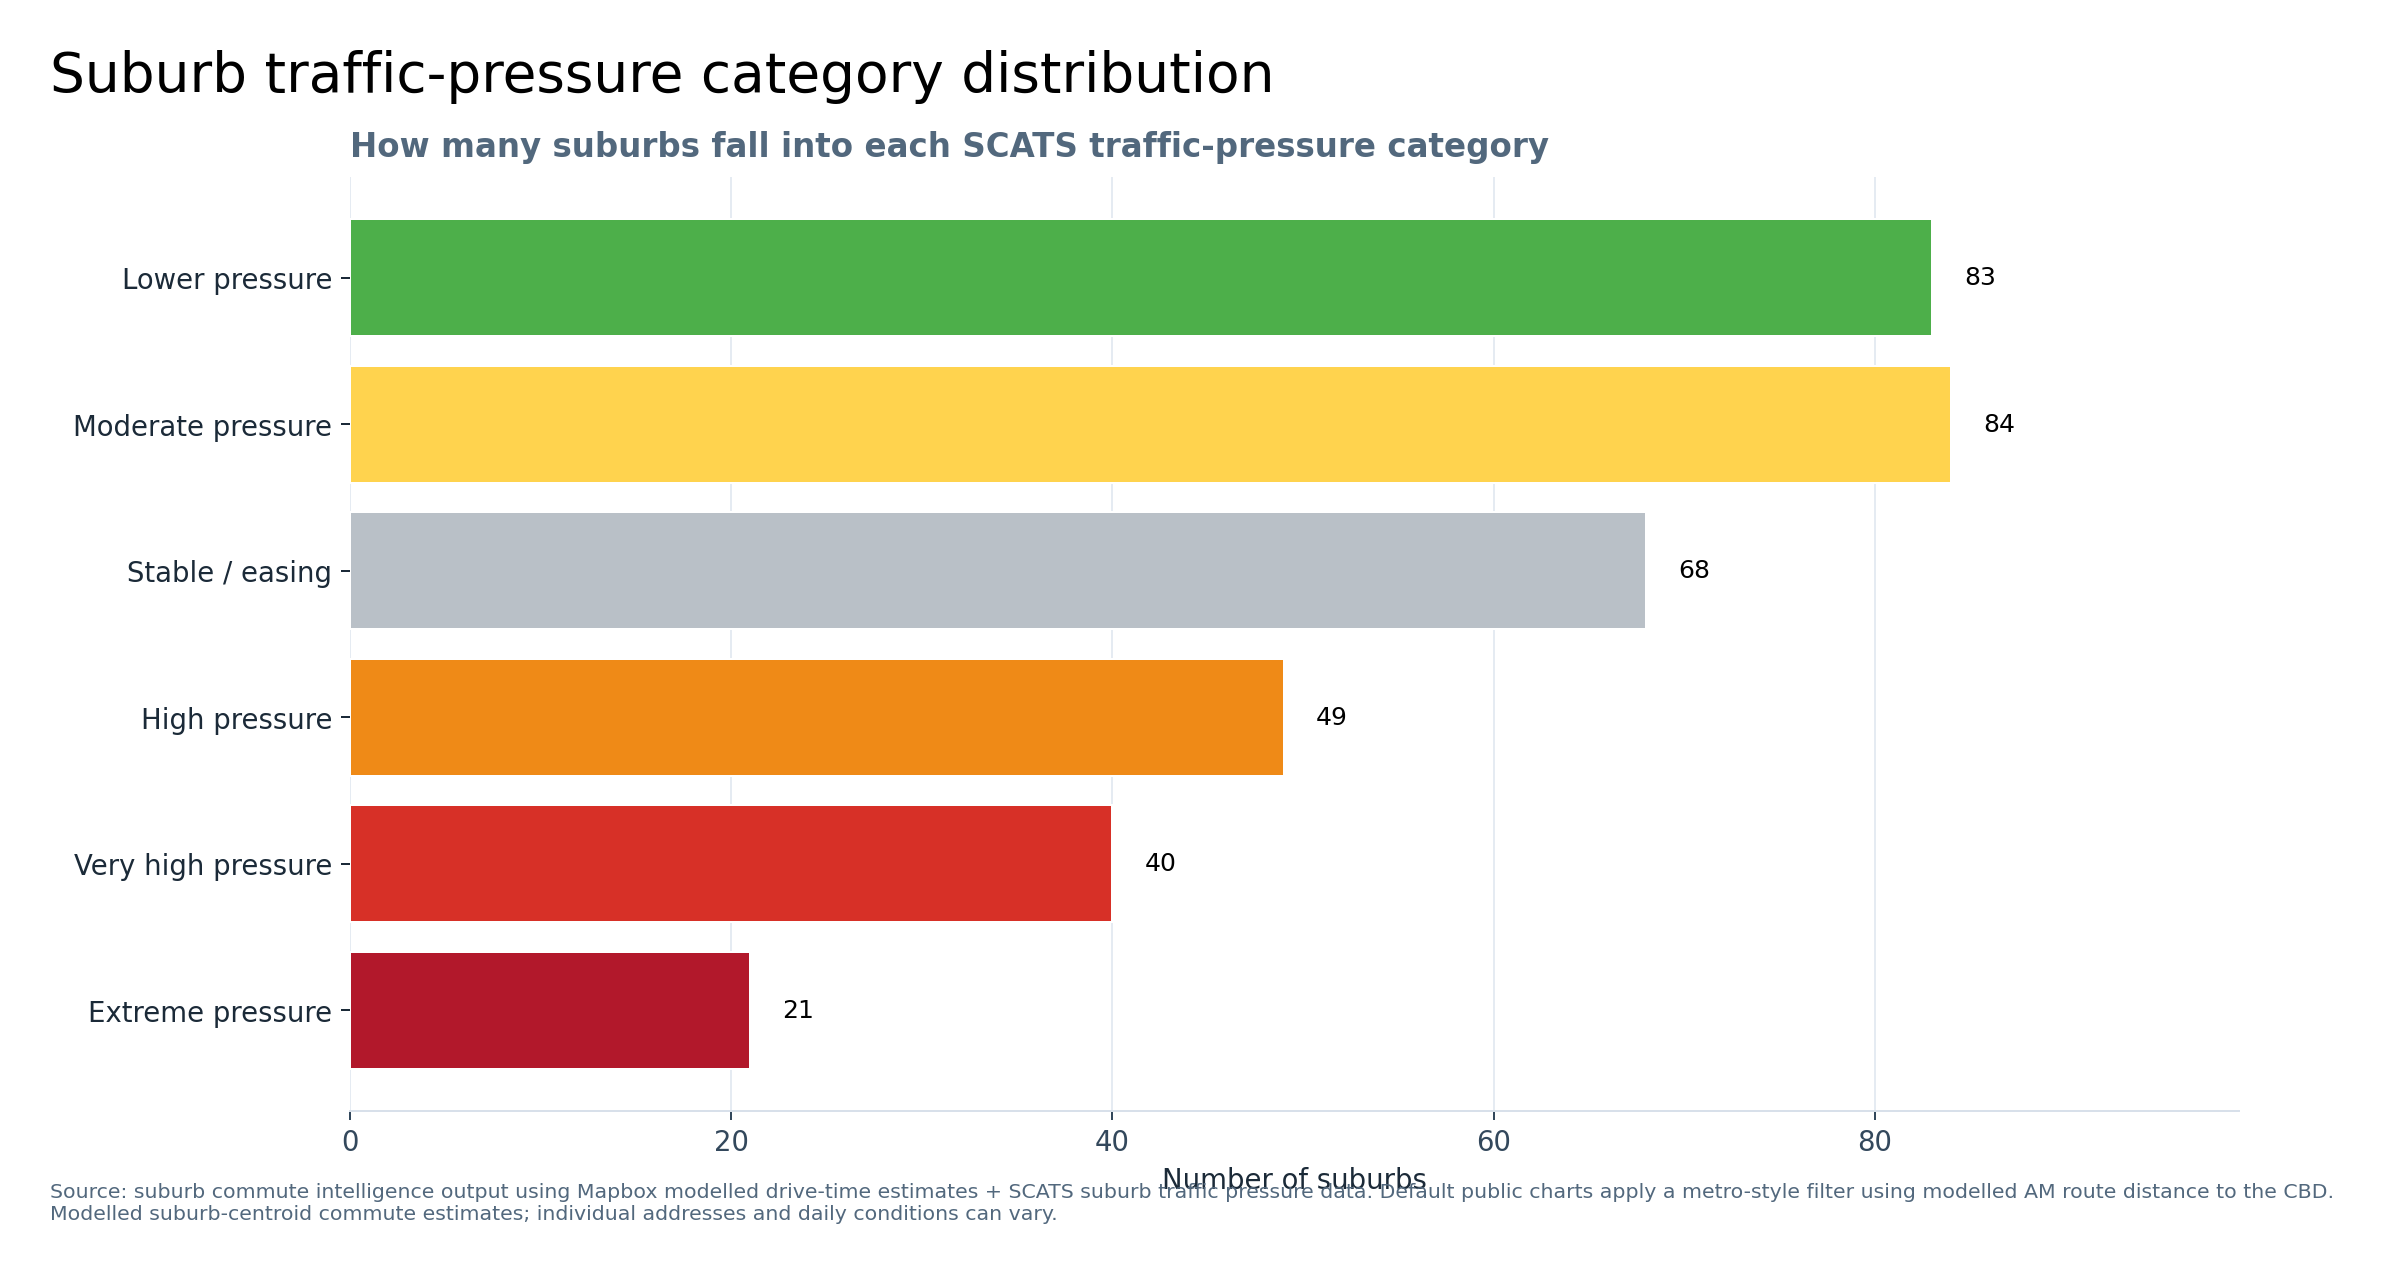
Suburb traffic-pressure category distribution
Counts metro-filtered suburbs by the traffic-pressure category already attached to the suburb traffic map.
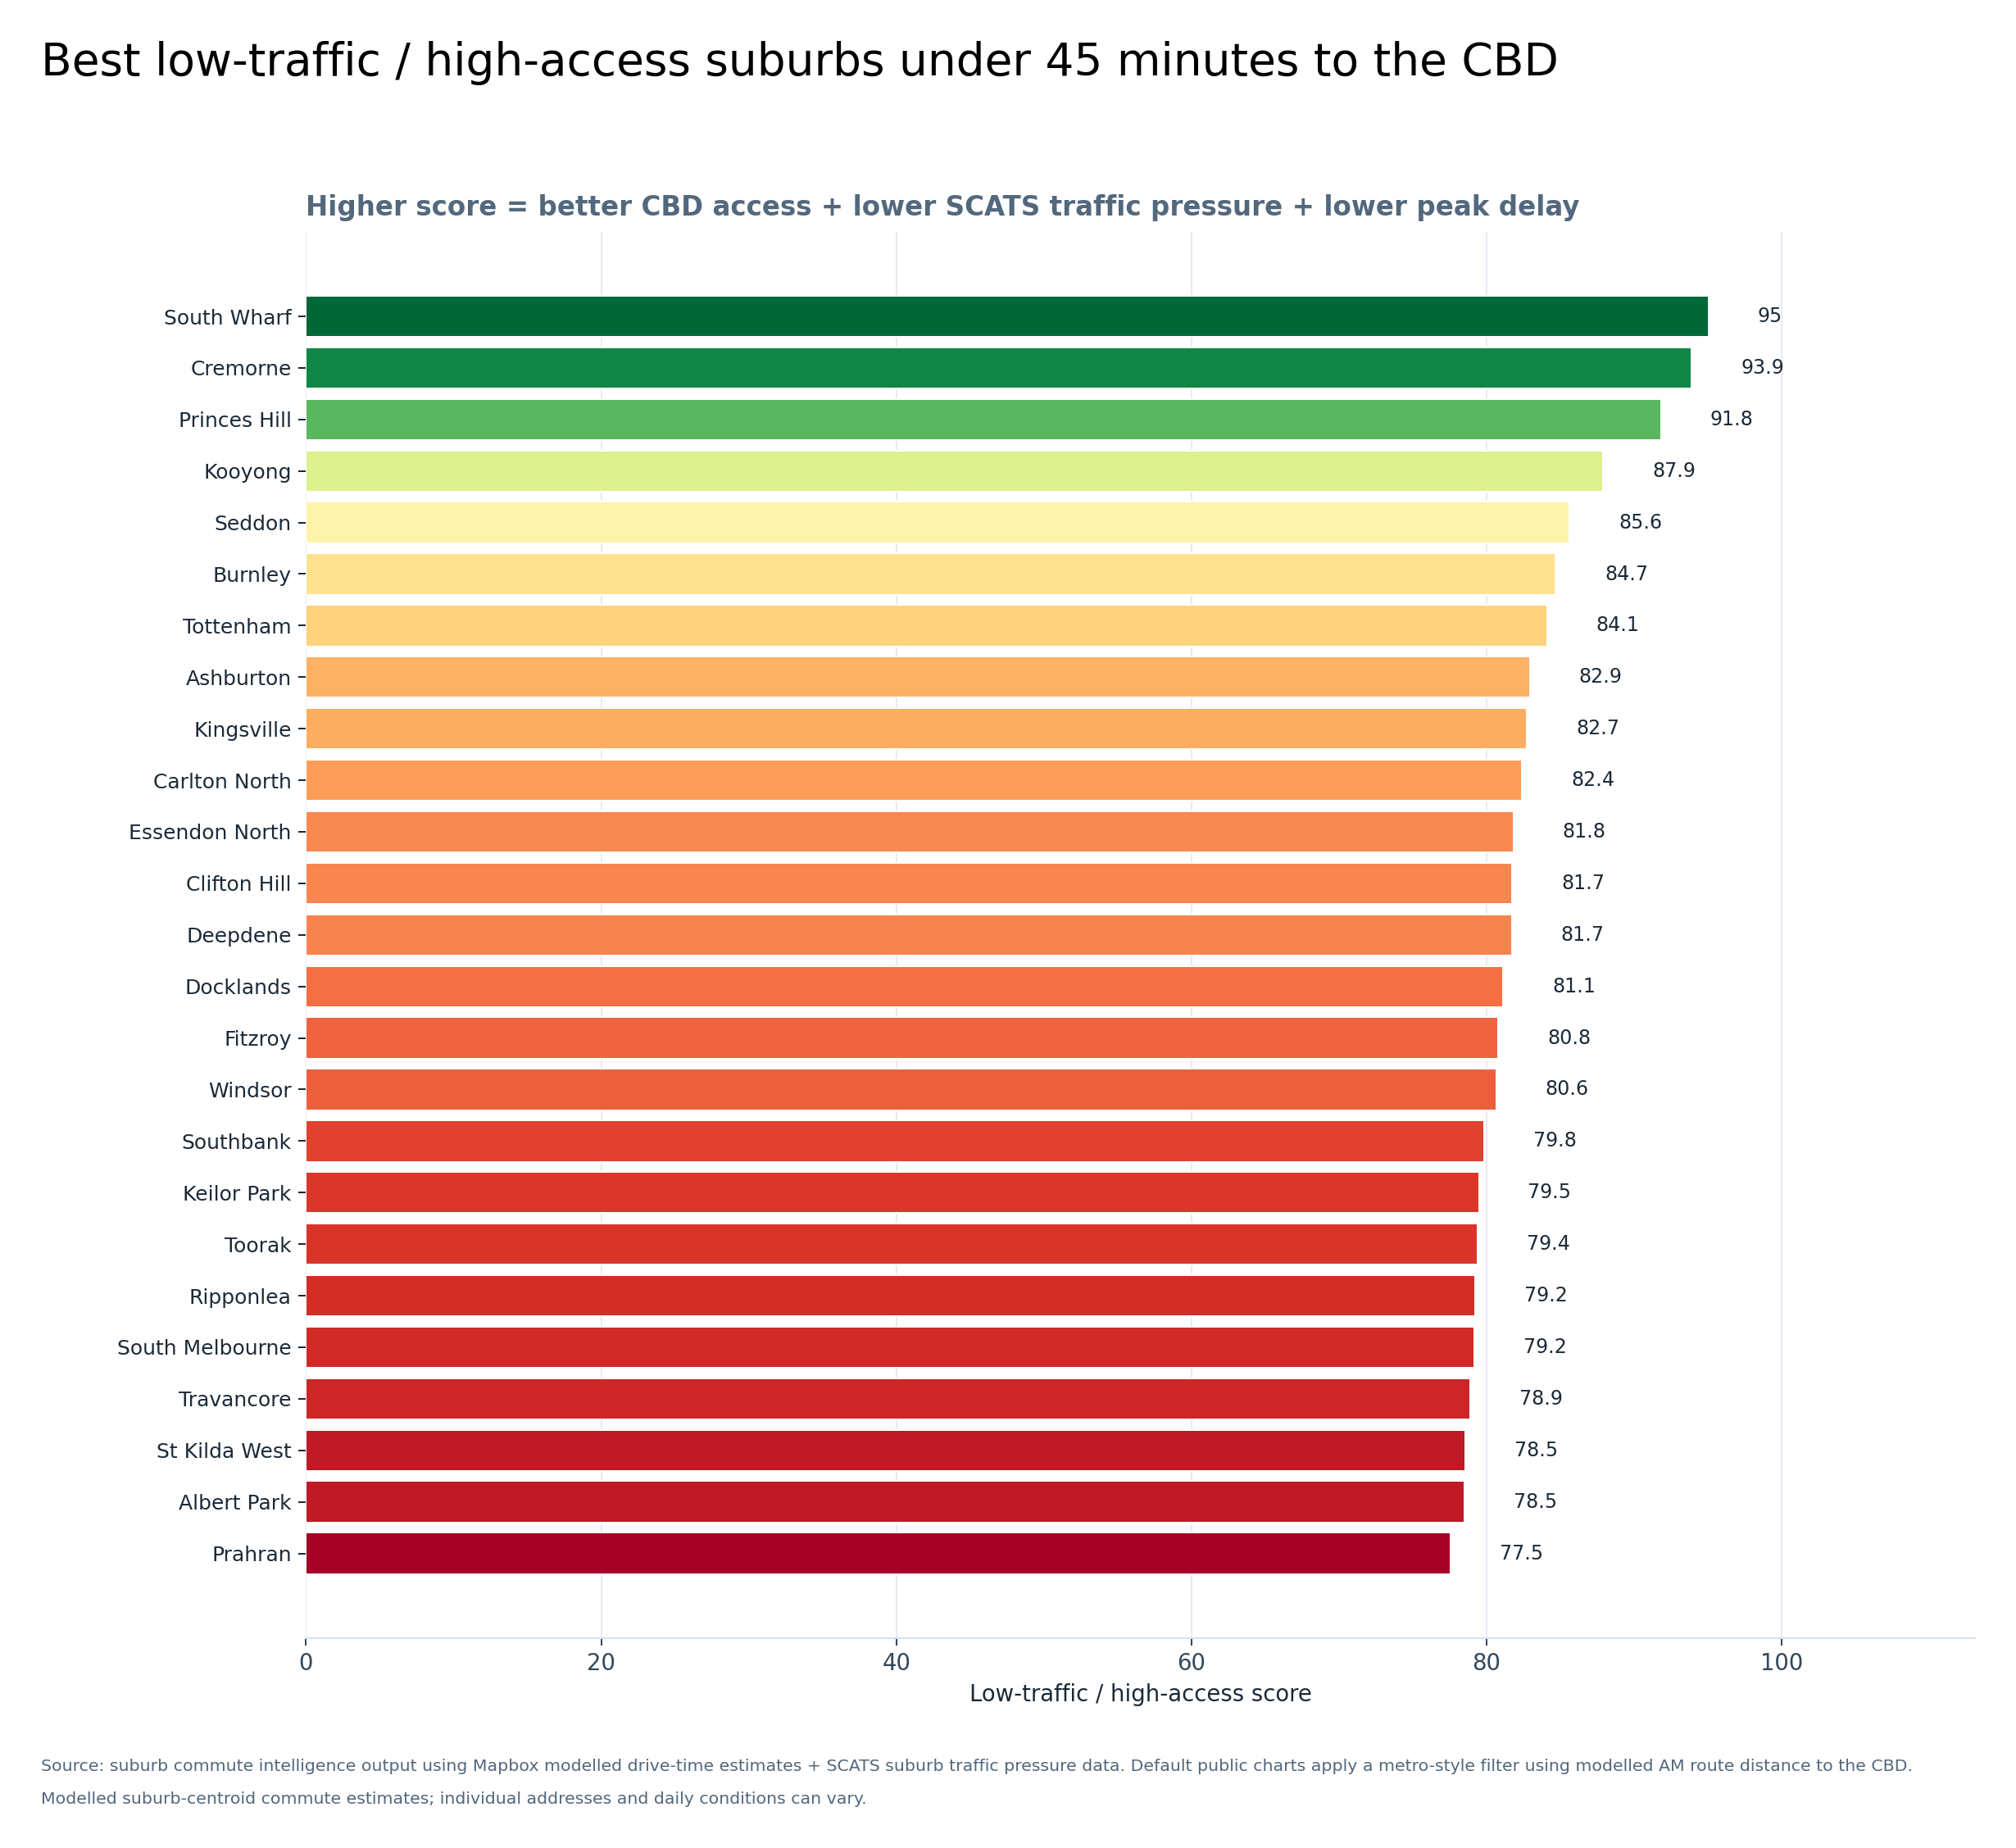
Best low-traffic / high-access suburbs under 45 minutes to the CBD
Ranks metro-filtered suburbs with modelled AM CBD commute at or below 45 minutes by low-traffic/high-access score.
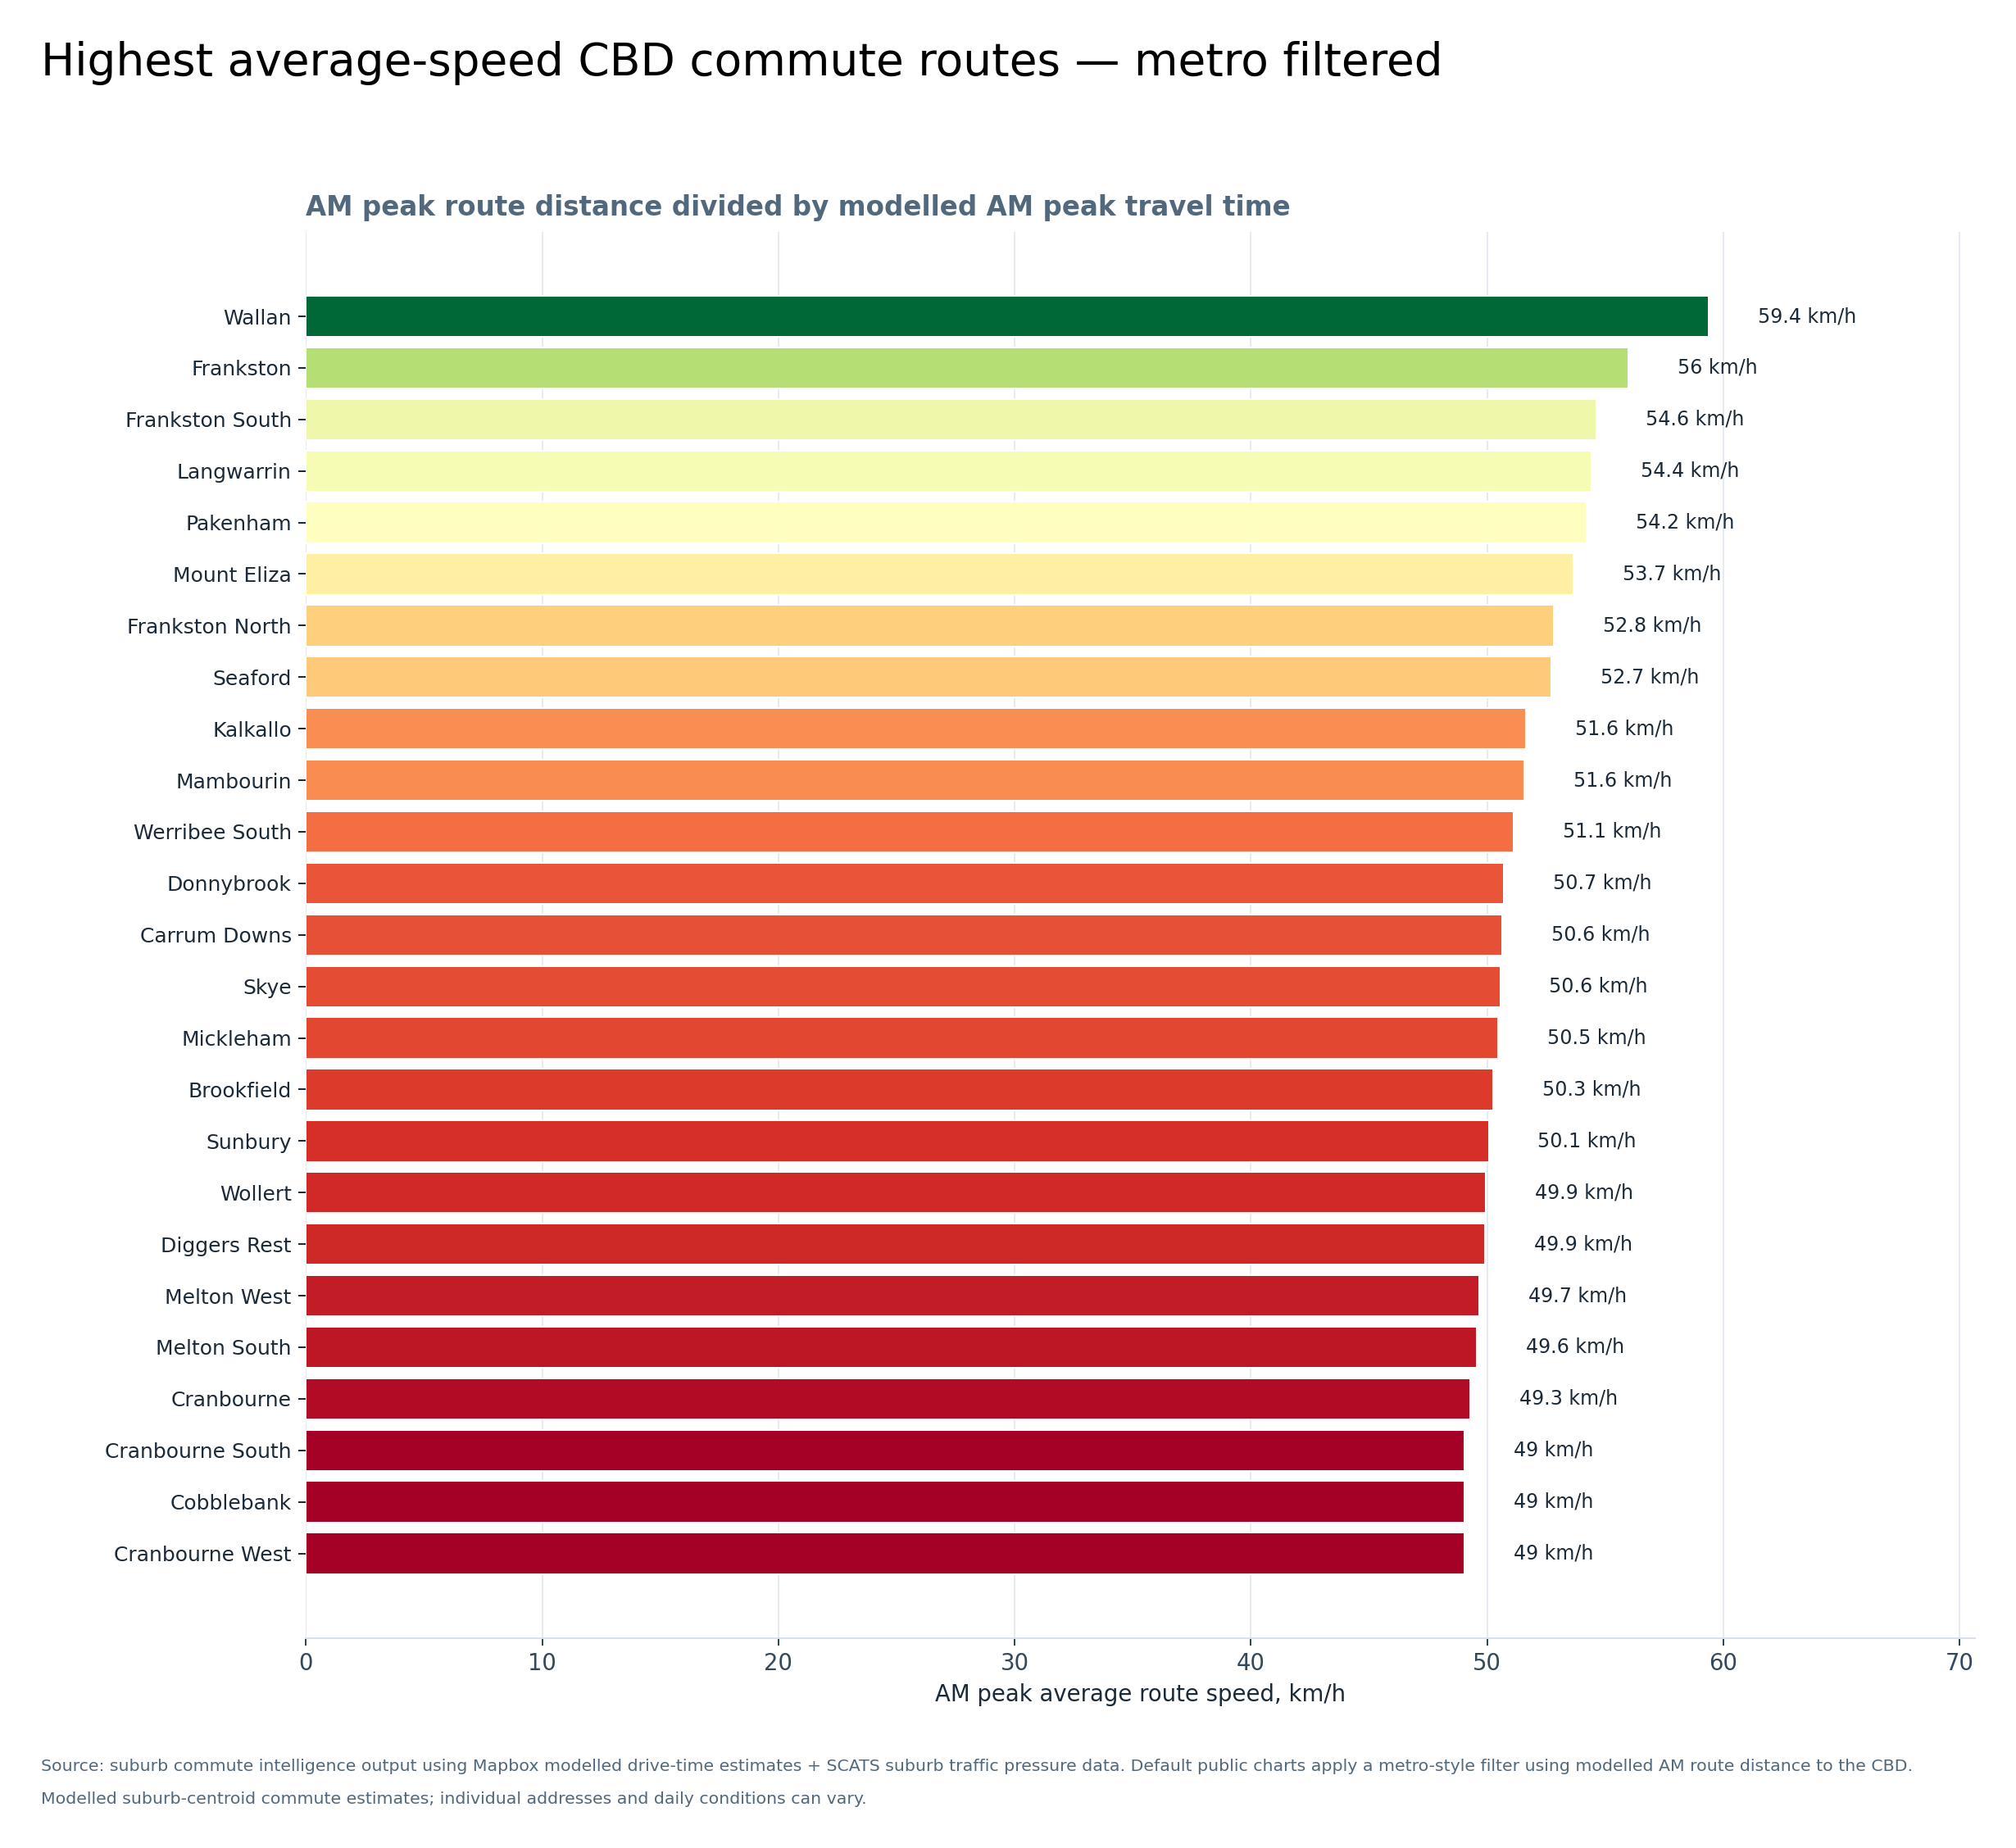
Highest average-speed CBD commute routes — metro filtered
Shows metro-filtered suburb-to-CBD routes with the highest modelled average speed during AM peak.
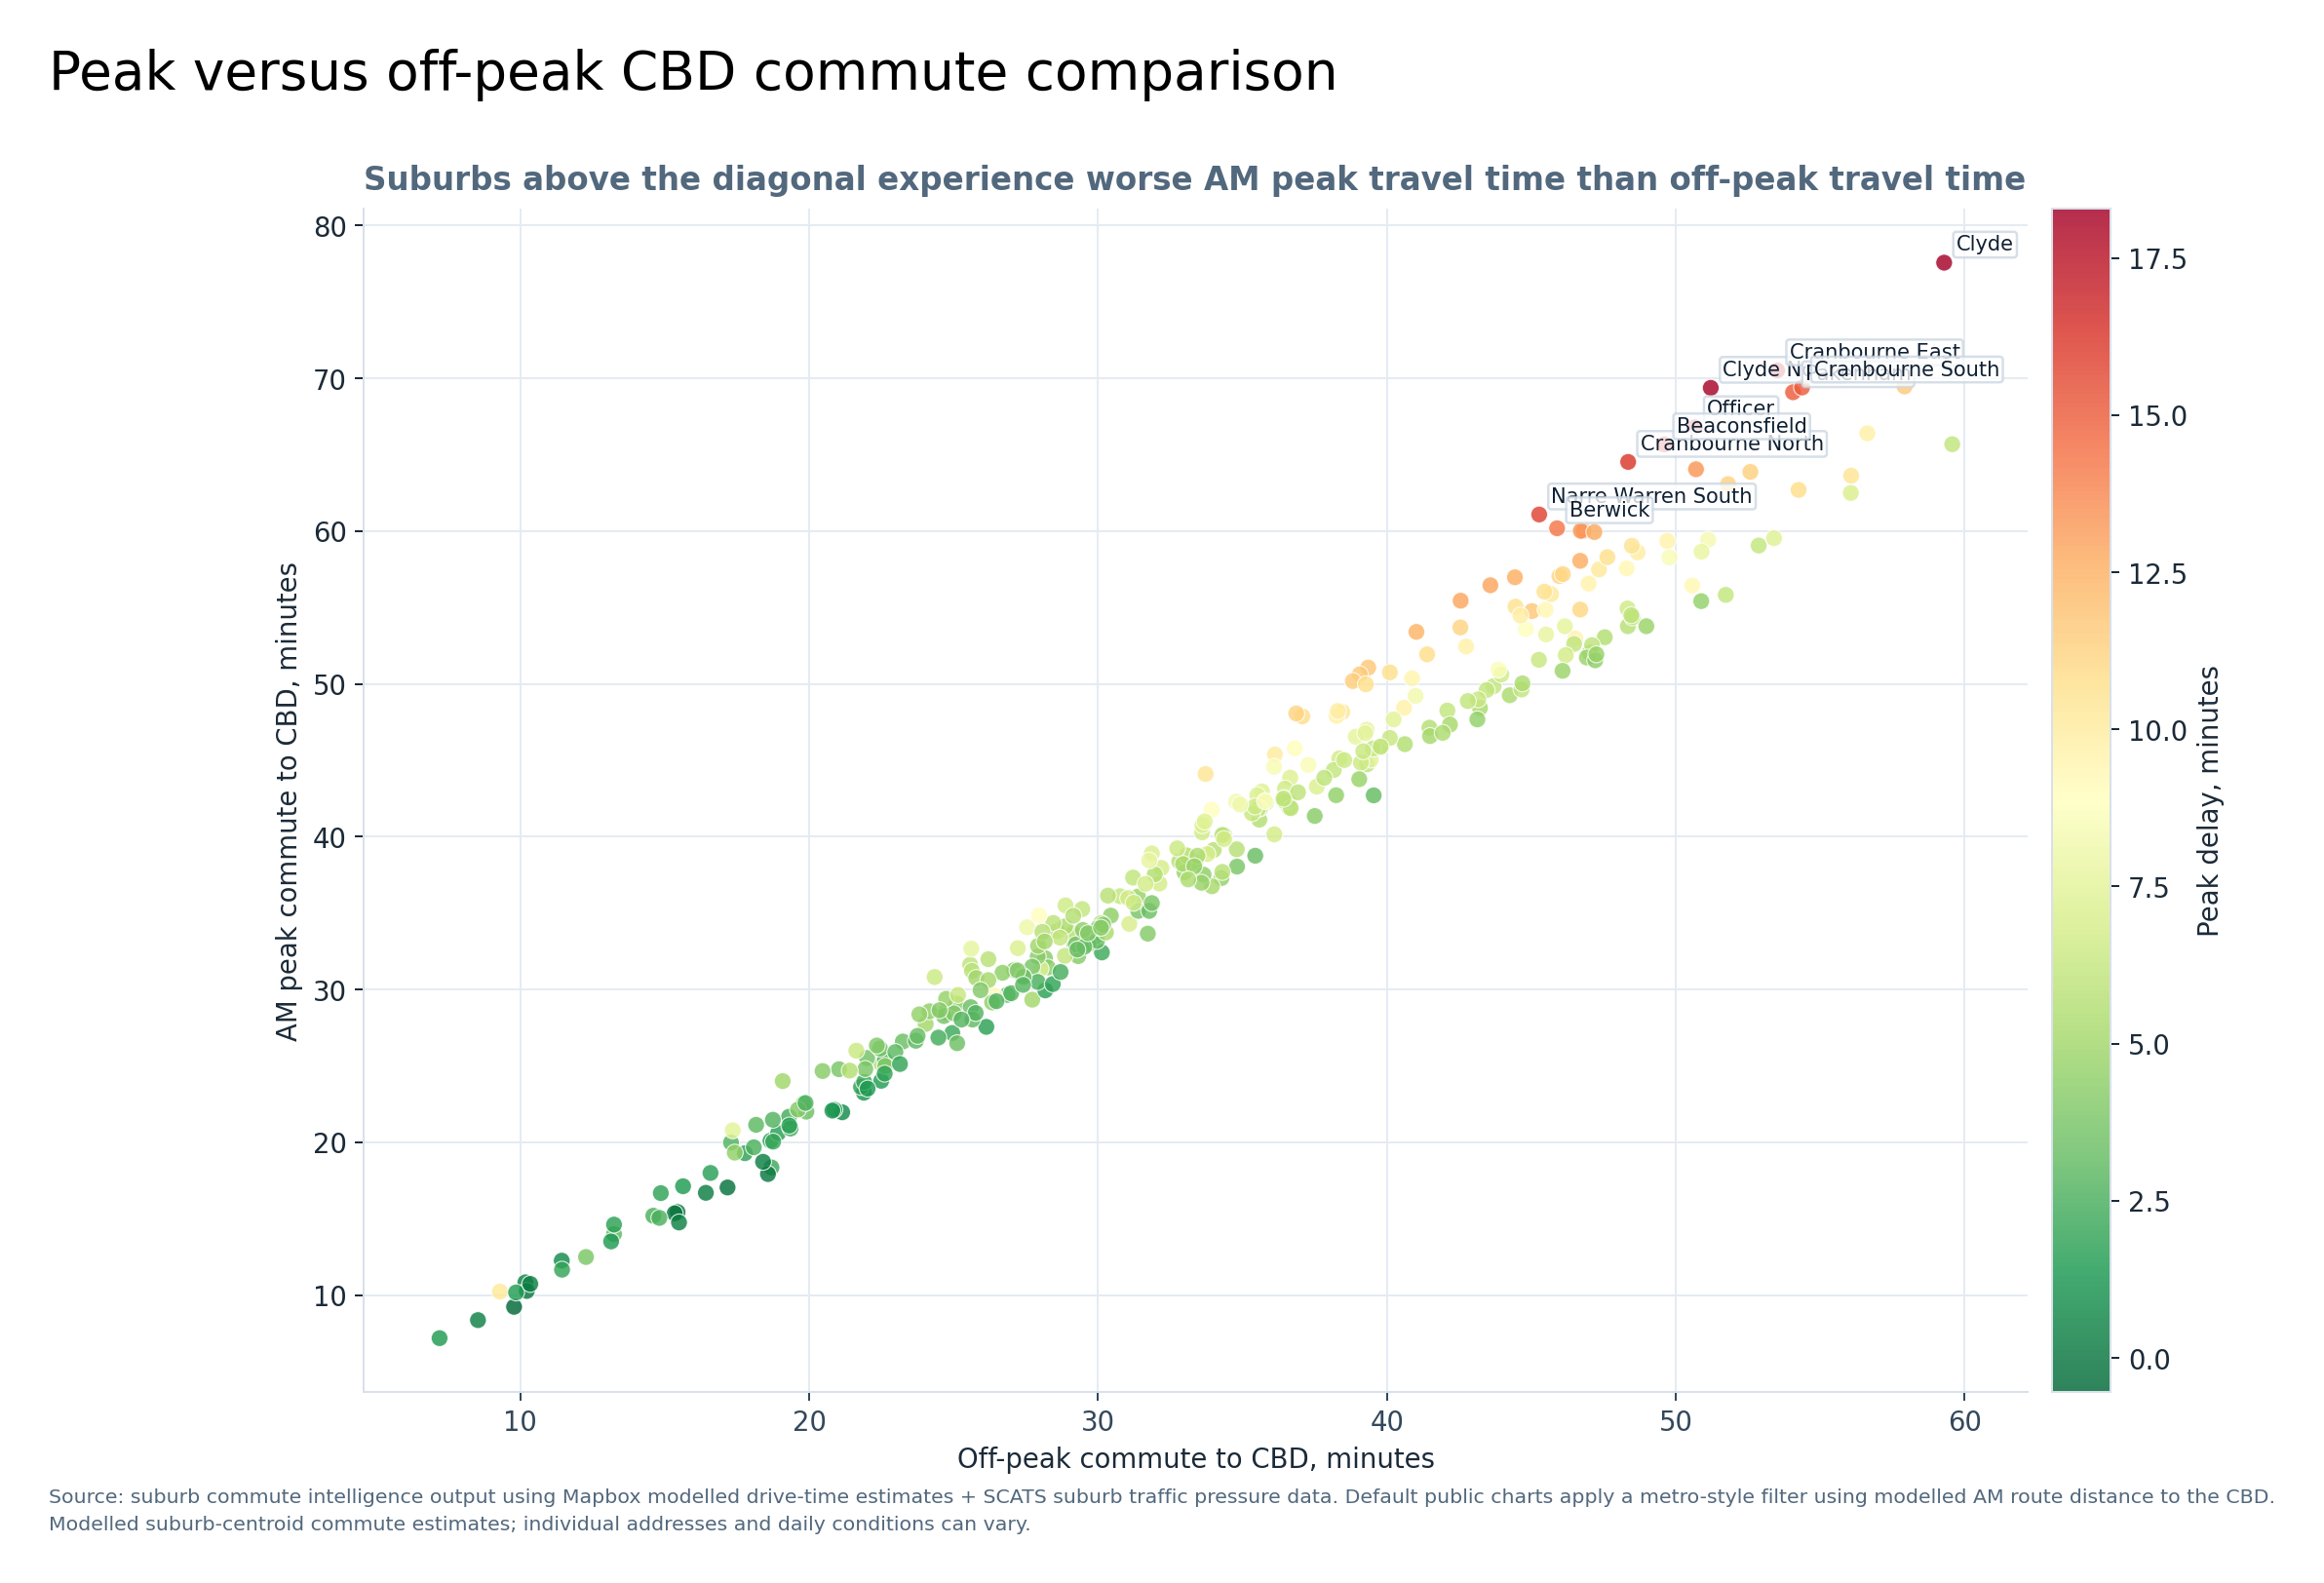
Peak versus off-peak CBD commute comparison
Compares off-peak and AM peak CBD commute estimates, coloured by peak delay penalty.
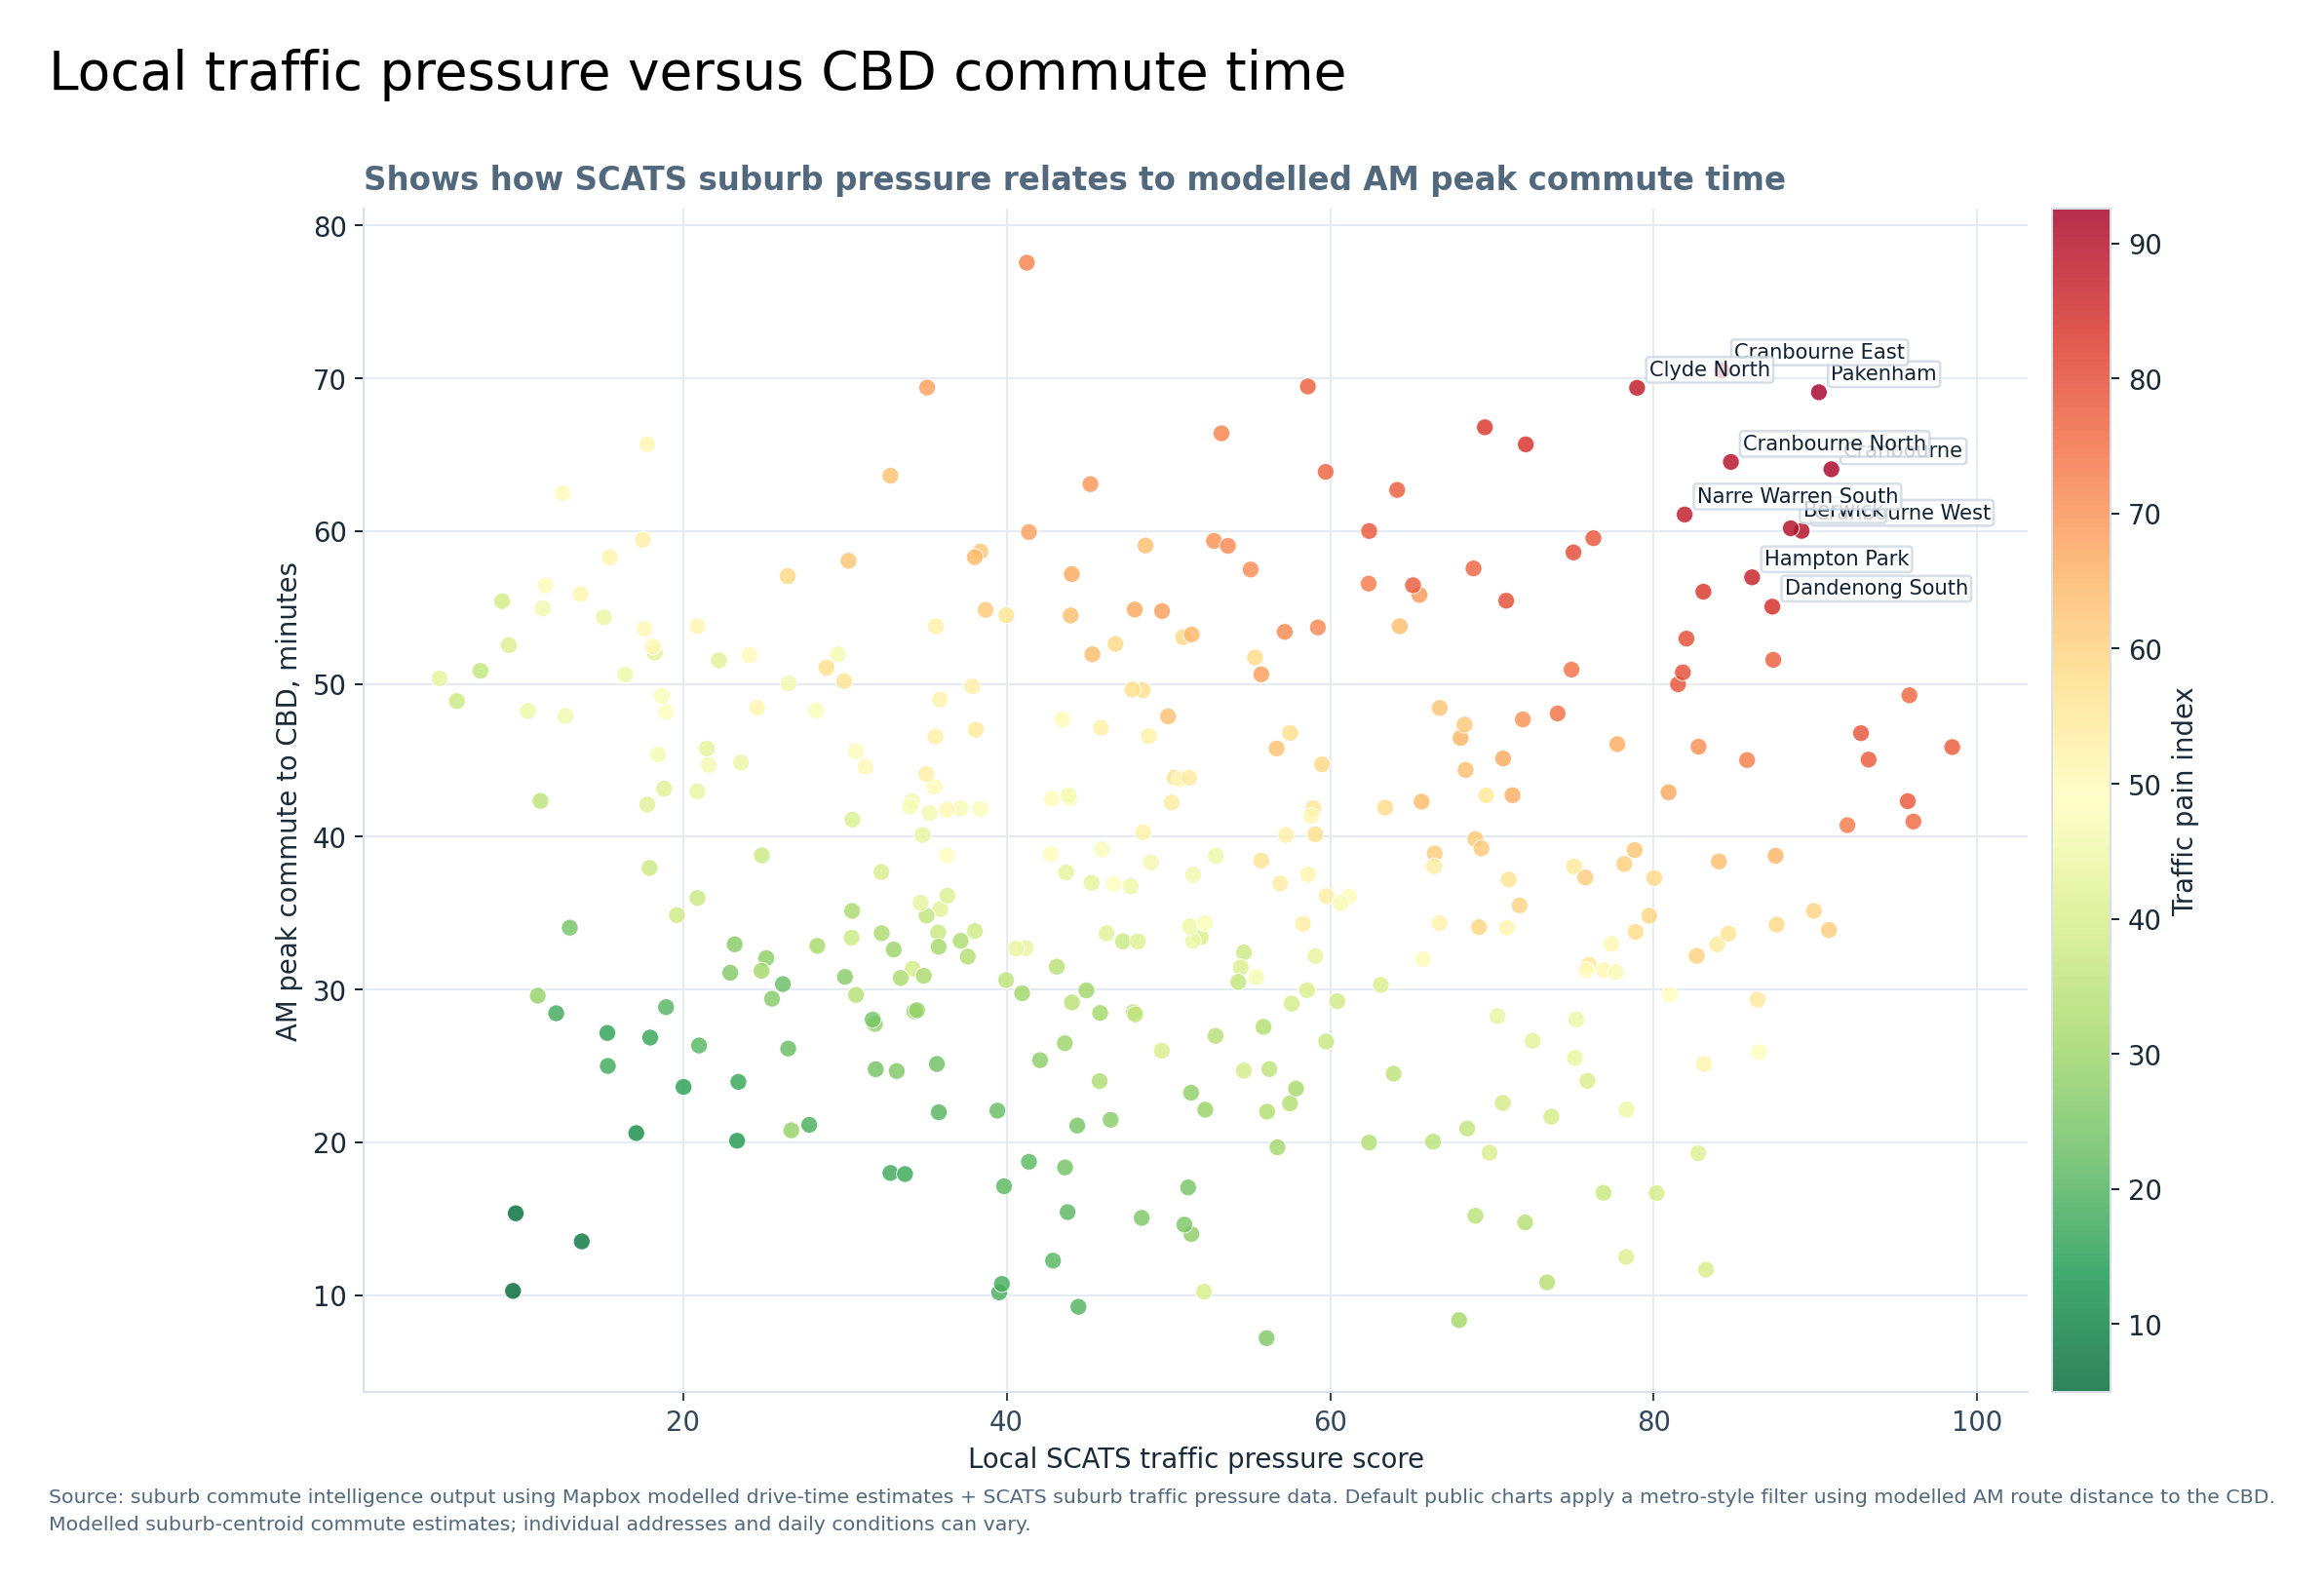
Local traffic pressure versus CBD commute time
Combines the observed local traffic pressure score with the modelled CBD commute estimate.
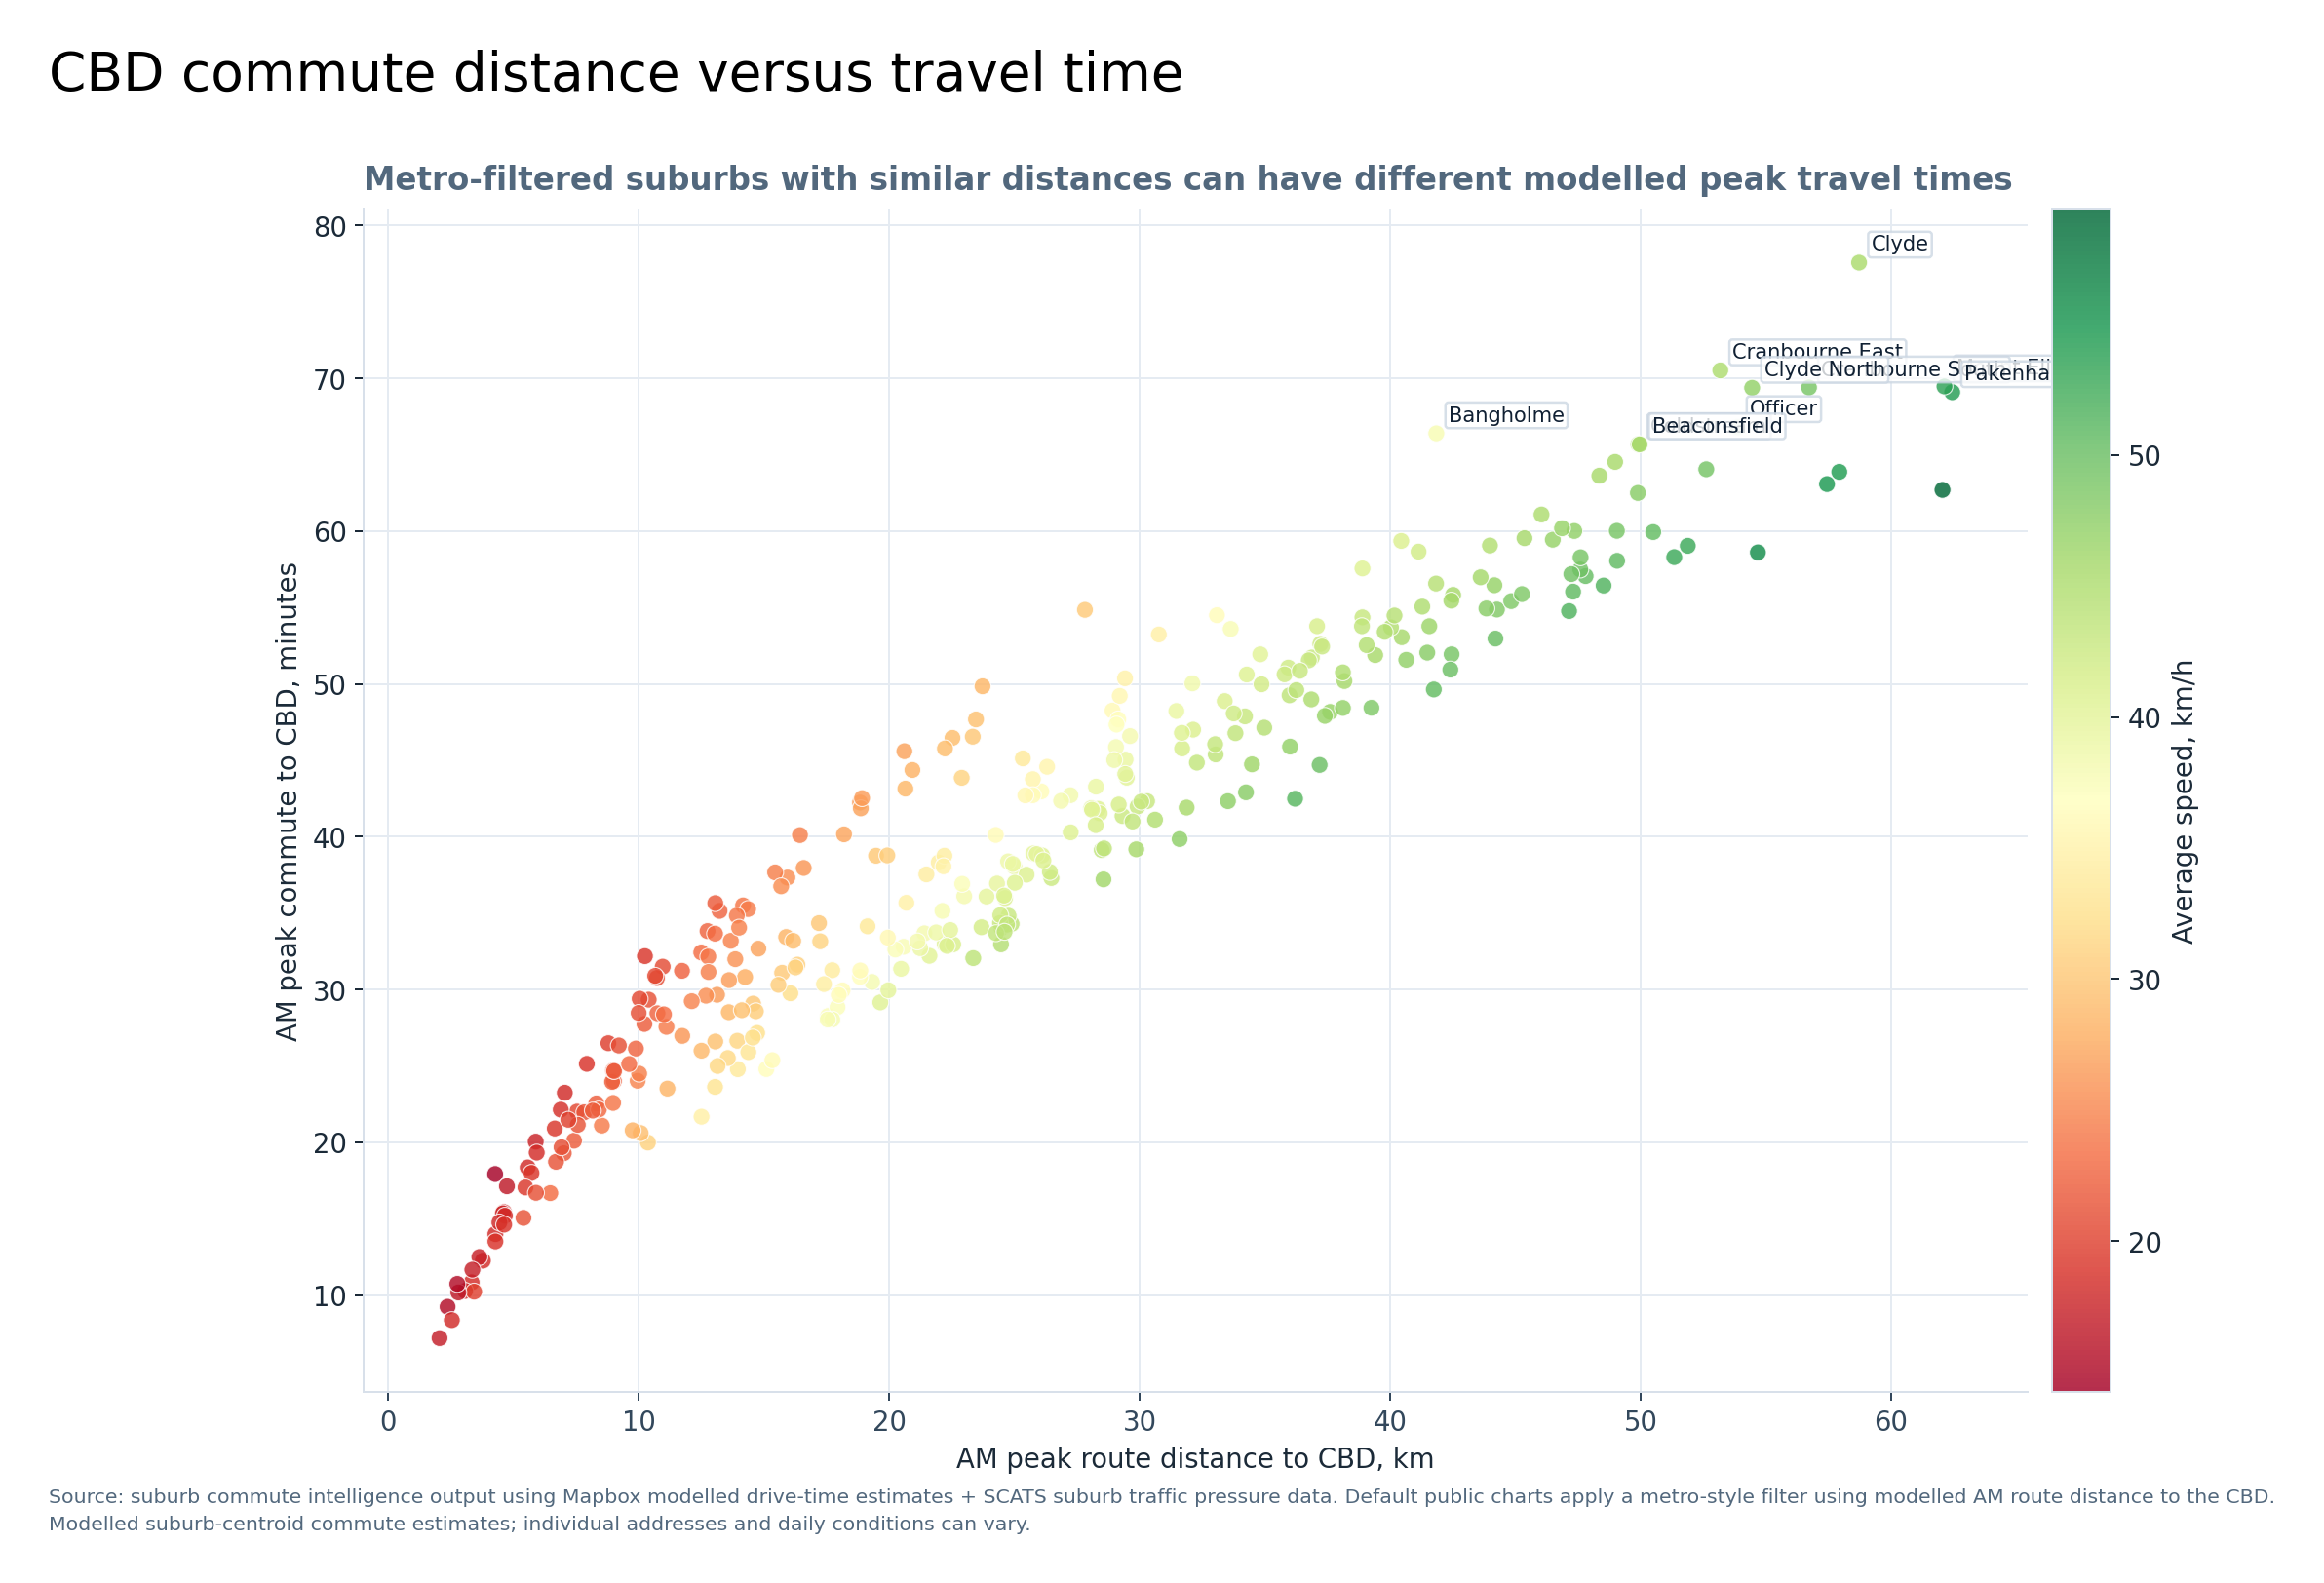
CBD commute distance versus travel time
Shows how route distance relates to modelled AM peak CBD commute time for metro-filtered suburbs.