
What needs attention now?
Current network focus
Loading current pressure points…
New · Seven-day baseline intelligence · v1.13
How unusual are conditions right now?
Current Melbourne freeway performance compared with the same clock-time periods across the latest completed QA-approved baseline days.
Loading recent baseline…
Loading current conditions against the recent observed baseline…
Building baseline
Historical baseline: building
Seven completed QA-approved days are enough for an early rolling time-of-day baseline. Weekday-specific normal conditions remain deliberately locked until repeated weekday observations accumulate.
Baseline interpretation: this is an early rolling clock-time comparison, not yet a mature weekday-specific “normal Monday/Tuesday/etc.” model. Missing source periods remain missing; failed or partial days must not be converted to zero.
Network now
Melbourne freeway conditions
Data quality
—
—
Freeway Visual Intelligence · v1.10
Melbourne freeway network — live visual status
A photographic live-status view of every freeway represented in the current DTP feed. The cards reuse the same governed live freeway summaries shown elsewhere on this page.
Waiting for live freeway status…
Waiting for current freeway status data…
How to read: “Affected” is the share of current monitored road sections classified Medium or Heavy. “Worst condition” is the most severe DTP condition present among the freeway’s monitored road sections; it does not mean the entire freeway is operating at that condition. Badge numbers always match the selected rank/order and read left-to-right, then top-to-bottom. Current pressure ranks affected road-section share first; worst-condition rank uses condition severity, then affected share and maximum delay. Click a card to filter and locate that freeway on the live map.
Spatial live intelligence
Melbourne freeway network — live map
Loading DTP freeway geometry…
Loading live map context…
Media view · Bridge vs Tunnel
West Gate Bridge vs West Gate Tunnel — live visual comparison
A high-impact operational comparison against each route’s own DTP nominal travel time.
Loading latest DTP source snapshot…
Loading current Bridge/Tunnel comparison…
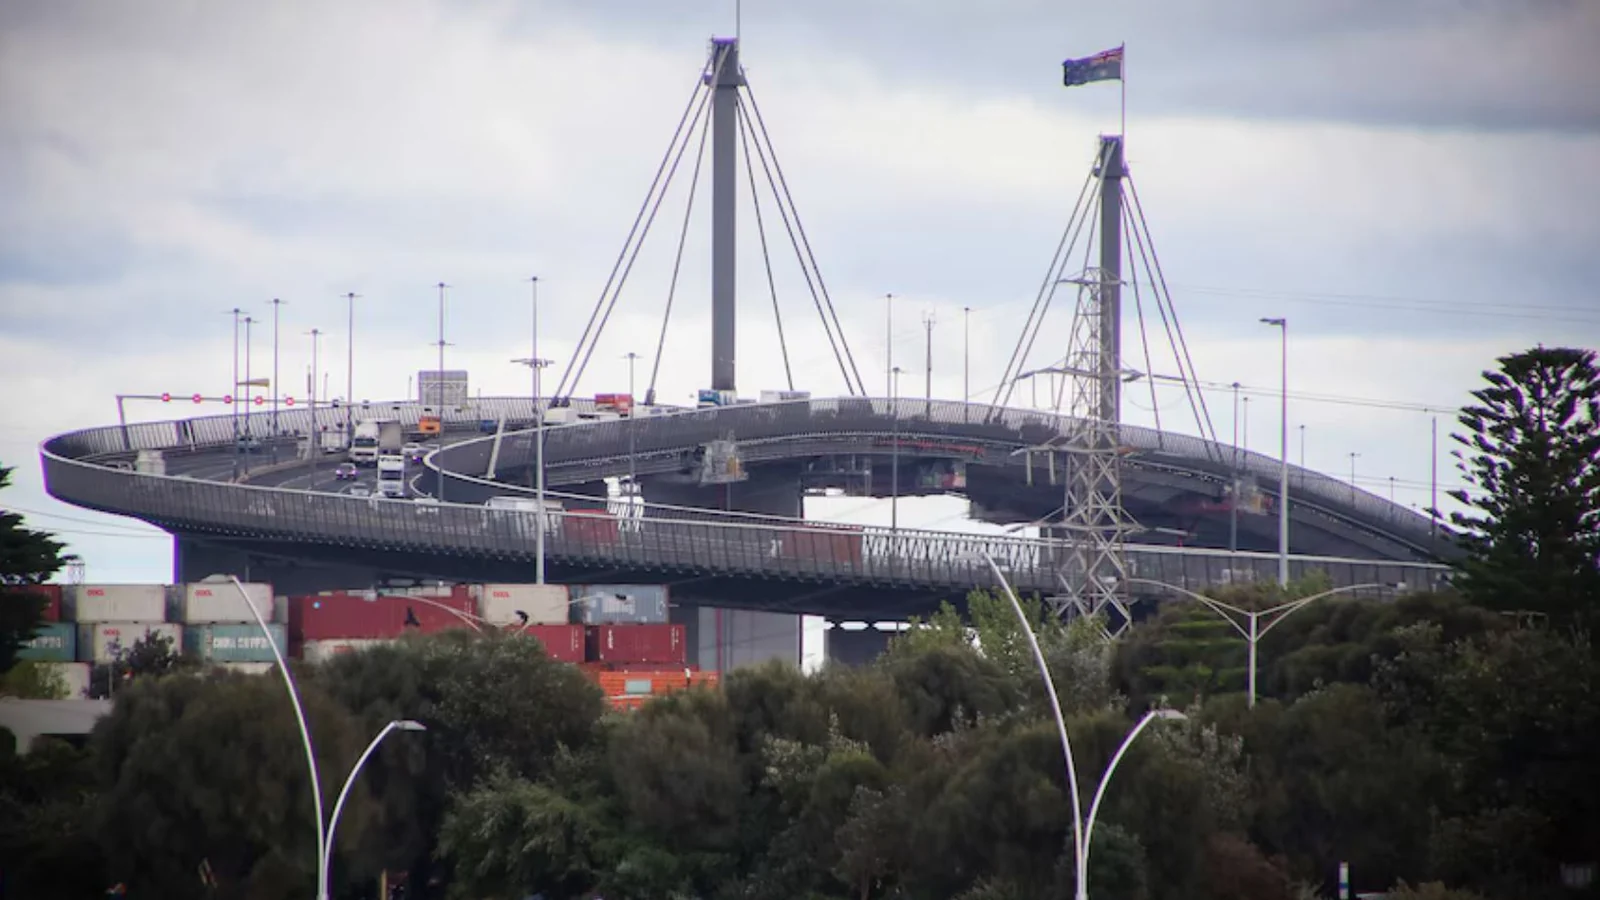
West Gate Fwy / Bridge crossing features
West Gate Bridge corridor
Inbound
—
Loading…
Outbound
—
Loading…

DTP features labelled “West Gate Tunnel”
West Gate Tunnel-labelled journeys
Inbound
—
Loading…
Outbound
—
Loading…
Dedicated live view
West Gate Tunnel
DTP features labelled “West Gate Tunnel”
Loading…
Direction totals sum the DTP features whose freeway name is exactly “West Gate Tunnel”. They are WGT-labelled journey values, not tunnel-bore-only travel times.
Dedicated live view
West Gate Freeway / Bridge
DTP West Gate Fwy bridge-crossing features
Loading…
This view uses the exact DTP West Gate Fwy features Williamstown Rd → Todd Rd inbound and Todd Rd → Williamstown Rd outbound. These features cross the West Gate Bridge corridor; the values should not be interpreted as bridge-deck-only travel times.
Flagship West Gate live intelligence
West Gate Bridge & Tunnel — live operational heatmap
Highest-resolution DTP source-time operational performance across the exact governed West Gate Bridge crossing and West Gate Tunnel-labelled features.
Loading West Gate operations…
What this shows: near-real-time operational performance — travel time, delay, speed, DTP condition and data substitution. What this does not show: vehicle volumes, unique vehicles, tunnel utilisation counts or routing share. Travel-time performance must not be presented as proof of how many vehicles are using the tunnel.
Highest source resolution
Last 2 hours — verified ~2-minute DTP source observations
Every column represents one distinct DTP source-time period; repeated collector polls are deduplicated.
24-hour context
West Gate operational context — 5-minute periods
Completed QA-PASS periods are governed; current-day closed periods remain provisional until daily QA.
WGT directional summaries sum the two exact DTP features labelled “West Gate Tunnel”. They are WGT-labelled journey values, not tunnel-bore-only travel times. Bridge rows use the exact governed Williamstown Rd ↔ Todd Rd crossing features and should not be interpreted as bridge-deck-only travel times.
Directional intelligence
Freeway directions under pressure
Click a column heading to sort · click a row to locate its worst segment on the map
| Freeway | Direction | Worst condition | Affected | Heavy | Medium | Avg speed | Max delay | Worst segment |
|---|
Current pressure points
Top bottlenecks
Click a column heading to sort · click a row to locate the segment on the map
| # | Freeway | Direction | Segment | Condition | Speed | Current | Nominal | Above nominal | DTP delay |
|---|
Recurring pressure · Spatial baseline intelligence · v1.13.1
Most persistent bottlenecks — recent baseline
A map-first view of where freeway pressure repeatedly returns across completed QA-approved history. Cool colours indicate lower recurring pressure; hot colours identify structurally persistent trouble spots.
Loading persistent bottlenecks…
Recent baseline structural pressure map · not live traffic
| # | Freeway | Direction | Segment | Periods affected | Heavy periods | Typical bad time | Persistence score |
|---|---|---|---|---|---|---|---|
| Waiting for governed baseline output… | |||||||
Interpretation: this is a structural recurrence map built from observed governed baseline periods, not a live congestion map. Persistence is descriptive and does not by itself establish the cause of congestion. Grey sections are geometry without a map-eligible persistence row for the selected scope.
Whole-network view
Freeway-by-freeway status
Click a column heading to sort
| Freeway | Worst condition | Affected | Features | Heavy | Medium | Avg speed | Median delay | Max delay |
|---|
Network rolling performance
Melbourne freeway network — rolling 24 hours
Five-minute network-wide pressure and speed-distribution history across the monitored DTP freeway features.
Loading network graph…
Network pressure
Affected share = Medium + Heavy · Heavy share = Heavy only
Network speed distribution
Median P50 speed and lower-network P15 speed across populated features
How to read: solid lines are completed QA-PASS governed periods; dashed segments are current-day provisional closed five-minute periods. Live points are shown only when the current snapshot is fresh. Blank or missing conditions remain Blank/missing rather than being treated as Light. Speed percentiles use populated feature speed values only.
Where pressure is developing
Freeway-direction pressure heatmap — last 6 hours
Each cell is one freeway direction in one closed five-minute period. Darker cells indicate a larger share of monitored features under pressure.
Loading heatmap…
0%
<10%
10–25%
25–50%
50–75%
75–100%
How to read: affected share is the percentage of observed features in a freeway direction classified Medium or Heavy during the five-minute period. Heavy share can be selected separately. Blank/missing conditions remain missing rather than being treated as Light. Completed QA-PASS periods are governed; current-day closed periods are provisional.
Rolling performance
West Gate — rolling 24-hour performance
Five-minute travel-time history for the DTP West Gate Tunnel-labelled journeys and governed West Gate Freeway / Bridge crossing features.
Loading rolling graph…
West Gate Tunnel
Inbound and outbound DTP features labelled “West Gate Tunnel”
West Gate Freeway / Bridge
Governed Williamstown Rd ↔ Todd Rd crossing features
How to read: solid actual lines are completed QA-PASS history; dashed actual segments are current-day provisional five-minute periods. Nominal reference lines are DTP-supplied nominal travel times. A live point is shown only when the live snapshot is fresh. Provisional periods are replaced by governed history after daily compaction and QA. WGT values are WGT-labelled journeys, not tunnel-bore-only travel times; bridge values are crossing features, not bridge-deck-only travel times.
Today against recent observed conditions
Typical Melbourne day vs today
Five-minute network pressure profile. The recent baseline is the median/typical clock-time profile across completed QA-approved baseline days; today is overlaid where observations exist.
Loading time-of-day comparison…
Network affected share
Medium + Heavy share · recent clock-time baseline vs today
Most unusual conditions now
Freeway directions whose current pressure or speed differs most from their recent clock-time baseline.
Waiting for freeway-direction anomaly output…
Important: with only one observation of each weekday in the first seven days, this panel compares clock time across the recent rolling history. Weekday-specific baselines should be introduced only after repeated weekday observations have accumulated.
Evidence over time
Historical Performance & Reliability
Loading historical baseline…
Historical journey distribution
West Gate Tunnel
| Direction | Coverage | Typical P50 | P85 | P95 | Worst | P85 delay | >25% nominal | Heavy |
|---|
Historical bridge corridor
West Gate Freeway / Bridge
| Direction | Coverage | Typical P50 | P85 | P95 | Worst | P85 delay | P15 speed | >25% nominal | Heavy |
|---|
Historical freeway directions
Reliability ranking
| # | Freeway | Direction | Features | P50 speed | P15 speed | P50 delay | P85 delay | P95 delay | Heavy | Affected |
|---|
Historical statistics use only completed Melbourne-local days that passed the daily archive quality gate. P50/P85/P95 values describe distributions of governed 5-minute DTP feature-period observations. Failed, partial and current incomplete days are excluded rather than treated as zero.
Comparative evidence over time
Melbourne Freeway Form Table — Historical Rankings
Compare sustained freeway pressure, heavy-condition exposure, delay and speed reliability across completed governed history.
Loading historical rankings…
Analysis window
QA-approved completed days only
Visual historical intelligence
Historical ranking charts
The charts use the same ranking-eligible governed days as the freeway form table below.
Loading chart data…
Whole-freeway comparison
Historical freeway leaderboard — Average pressure
Uses the selected ranking mode and analysis window.
Persistence through time
Daily pressure-rank history
Tracks the current top-five pressure-ranked freeways across ranking-eligible days. Rank #1 is highest pressure.
Freeway × day
Historical pressure heatmap
Each cell is the freeway's daily average pressure percentage for one ranking-eligible day.
0%
<10%
10–25%
25–50%
50–75%
75–100%
Pressure vs reliability
Average pressure vs P95 DTP delay
Separates sustained broad pressure from high tail-delay exposure.
Speed reliability
P15 vs P50 speed
Compares lower-network speed with typical populated-feature speed.
Ranking persistence
Days in the Top 3 — including #1 days
Stacked bars separate days ranked #1 from additional days ranked #2 or #3, so the total bar length equals Top-3 days.
How to read: chart data use exactly the same ranking-eligible completed days as the historical rankings. Missing source periods remain missing rather than being estimated or forward-filled. BUILDING windows are shown transparently but should not be interpreted as mature long-window evidence until sufficient eligible history has accumulated.
| Rank | Freeway | Avg pressure | Heavy time | P95 delay | Typical speed | P15 speed | #1 days | Top-3 days | Condition coverage |
|---|---|---|---|---|---|---|---|---|---|
| Loading governed historical rankings… | |||||||||
How these rankings are governed
Historical rankings use completed QA-approved Melbourne-local days only. A day must achieve at least 95% governed five-minute source-period coverage and at least 95% retained-period completeness against a fixed 226-road-section governed inventory. Unknown or wholly missing governed feature IDs fail the ranking gate. Missing source periods remain missing rather than being estimated or forward-filled.
Average pressure is the mean five-minute share of condition-bearing monitored road sections classified Medium or Heavy. Heavy time is the share of condition-bearing road-section periods classified Heavy. P95 delay uses DTP's supplied delay field. Rankings are descriptive evidence and do not establish causation.
Methodology
How to read this page
Worst condition means the most severe DTP condition present among the constituent features; it does not mean the entire freeway is operating at that condition. Affected share is the proportion of features currently classified Medium or Heavy.
Displayed delay uses DTP's supplied delay field rather than recalculating it from rounded travel-time values. Missing and Blank values remain missing/Blank. Whole-freeway travel times are not created by summing every feature because DTP route structures can overlap and would risk double-counting segments.
This page is an independent analytical presentation by Spotswood Trailers / Traffic Analytics using Transport Victoria / DTP Freeway Travel Time source data.